Week 10 NHS Test and Trace data summary. 30/7/20 to 05/08/20.
Increase in cases for four consecutive weeks. And there’s some really interesting bits in the data (including some potential good news).
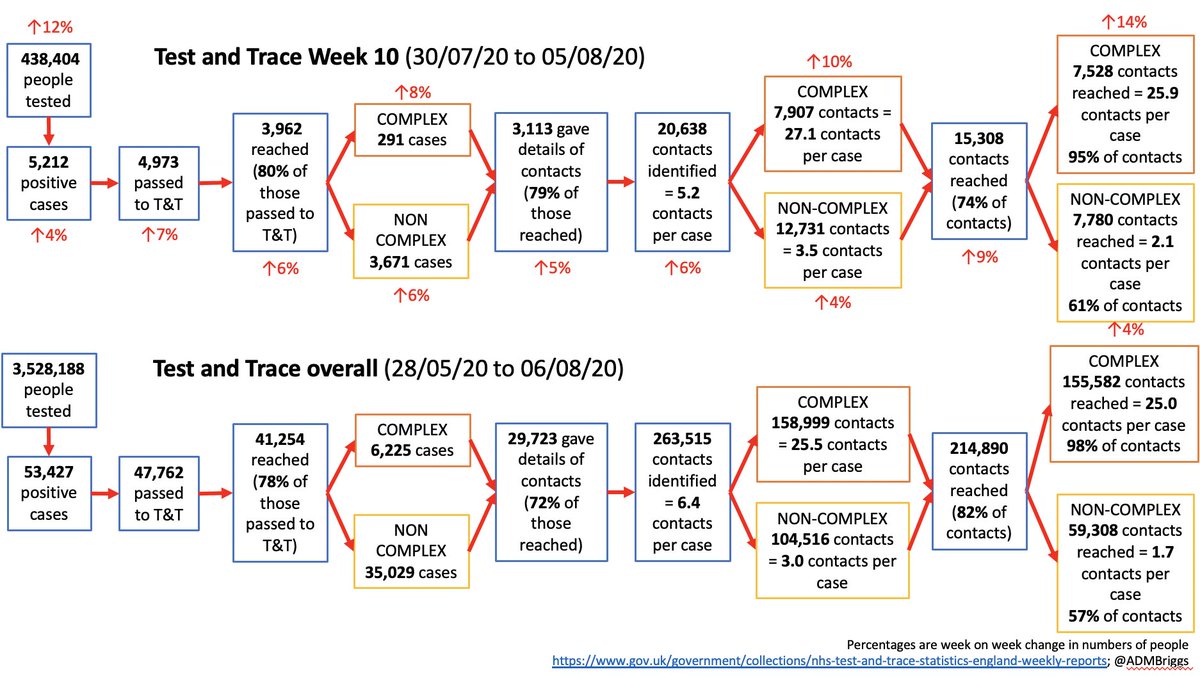
Summary in picture, detail in thread https://abs.twimg.com/emoji/v2/... draggable="false" alt="👇" title="Rückhand Zeigefinger nach unten" aria-label="Emoji: Rückhand Zeigefinger nach unten">
https://www.gov.uk/government/publications/nhs-test-and-trace-england-and-coronavirus-testing-uk-statistics-30-july-to-5-august-2020">https://www.gov.uk/governmen...
Increase in cases for four consecutive weeks. And there’s some really interesting bits in the data (including some potential good news).
Summary in picture, detail in thread
https://www.gov.uk/government/publications/nhs-test-and-trace-england-and-coronavirus-testing-uk-statistics-30-july-to-5-august-2020">https://www.gov.uk/governmen...
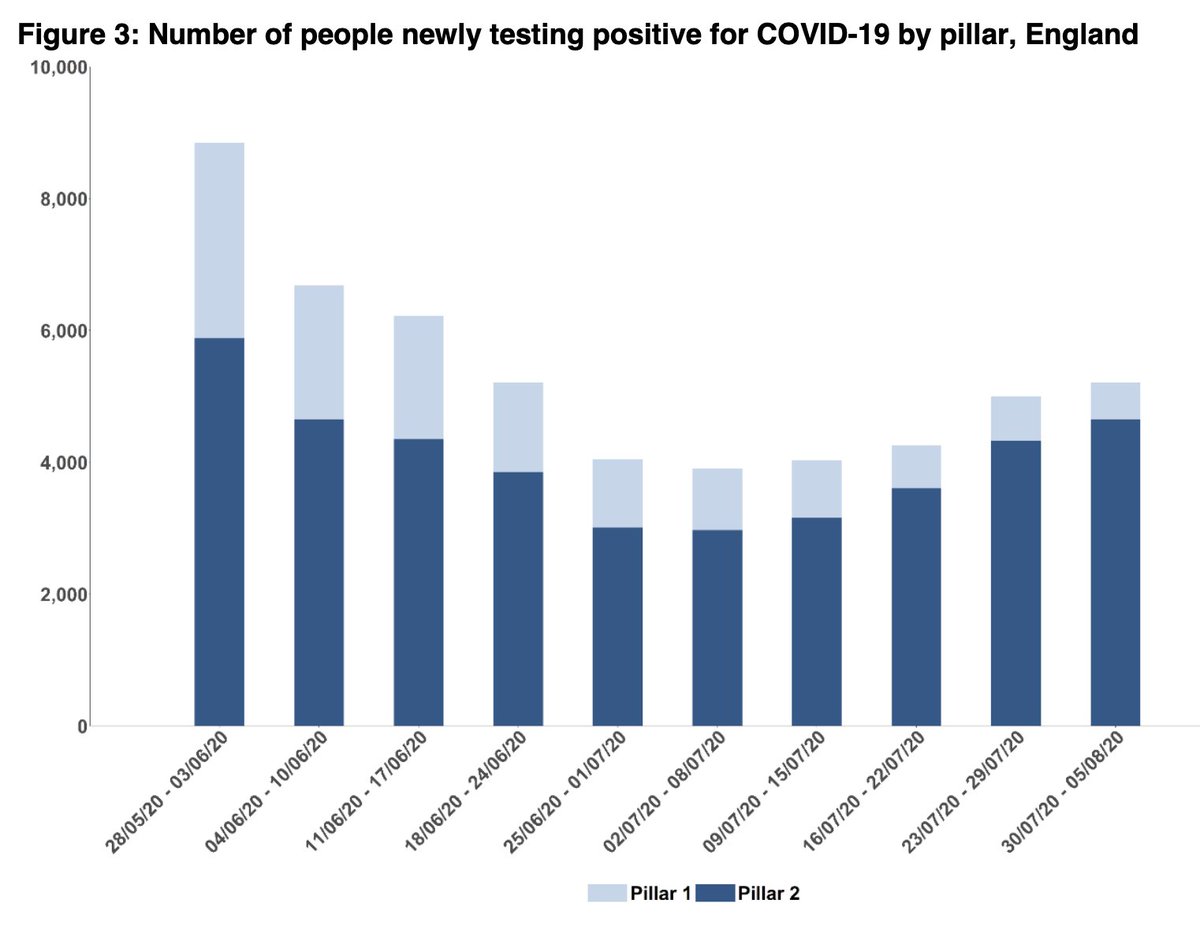
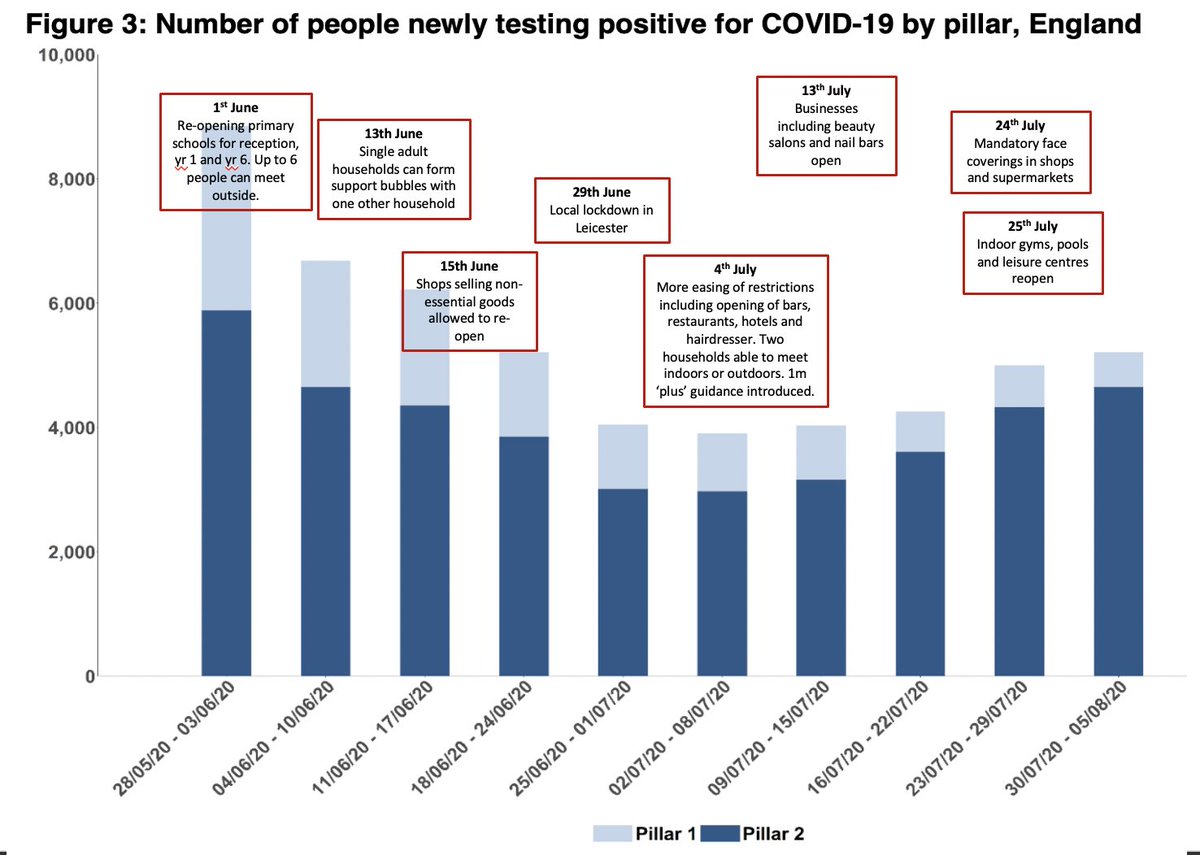
KEY POINT - Increase in cases four weeks in a row, BUT just a 4% increase on week 9 (5,212 vs 4,998) compared with 17% the week before.
For comparison, week 6 to 7 was a 3% rise in cases, wk 7 to 8 was a a 6% rise.
For comparison, week 6 to 7 was a 3% rise in cases, wk 7 to 8 was a a 6% rise.
The increase is all pillar 2 community cases (up 8%; 4,327 to 4,657).
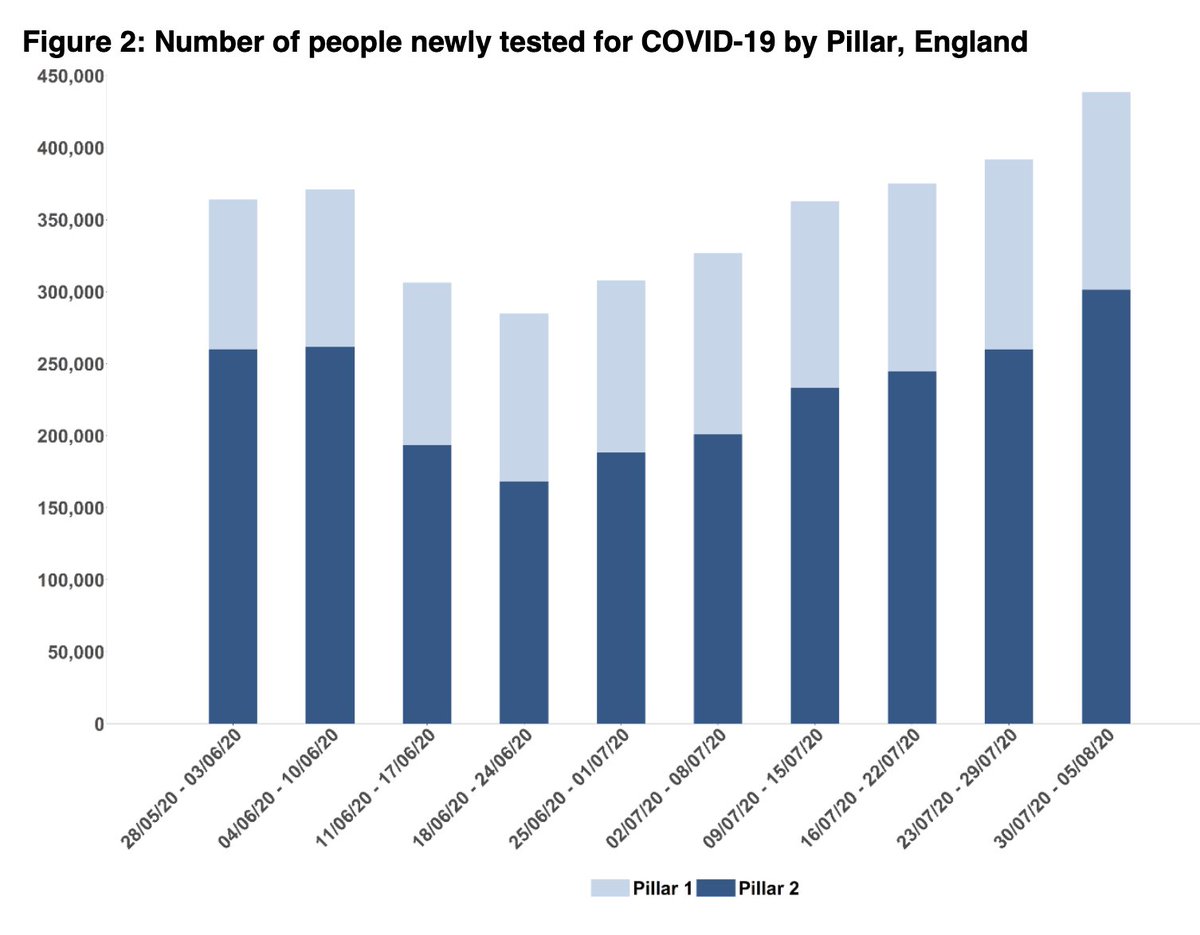
But there’s a 16% increase in pillar 2 tests, with the pillar 2 percentage positive falling for the first time since wk 7 from 1.67% to 1.55%.
Pillar 1 positive rate also fallen from 0.51% to 0.40%
But there’s a 16% increase in pillar 2 tests, with the pillar 2 percentage positive falling for the first time since wk 7 from 1.67% to 1.55%.
Pillar 1 positive rate also fallen from 0.51% to 0.40%
Tough to infer changes to community infection rates from this.
First, why more testing?
-Could be better test access & availability (a good thing).
-Could be people more willing to get tested (a good thing).
-Could be increase in other illnesses circulating that mimic COVID.
First, why more testing?
-Could be better test access & availability (a good thing).
-Could be people more willing to get tested (a good thing).
-Could be increase in other illnesses circulating that mimic COVID.
In each scenario, hard to say if community infection rates per 100,000 people are rising/falling/static.
But they are certainly not exponentially growing and may well be falling. And there& #39;s some evidence to support this:
But they are certainly not exponentially growing and may well be falling. And there& #39;s some evidence to support this:
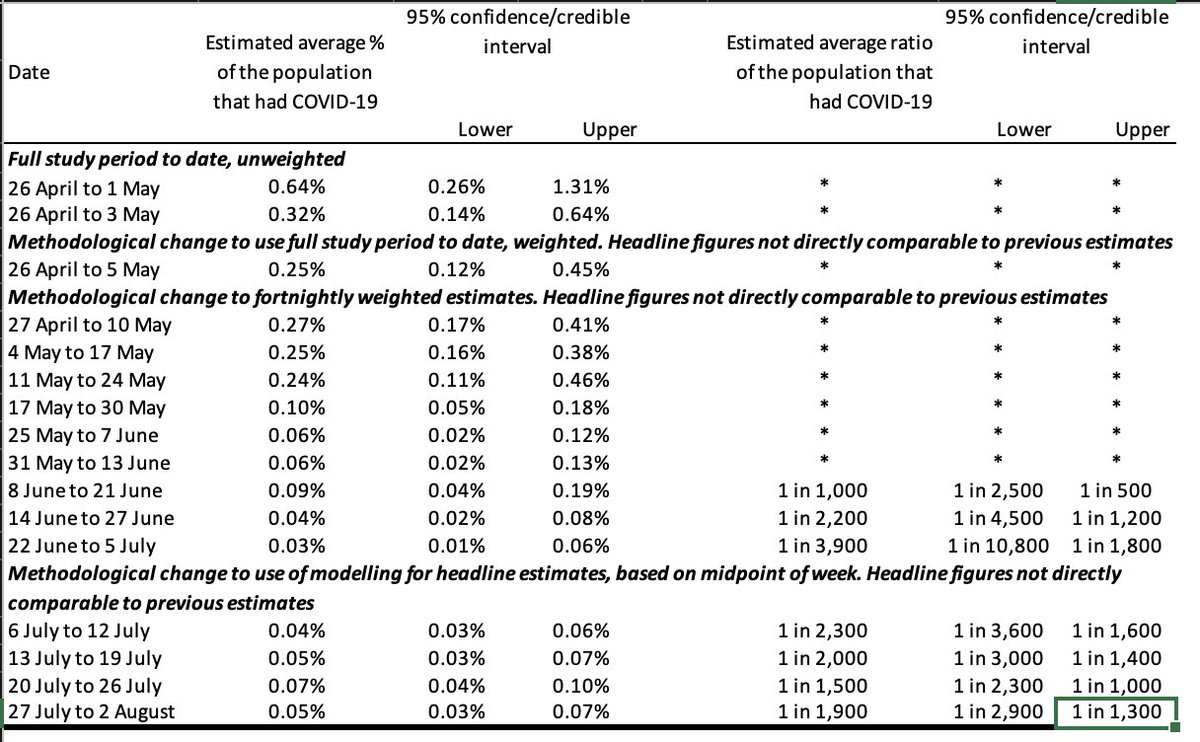
A fall in infection rates would be consistent with ONS infection survey data suggesting fall in prevalence in Eng from 0.07% of pop in wk ending 26th July, to 0.05% of pop in wk ending 2nd August.
https://www.ons.gov.uk/peoplepopulationandcommunity/healthandsocialcare/conditionsanddiseases/datasets/coronaviruscovid19infectionsurveydata">https://www.ons.gov.uk/peoplepop...
https://www.ons.gov.uk/peoplepopulationandcommunity/healthandsocialcare/conditionsanddiseases/datasets/coronaviruscovid19infectionsurveydata">https://www.ons.gov.uk/peoplepop...
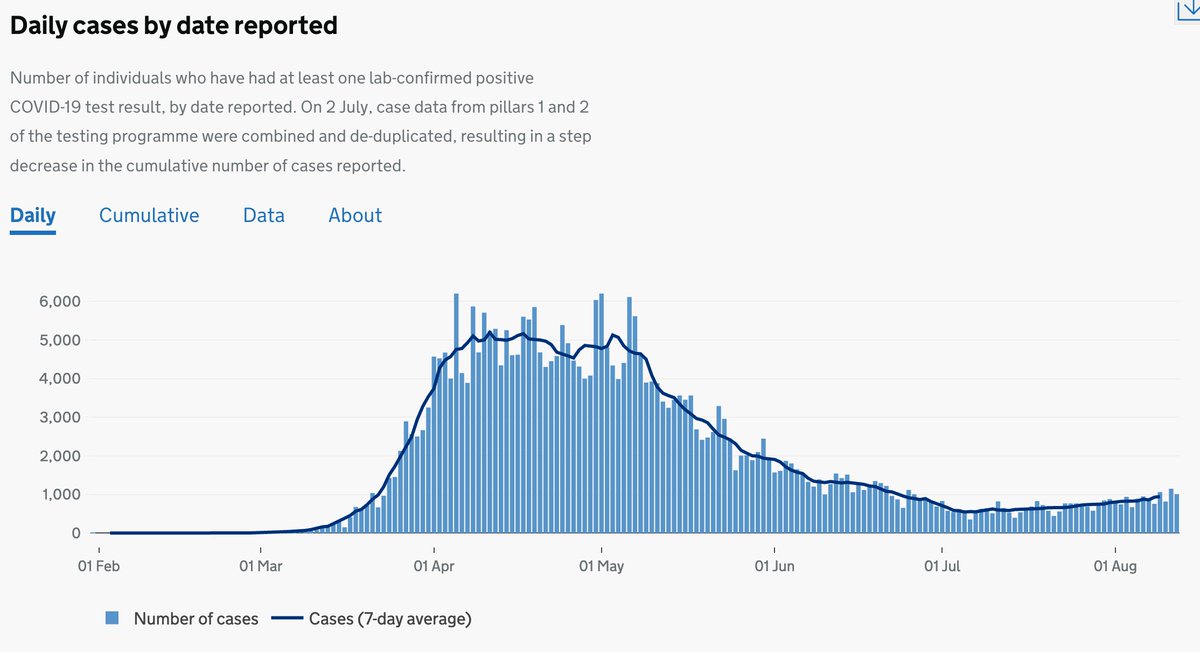
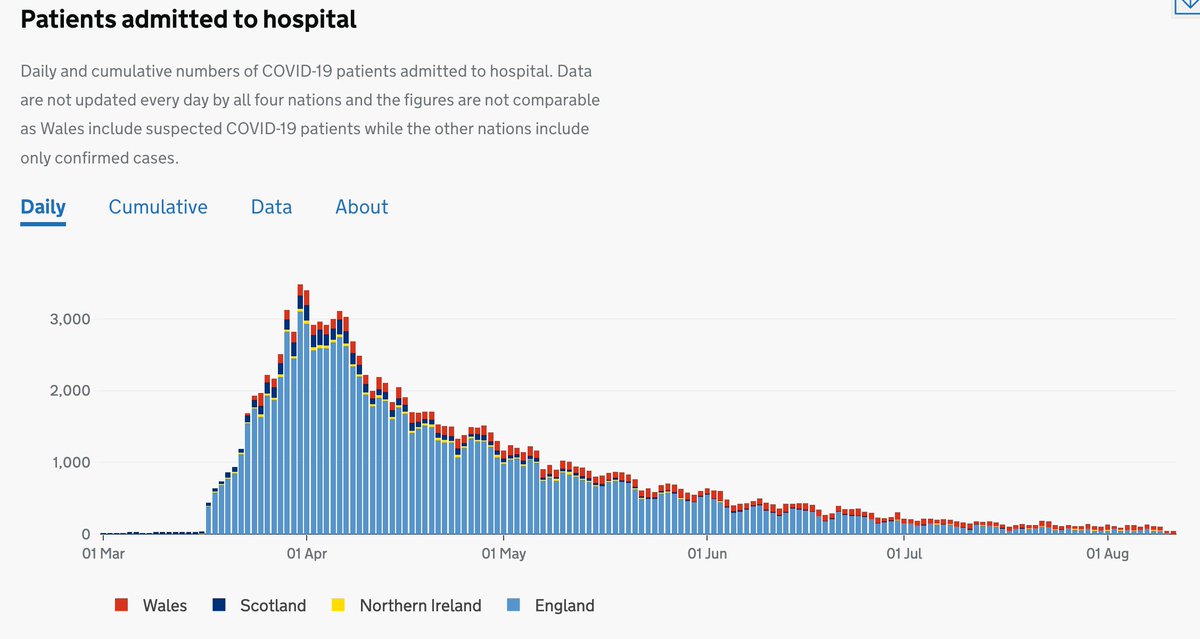
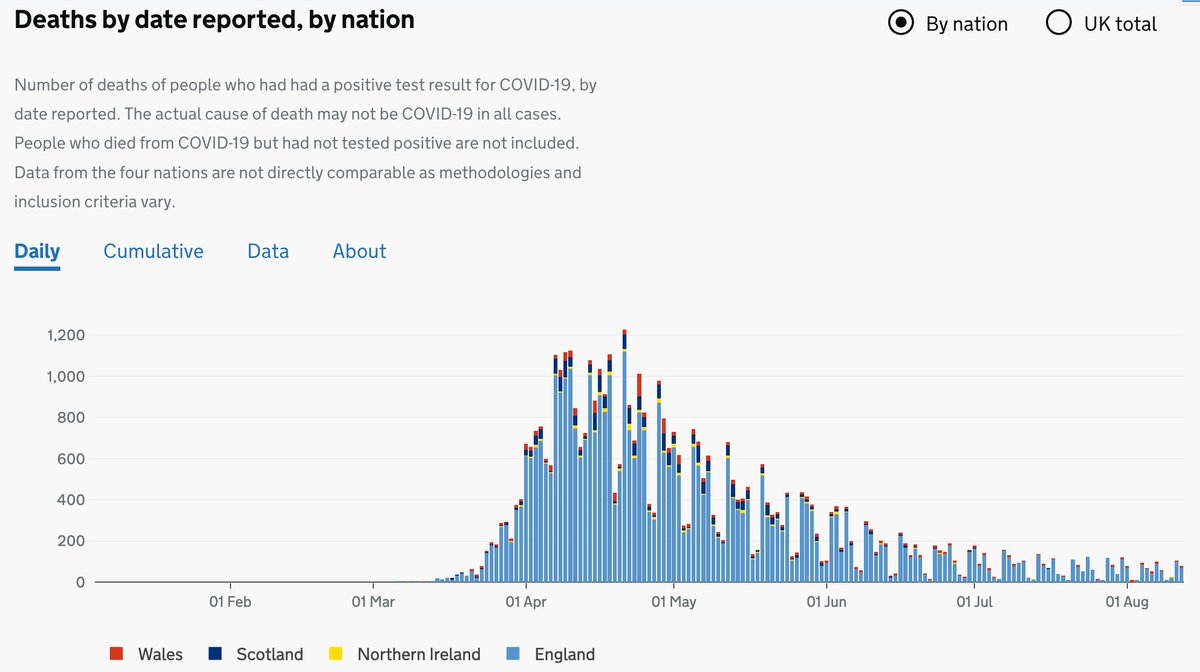
And daily number of UK cases isn& #39;t growing exponentially (more linear), plus deaths and hospitalisations not increasing (yet). Both may also mean that community infection rates aren’t rising, or that younger and less vulnerable people are being infected.
https://coronavirus.data.gov.uk/cases ">https://coronavirus.data.gov.uk/cases&quo...
https://coronavirus.data.gov.uk/cases ">https://coronavirus.data.gov.uk/cases&quo...
Having said that, ONS still estimated 3,700 cases/day in wk ending 2nd August. Testing in England for wk10 is only finding around 750/day, so still lots of people not getting tested/asymptomatic
And there were >1,000 cases in Eng on 11th August & >1,000 in UK in 3days of past 4.
And there were >1,000 cases in Eng on 11th August & >1,000 in UK in 3days of past 4.
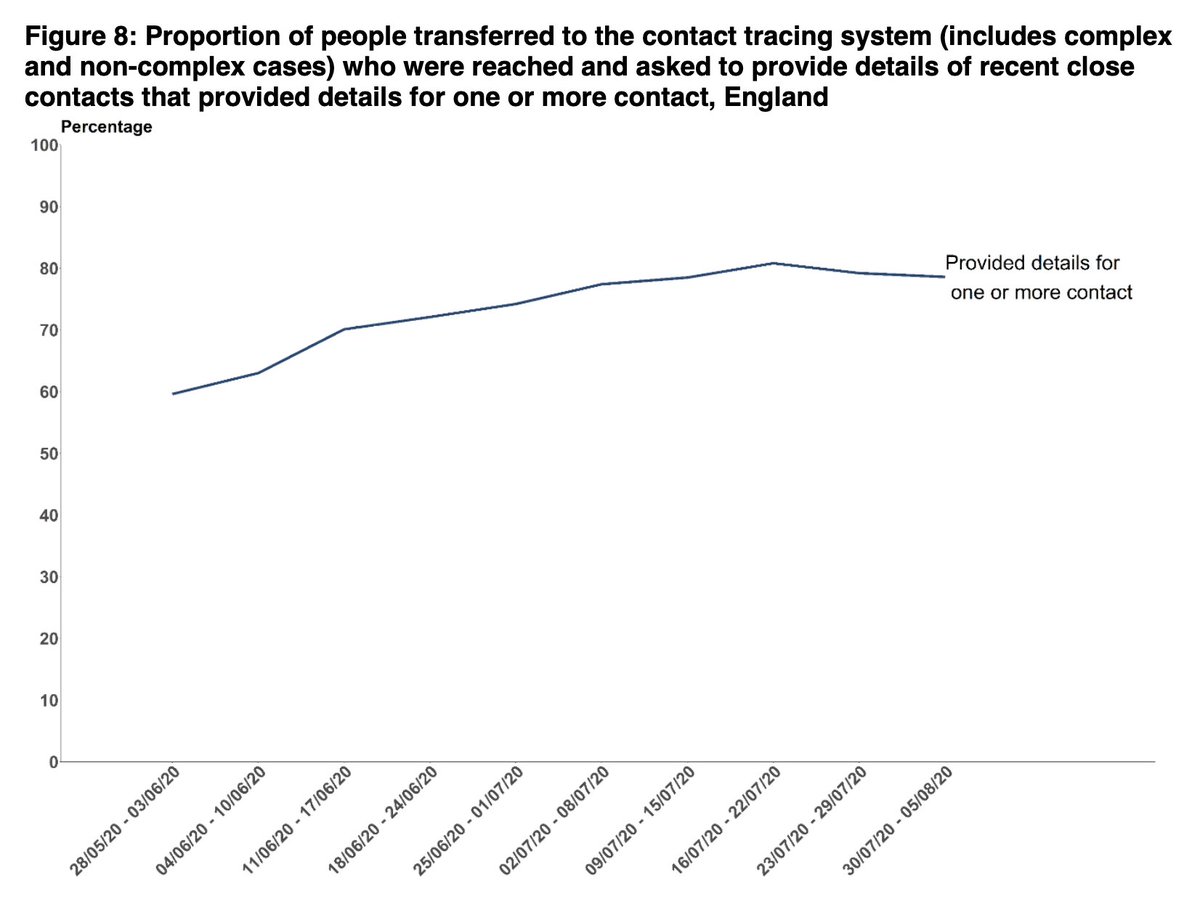
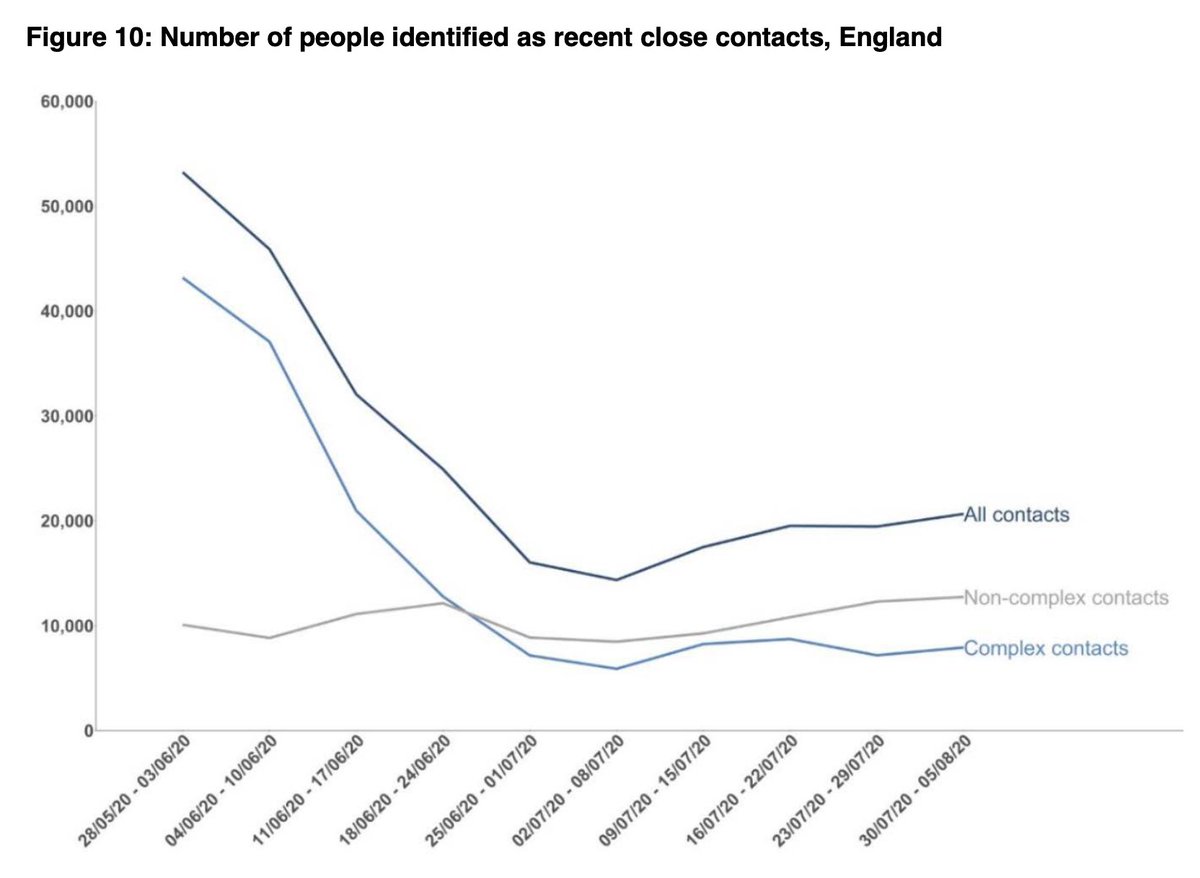
6% increase in number of close contacts identified from wk 9 (19,444 to 20,638), and percentage subsequently reached risen from 72% to 74%.
This is due to more contacts reached among complex cases. For non-complex, % reached has stayed the same at 61%.
This is due to more contacts reached among complex cases. For non-complex, % reached has stayed the same at 61%.
And rise in total contacts is simply due to more cases being transferred reached T&T.
Numbers of contacts/case has stayed almost identical to week 9 at 5.2 contacts per case over all, 3.5 per non-complex case and 27.2 per complex case.
Numbers of contacts/case has stayed almost identical to week 9 at 5.2 contacts per case over all, 3.5 per non-complex case and 27.2 per complex case.
So no ongoing fluctuation in contacts per complex case (as discussed last week https://twitter.com/ADMBriggs/status/1291510934637359106?s=20)">https://twitter.com/ADMBriggs...
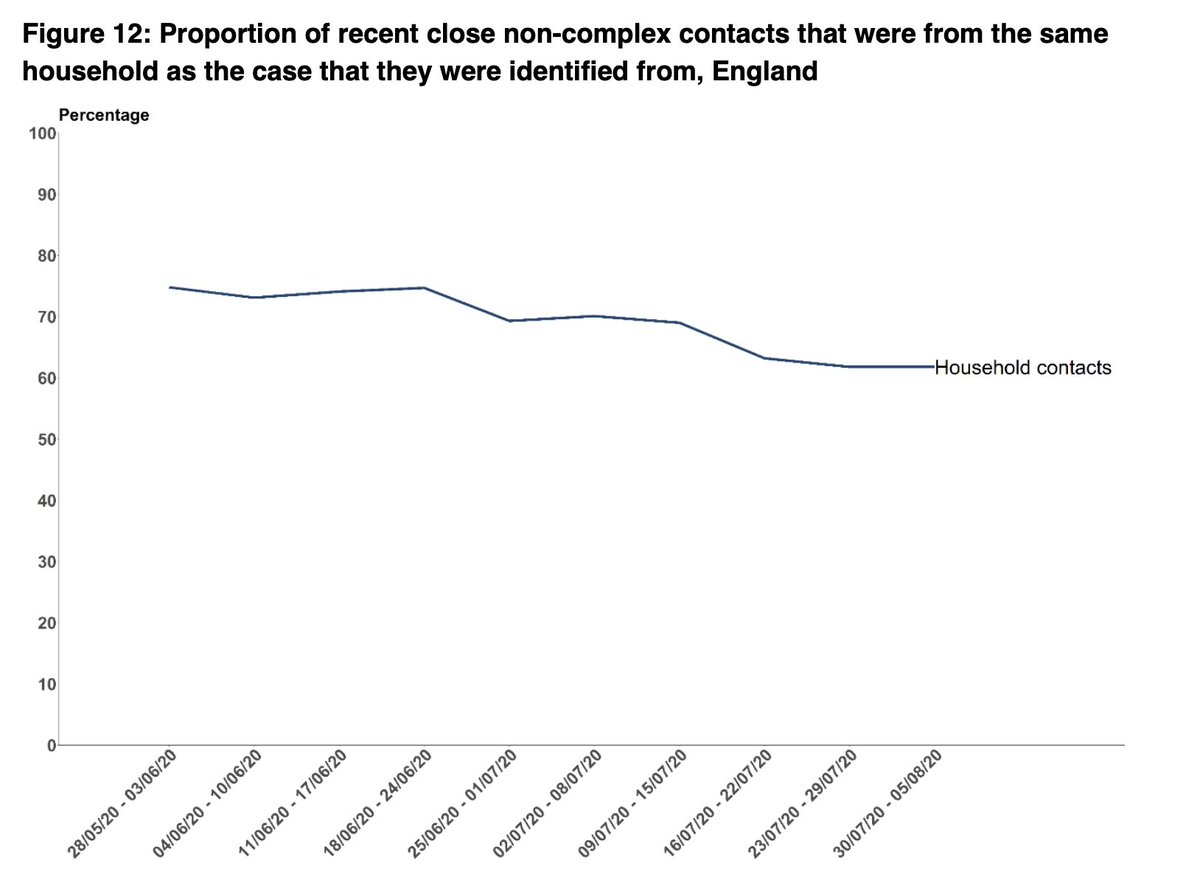
-Again, 62% of non-complex contacts are household. And fewer HH contacts are reached than non-HH (57% vs 67% if non HH contact).
Gov says cause cases will tell their household, & if this is the case then again I think these figures should be included in data on contacts reached
Gov says cause cases will tell their household, & if this is the case then again I think these figures should be included in data on contacts reached
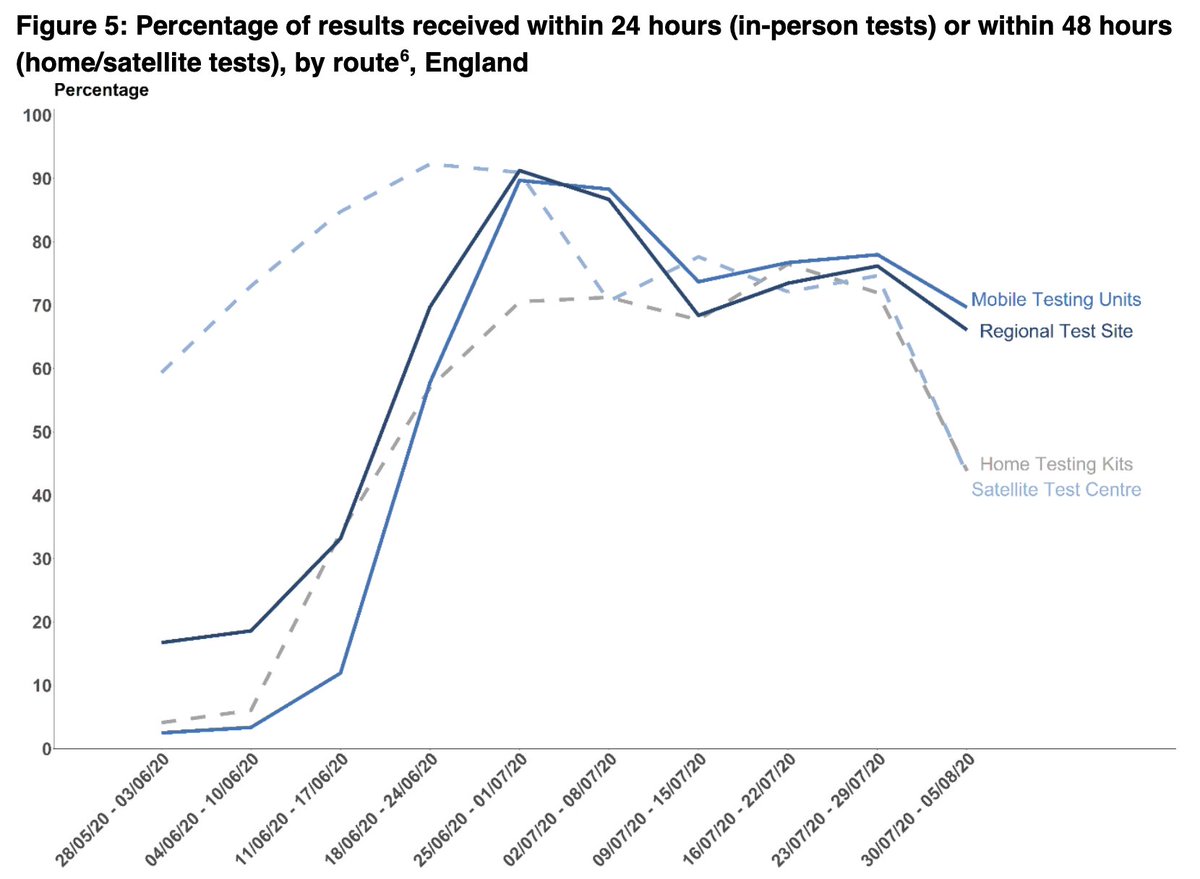
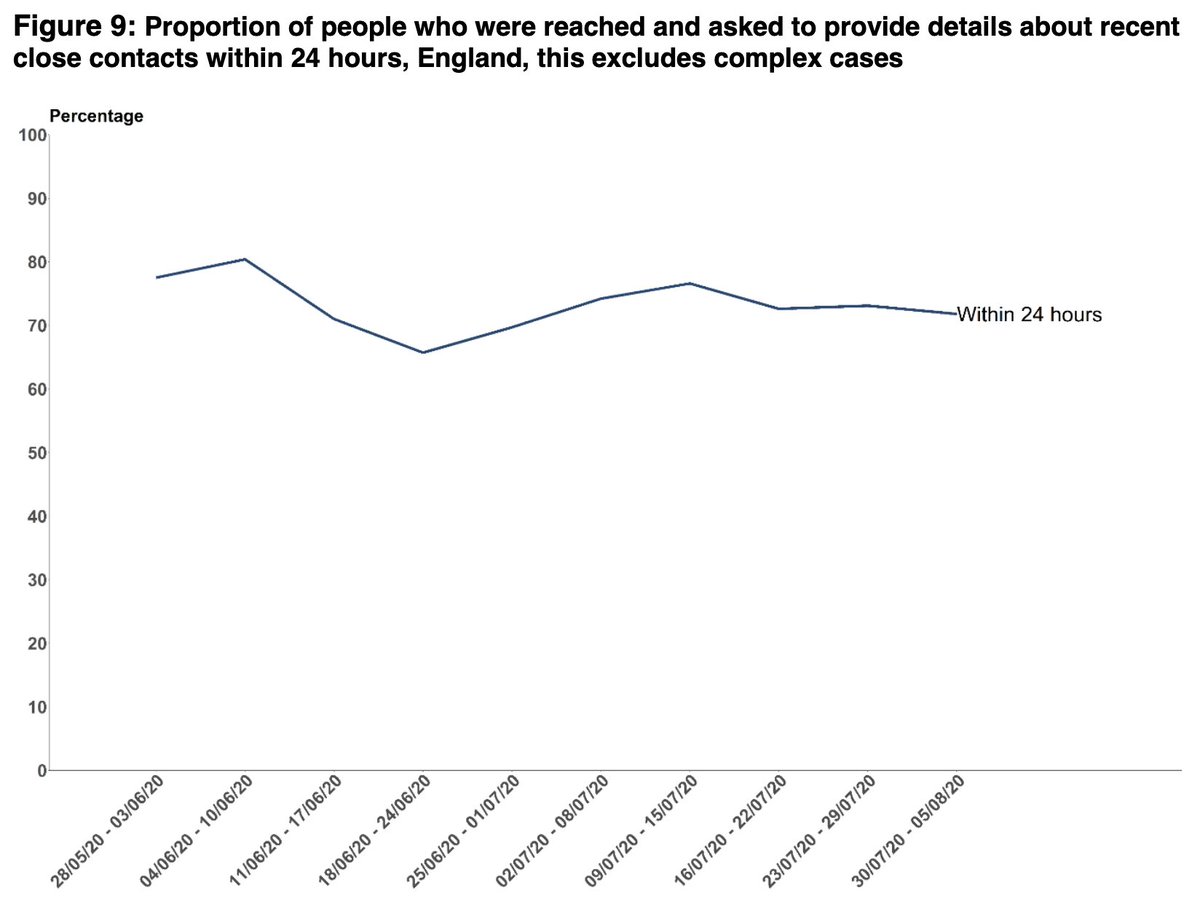
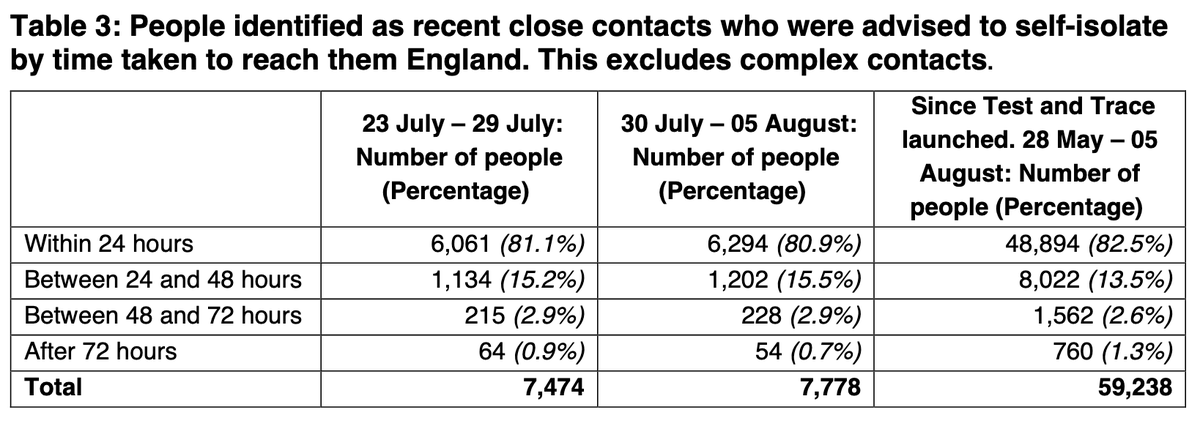
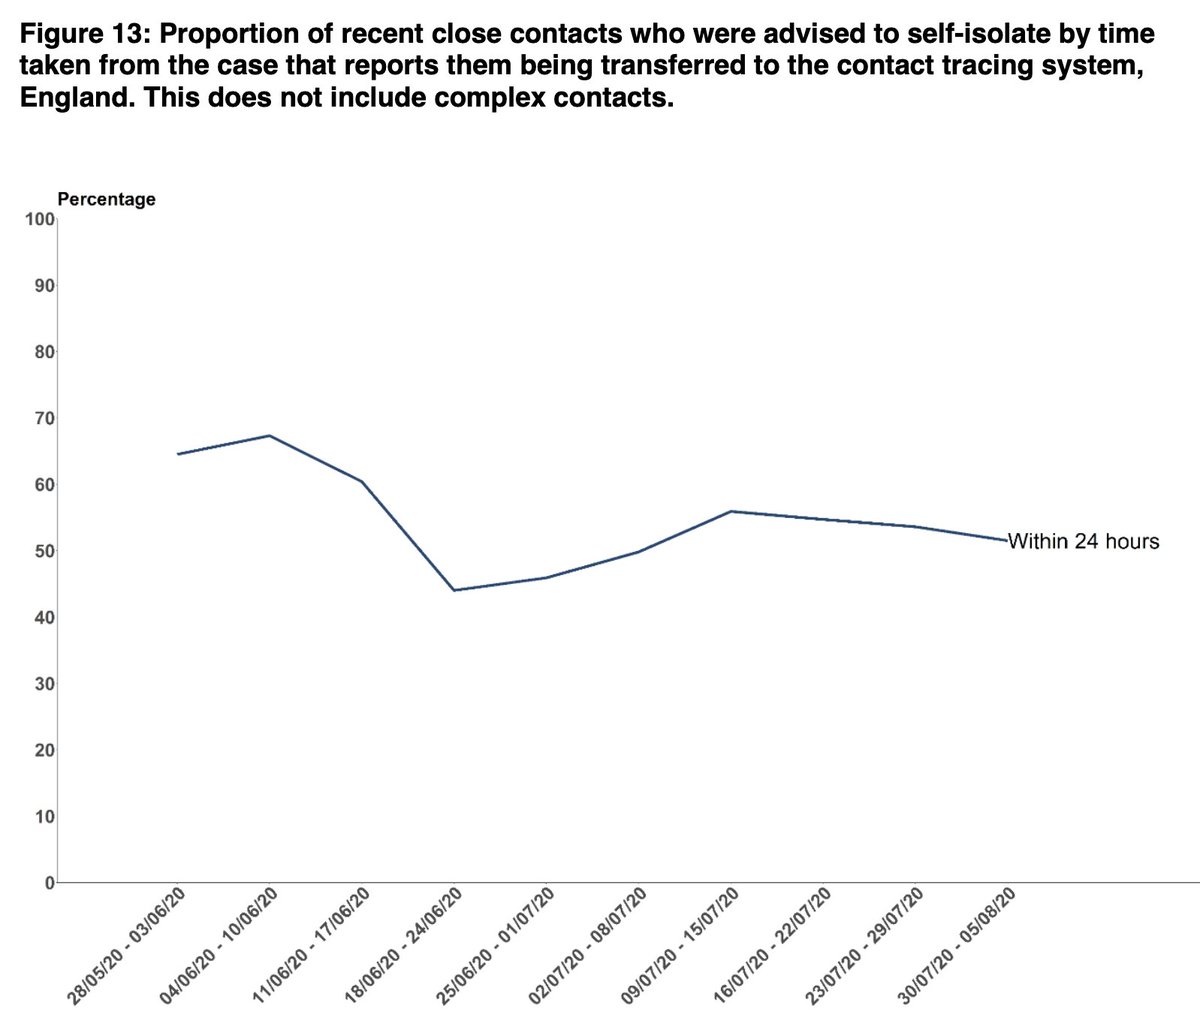
-Test time from request to result has really dropped off this week, for T&T to reach case also lengthened, and time then to reach contacts all roughly same as last week. Not a good picture.
Overall.
Smaller jump in cases than last week, and lower percentage positive testing rates. Plus still no rise in hospitalisations and deaths.
This all potentially points to good news (or at least, not worse news) for COVID infection rates in England.
Smaller jump in cases than last week, and lower percentage positive testing rates. Plus still no rise in hospitalisations and deaths.
This all potentially points to good news (or at least, not worse news) for COVID infection rates in England.
For T&T there are still clearly problems with time taken for testing/results/contact tracing, and percentage contacts reached can still improve (but is getting better).
Two pieces of news this week that are relevant. First is that the COVID App is being piloted again and will help a bit (need to be careful around inequalities on this), BUT… https://www.gov.uk/government/news/test-and-trace-service-reaches-more-than-250-000-people-since-launch">https://www.gov.uk/governmen...
...bigger news in past week is shift to greater local gov involvement in identifying and managing community cases and contacts. This is late but v welcome. /End. https://www.gov.uk/government/news/nhs-test-and-trace-service-to-strengthen-regional-contact-tracing">https://www.gov.uk/governmen...

 Read on Twitter
 https://www.gov.uk/governmen..." title="Week 10 NHS Test and Trace data summary. 30/7/20 to 05/08/20.Increase in cases for four consecutive weeks. And there’s some really interesting bits in the data (including some potential good news). Summary in picture, detail in thread https://abs.twimg.com/emoji/v2/... draggable="false" alt="👇" title="Rückhand Zeigefinger nach unten" aria-label="Emoji: Rückhand Zeigefinger nach unten"> https://www.gov.uk/governmen..." class="img-responsive" style="max-width:100%;"/>
