Market Leader Chart Megathread. Are the wounds healing?
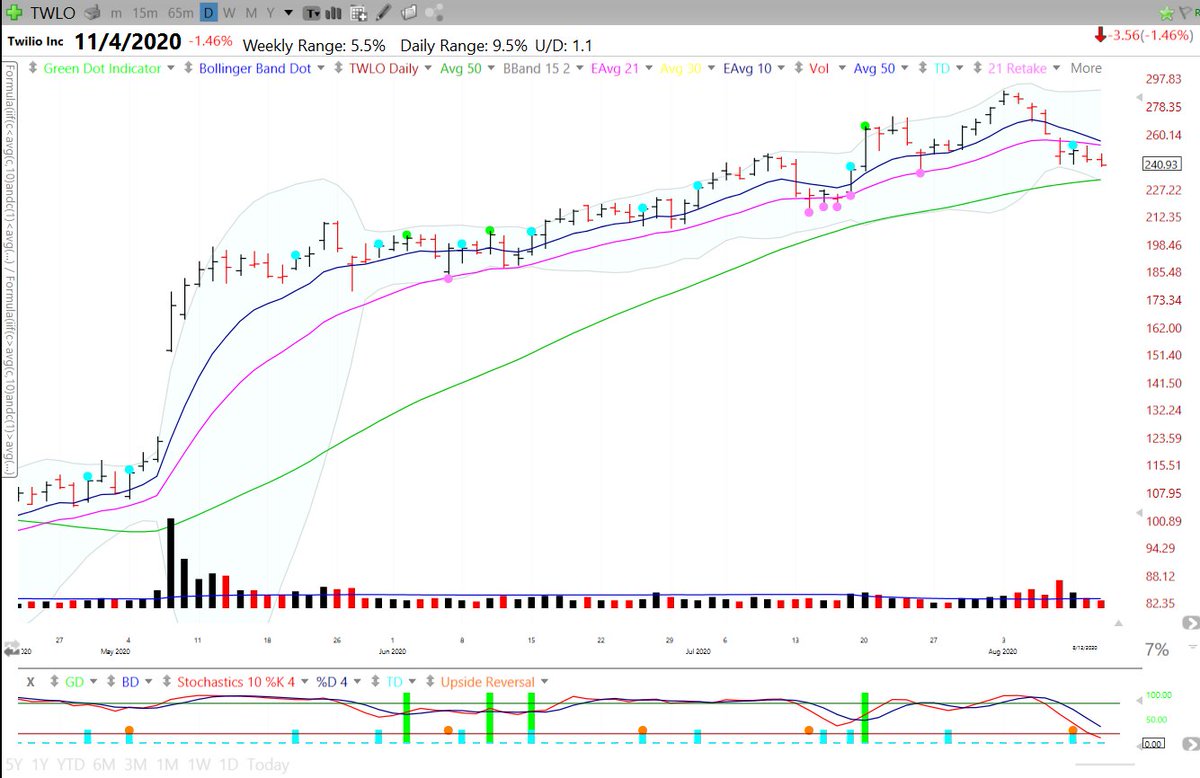
$TSLA $NVDA $DDOG $DXCM $VEEV $TWLO $AMD $COUP $OKTA $CRWD $SE $ZS $TDOC $SHOP $TTD $DOCU $LVGO $FSLY $ZM $IPHI $QDEL $CHGG
What are other leaders worth watching https://abs.twimg.com/emoji/v2/... draggable="false" alt="🧐" title="Gesicht mit Monokel" aria-label="Emoji: Gesicht mit Monokel">
$TSLA $NVDA $DDOG $DXCM $VEEV $TWLO $AMD $COUP $OKTA $CRWD $SE $ZS $TDOC $SHOP $TTD $DOCU $LVGO $FSLY $ZM $IPHI $QDEL $CHGG
What are other leaders worth watching
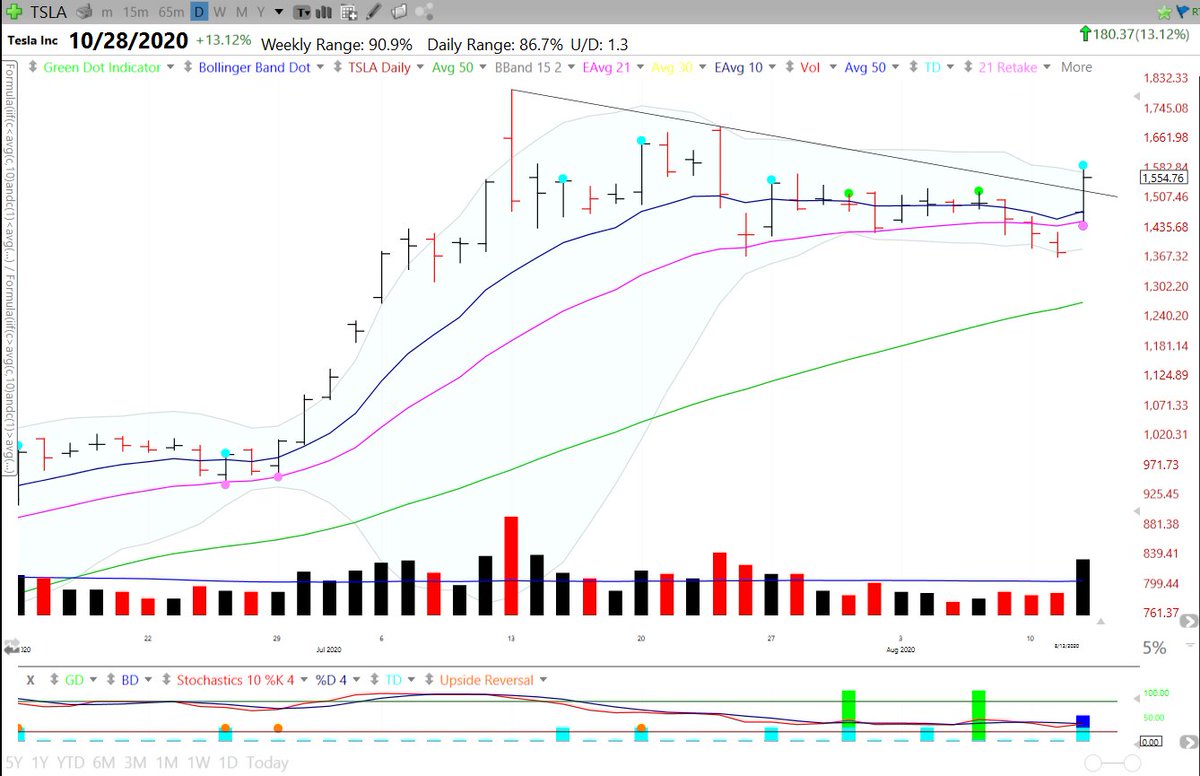
$TSLA
Lost the 21 ema a few days ago on below average volume but retook that today on volume and broke the downward trendline. Would love to see it move higher tomorrow
Lost the 21 ema a few days ago on below average volume but retook that today on volume and broke the downward trendline. Would love to see it move higher tomorrow
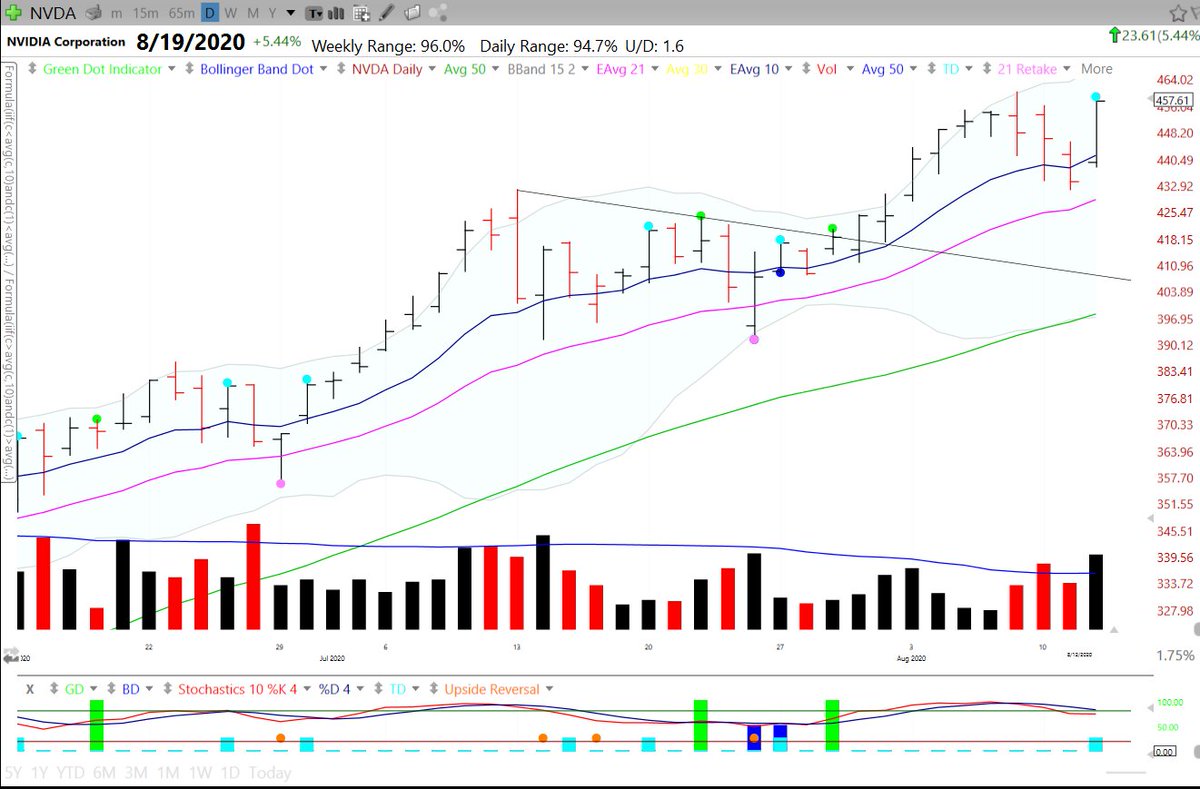
$NVDA
Help up well compared to other growth stocks during this "growth crash" Teal dot today on volume. Looks strong!
Help up well compared to other growth stocks during this "growth crash" Teal dot today on volume. Looks strong!
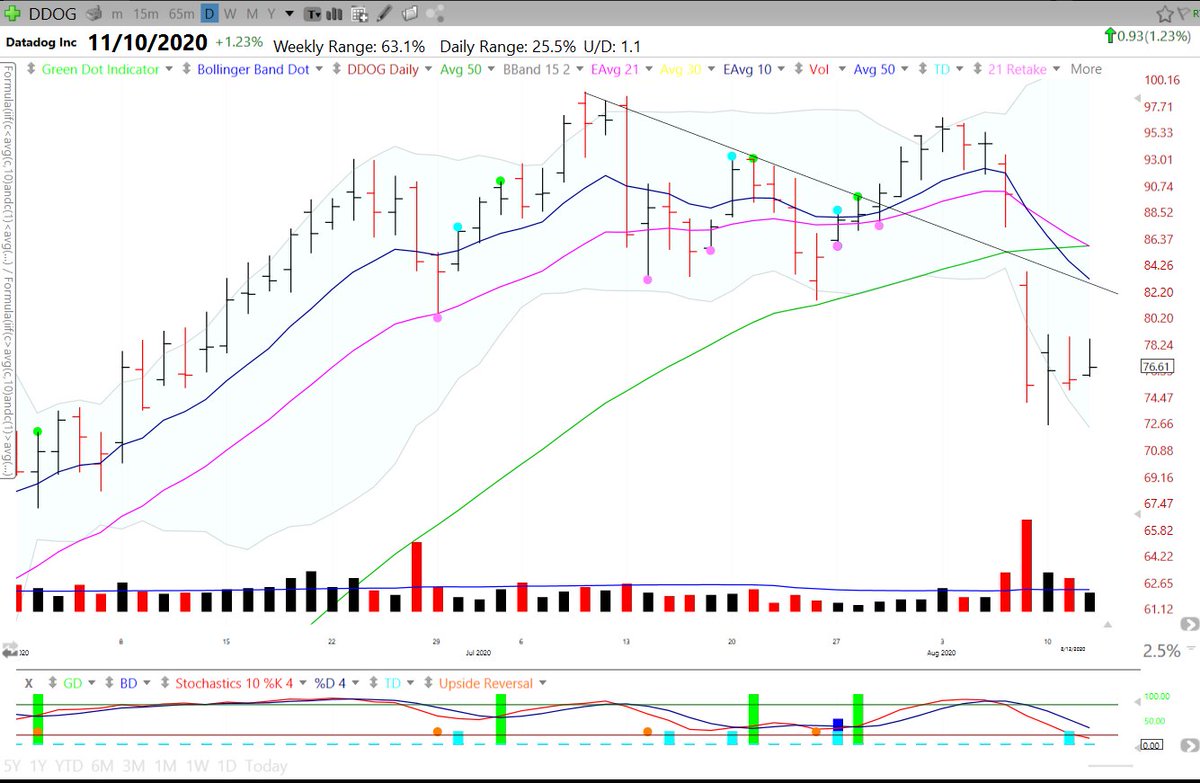
$DDOG
Gapped down and broke the 50 day on volume a few days ago. Red flags for me. Since then price action has been constructive. Not touching this one for a while.
Gapped down and broke the 50 day on volume a few days ago. Red flags for me. Since then price action has been constructive. Not touching this one for a while.
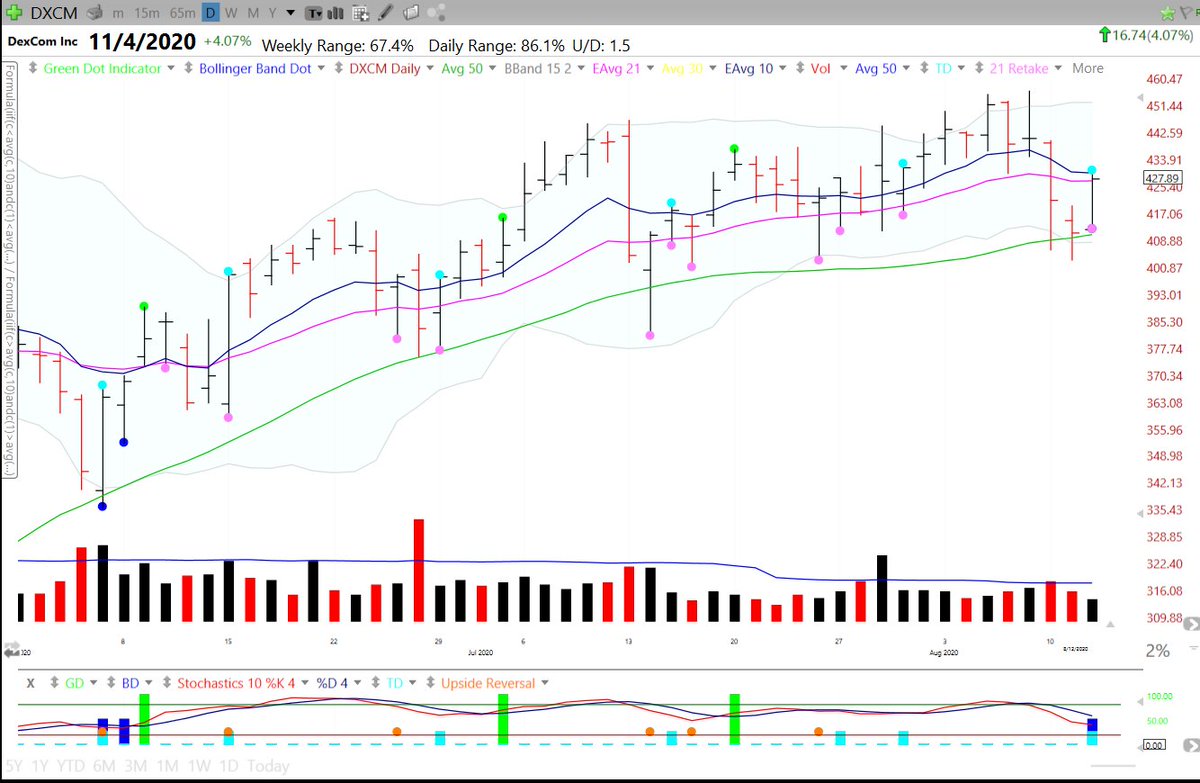
$DXCM
This one hasn& #39;t been acting the same since it first touched the 50 day. Messy price action. Great fundamental numbers though.
This one hasn& #39;t been acting the same since it first touched the 50 day. Messy price action. Great fundamental numbers though.
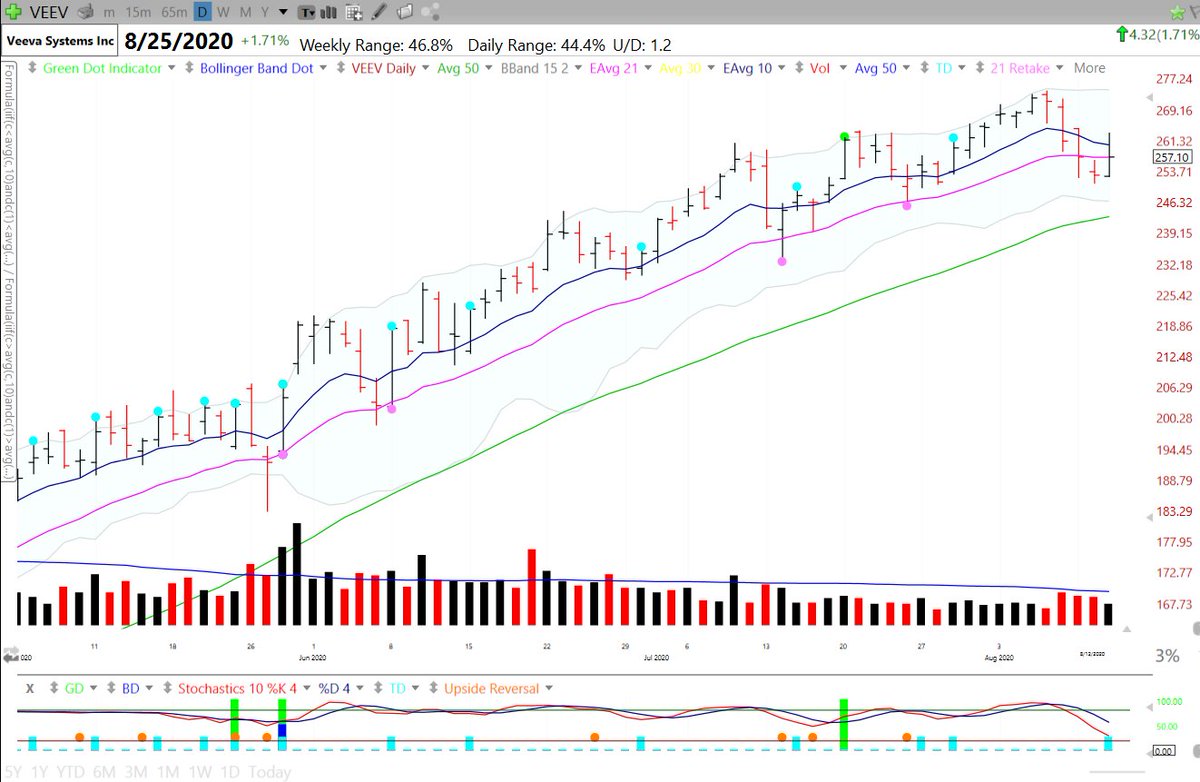
$VEEV
Was trending beautifully until recently holding the 21 ema. The recent pullback is on below average volume
Was trending beautifully until recently holding the 21 ema. The recent pullback is on below average volume
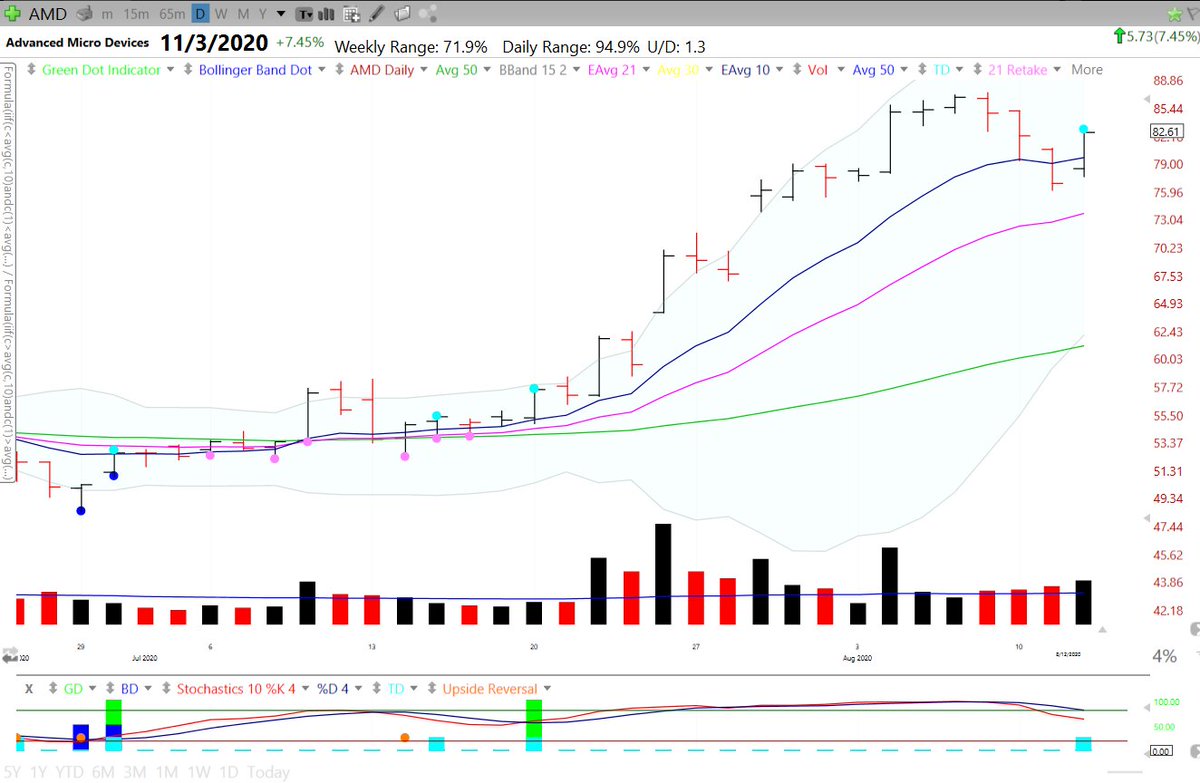
$AMD
wore everyone out (including me) before exploding higher. The pullback has allowed the moving averages to catch up and it showed a teal dot today.
wore everyone out (including me) before exploding higher. The pullback has allowed the moving averages to catch up and it showed a teal dot today.
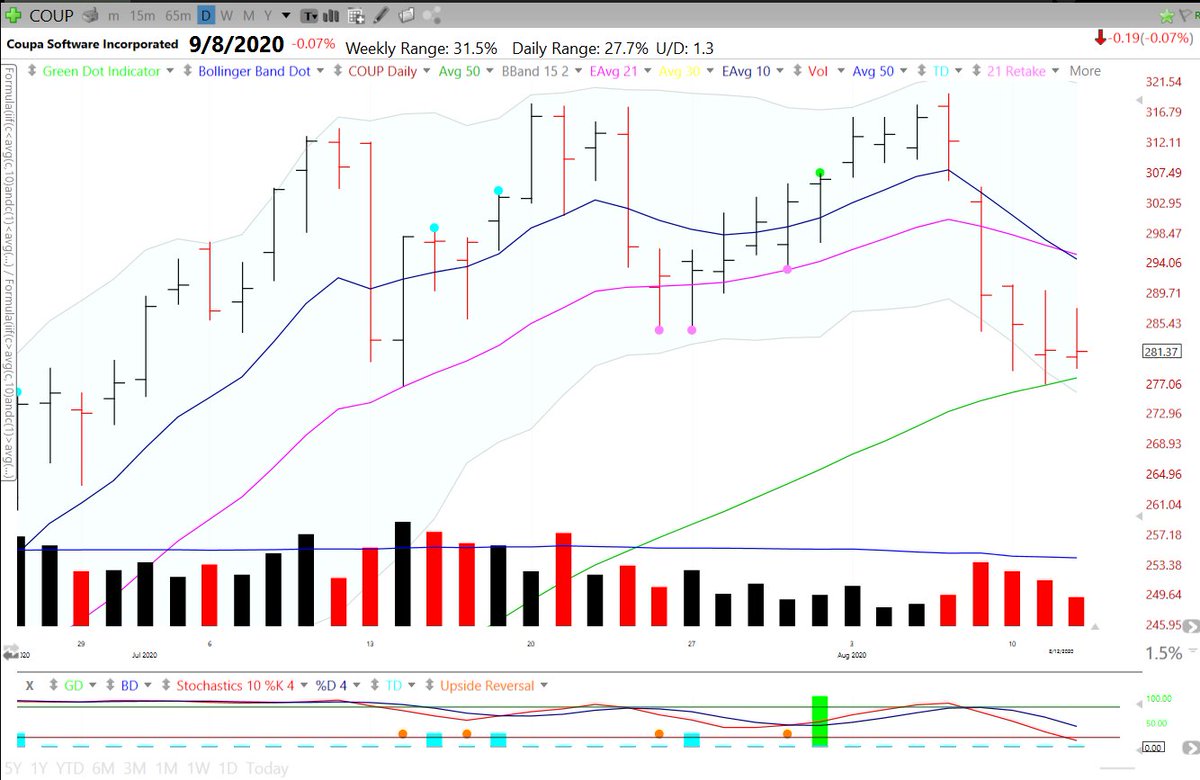
$COUP
The pullback was on below average volume and so far it& #39;s holding that 50 sma and does not seem to want to fall below ~275. Inside day today
The pullback was on below average volume and so far it& #39;s holding that 50 sma and does not seem to want to fall below ~275. Inside day today
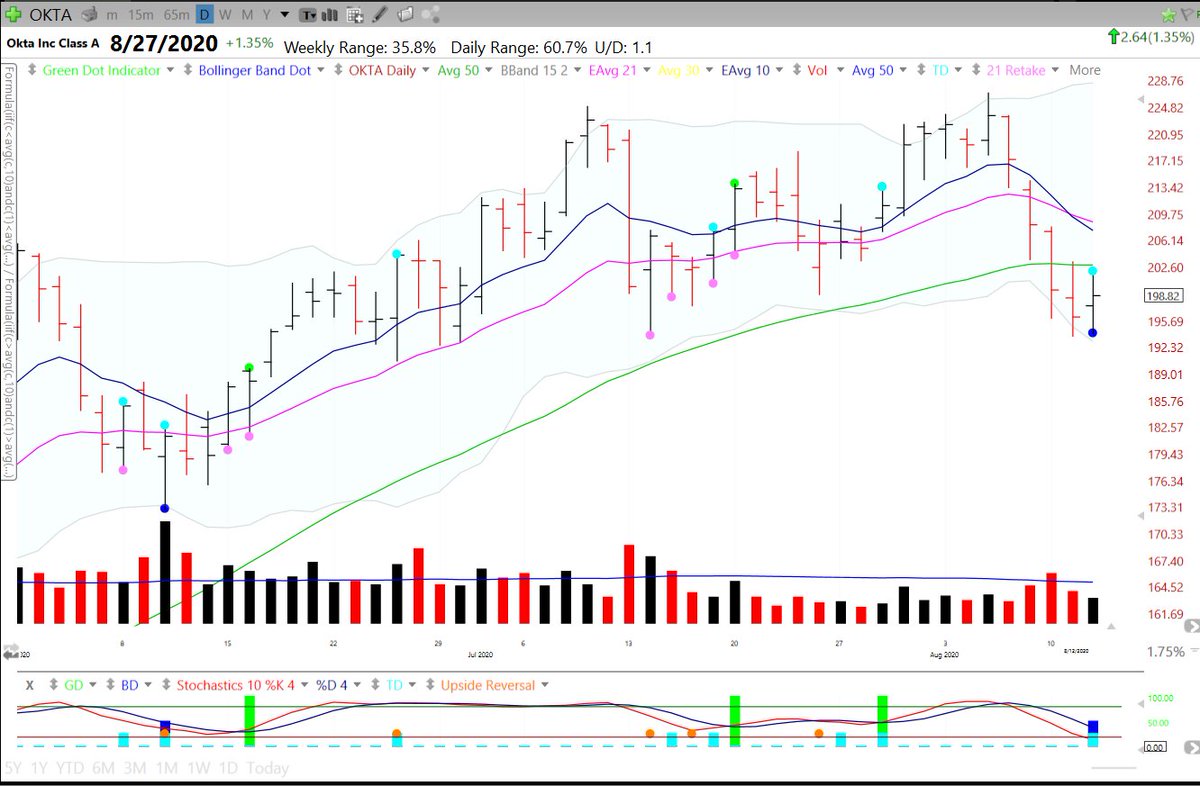
$OKTA
Undercut the 50 day but not on huge volume. Lower bollinger band bounce+ teal dot today. it would need to retake the 50 day for me to get interested
Undercut the 50 day but not on huge volume. Lower bollinger band bounce+ teal dot today. it would need to retake the 50 day for me to get interested
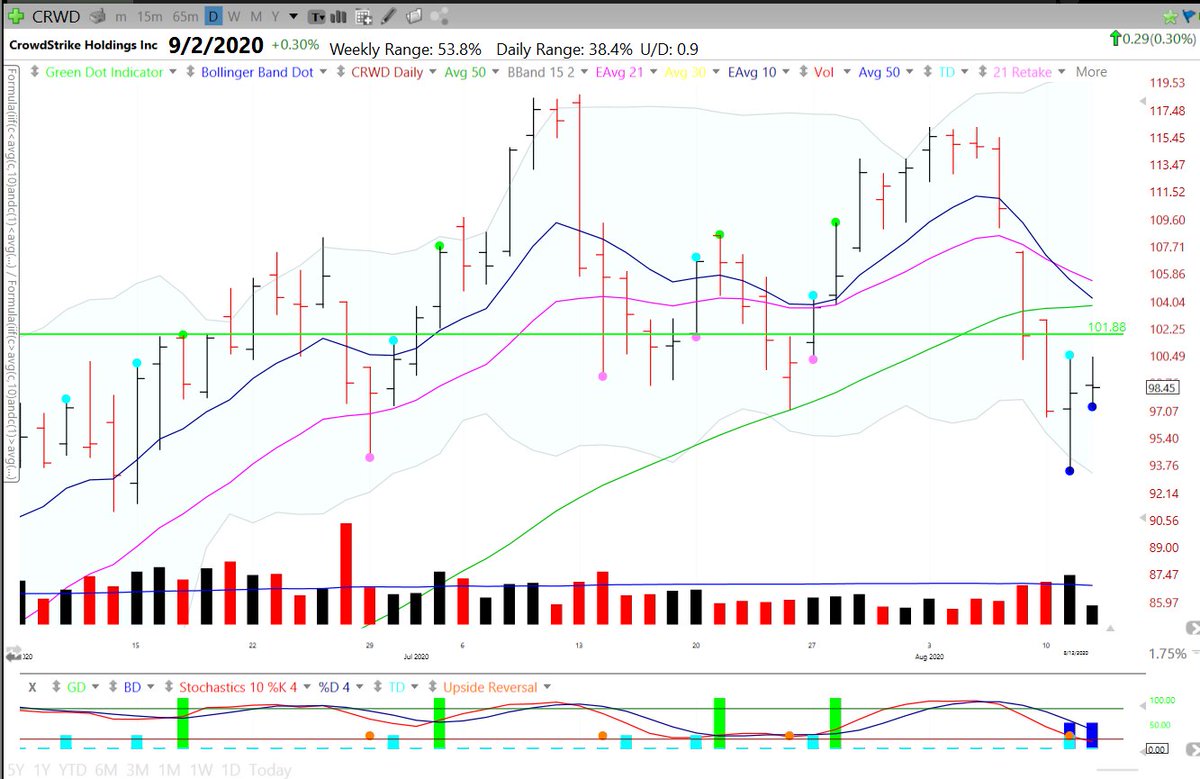
$CRWD
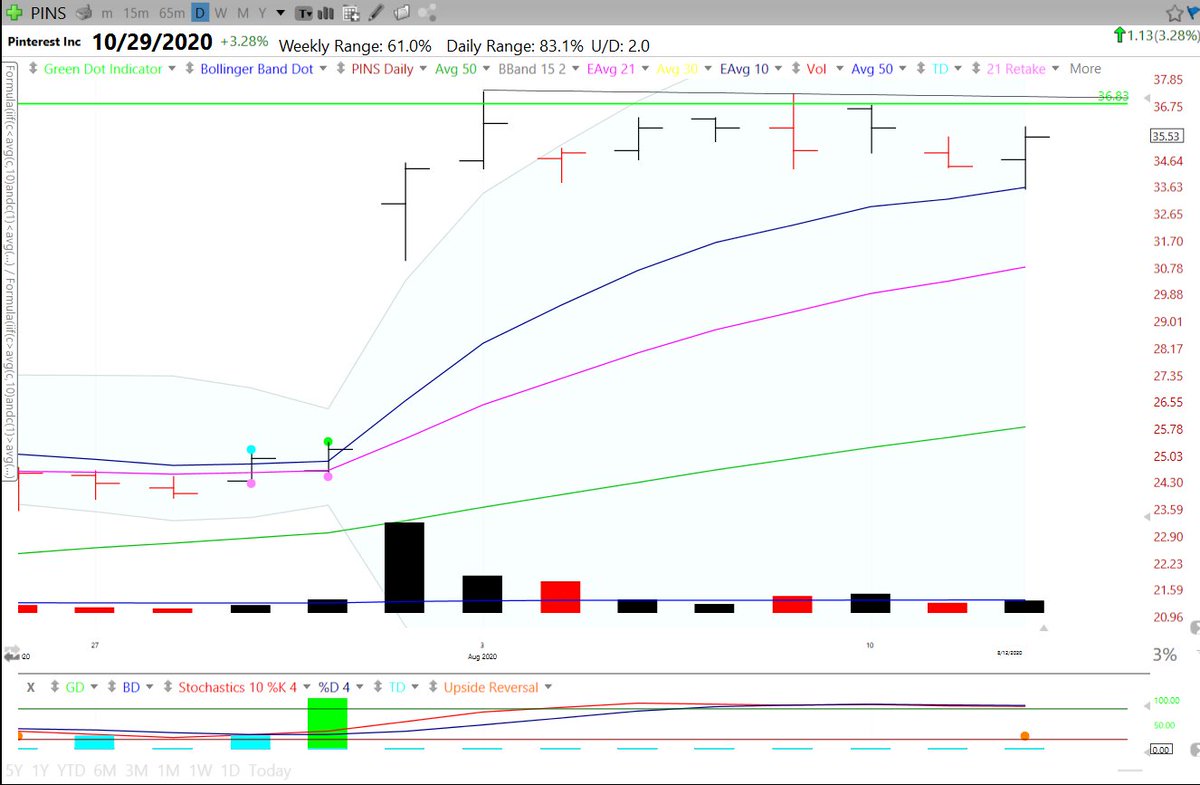
Has had trouble staying above the IPO green line and https://abs.twimg.com/emoji/v2/... draggable="false" alt="💯" title="Hundert Punkte Symbol" aria-label="Emoji: Hundert Punkte Symbol"> level. It& #39;s also still below the 50 day
Has had trouble staying above the IPO green line and
$SE
Another high tight flag setup that has not panned out yet. Pullback was on slightly higher than normal volume. Still holding the 21 ema. Looks good but earnings are creeping up.
Another high tight flag setup that has not panned out yet. Pullback was on slightly higher than normal volume. Still holding the 21 ema. Looks good but earnings are creeping up.
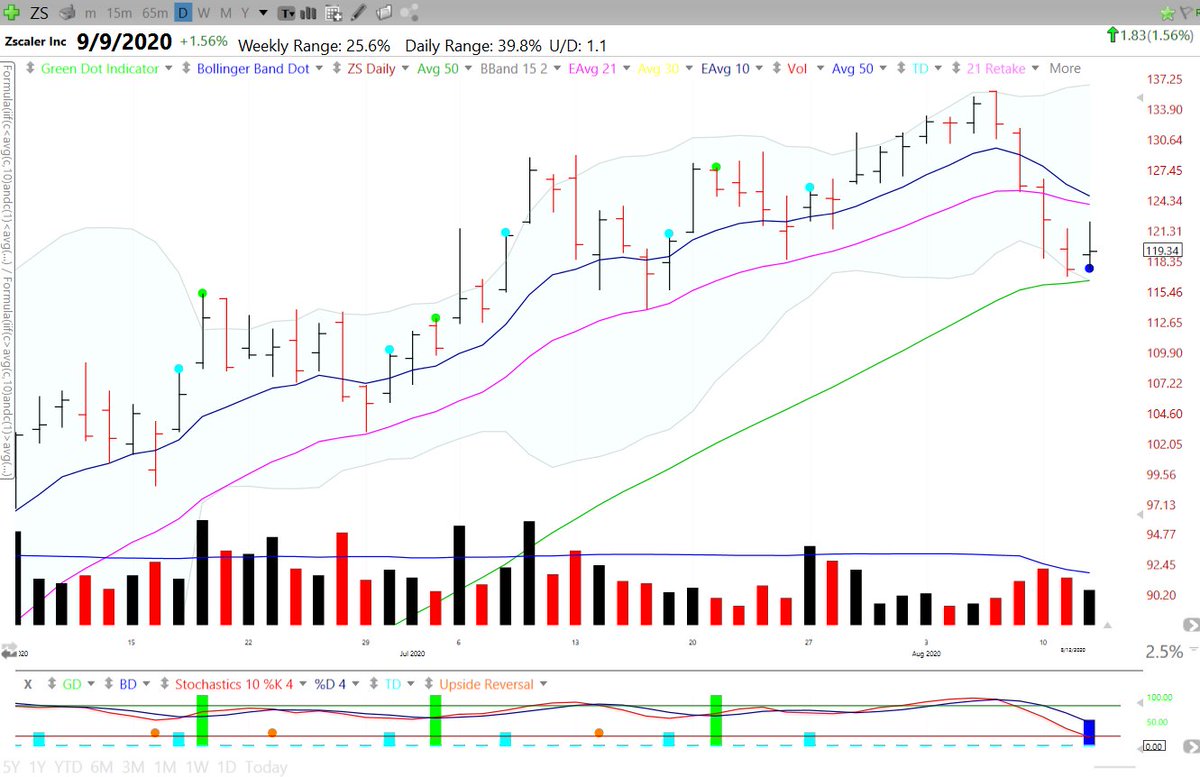
$ZS
Pullback was on low volume. No real oomph in the 50 day moving average bounce today. Maybe an undercut and upside reversal would get this moving higher.
Pullback was on low volume. No real oomph in the 50 day moving average bounce today. Maybe an undercut and upside reversal would get this moving higher.
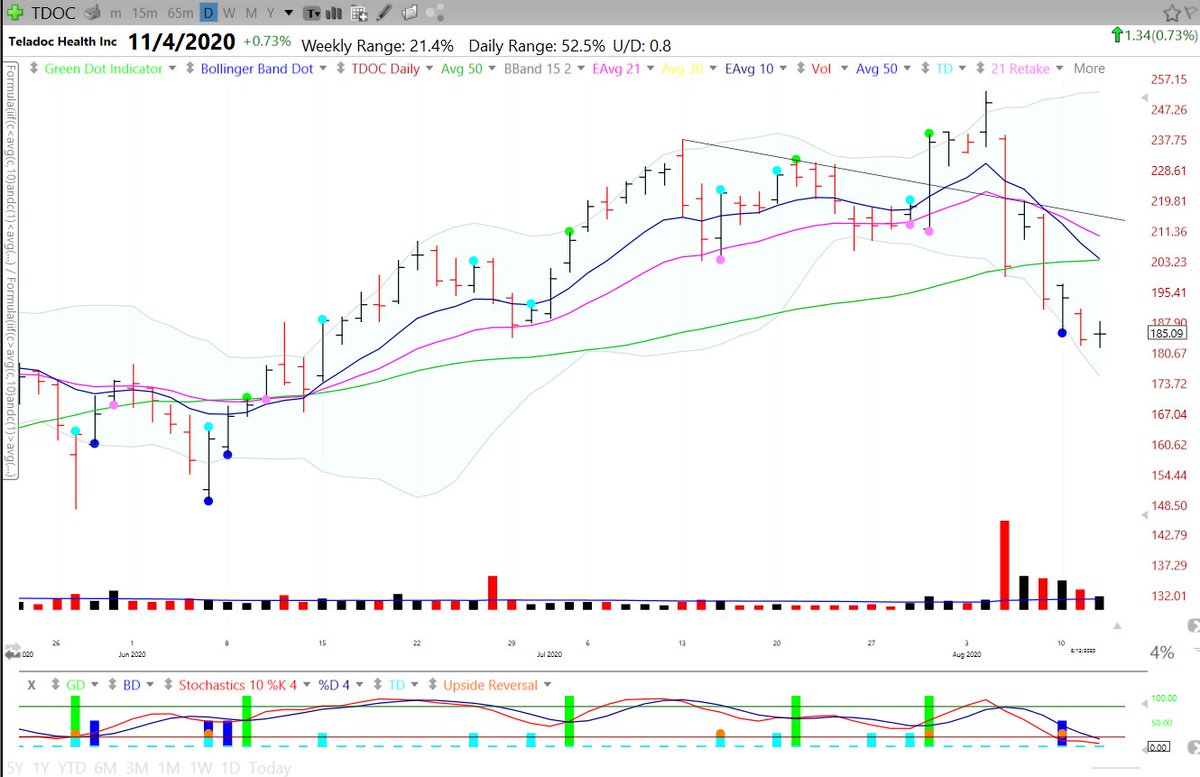
$TDOC
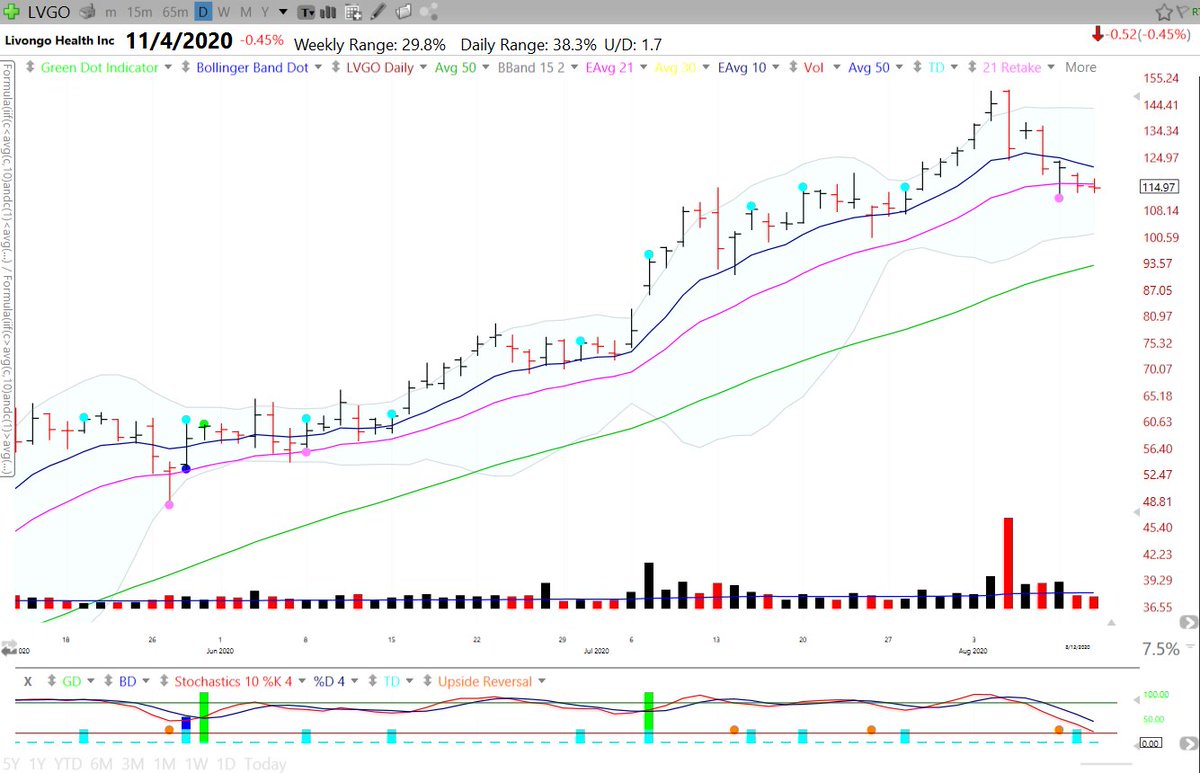
Has not acted well since the merger news with $LVGO
You have to respect big drops on volume and undercuts of the 50 sma. One to watch as it builds a base
Has not acted well since the merger news with $LVGO
You have to respect big drops on volume and undercuts of the 50 sma. One to watch as it builds a base
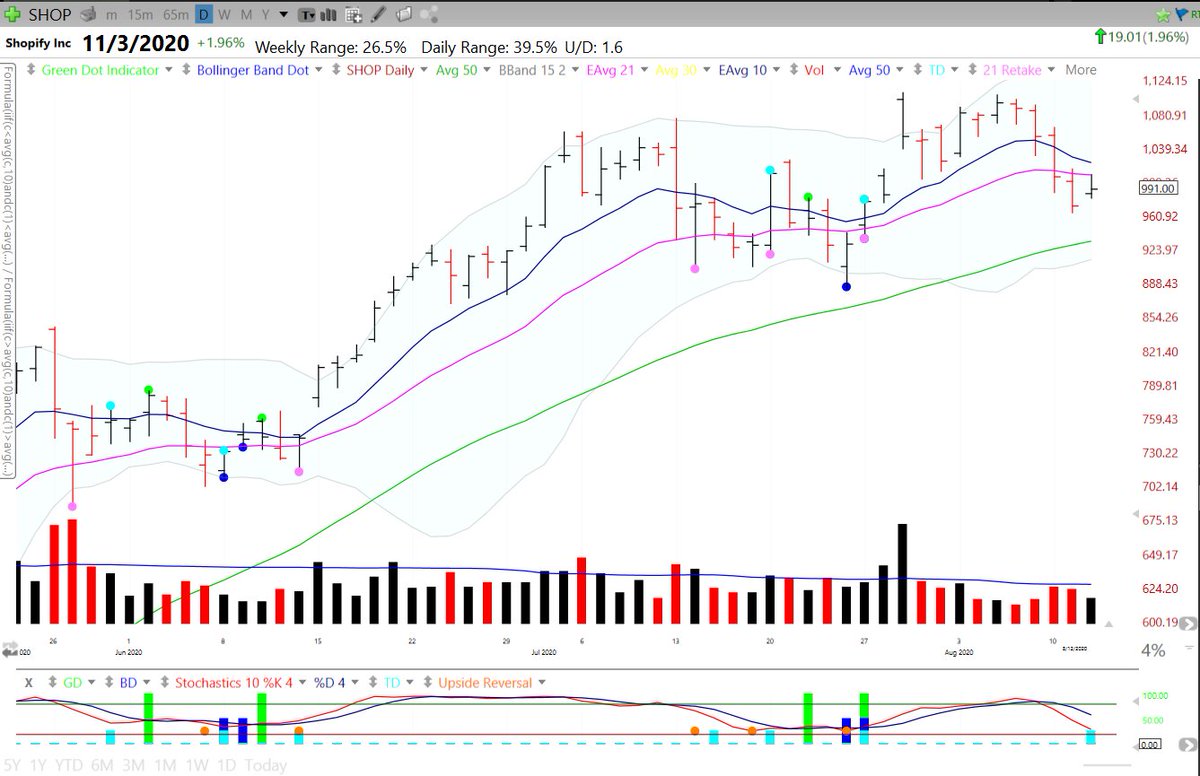
$SHOP
Pullback was on lower volume and has mostly gone sideways since a killer earnings report. Acting normal to me and deserves a rest as it has tripled since march. Lost the 1000 level
Pullback was on lower volume and has mostly gone sideways since a killer earnings report. Acting normal to me and deserves a rest as it has tripled since march. Lost the 1000 level
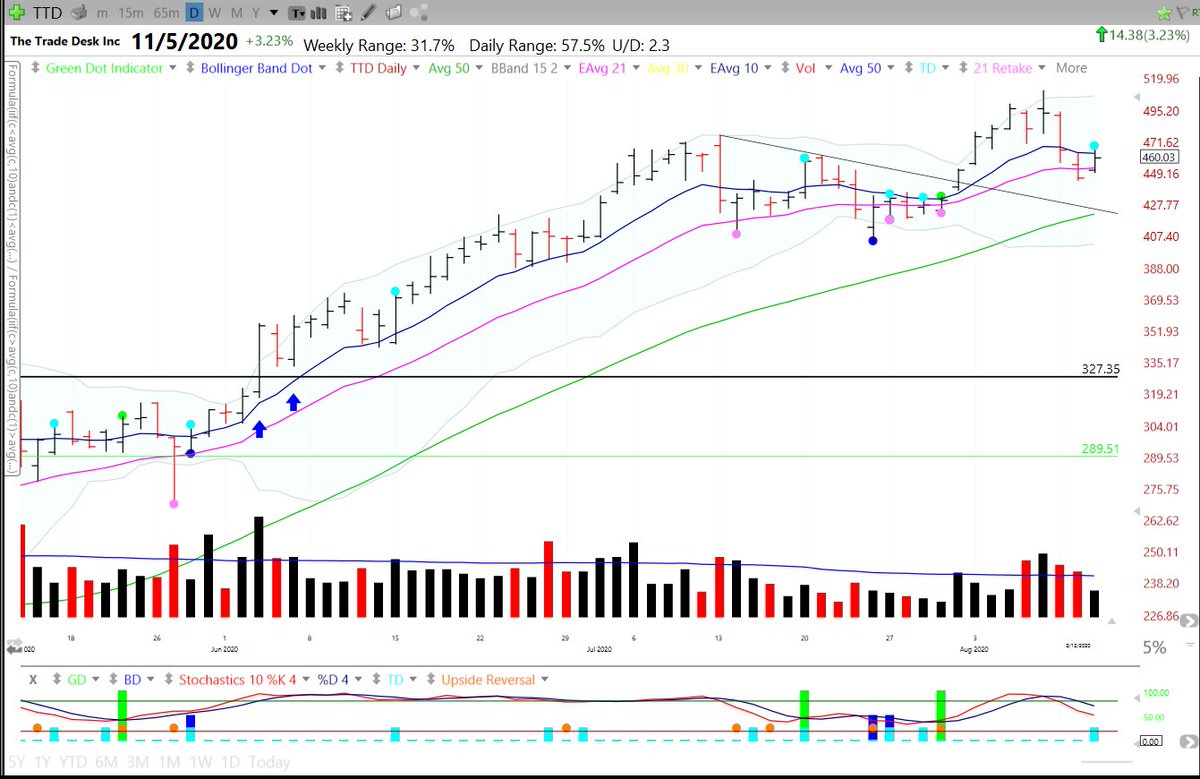
$TTD
Great example of a clean and simple breakout back in june. Holding up well. Retook it& #39;s 21 ema and showed a teal dot today. Could not hold the 500 level
Great example of a clean and simple breakout back in june. Holding up well. Retook it& #39;s 21 ema and showed a teal dot today. Could not hold the 500 level
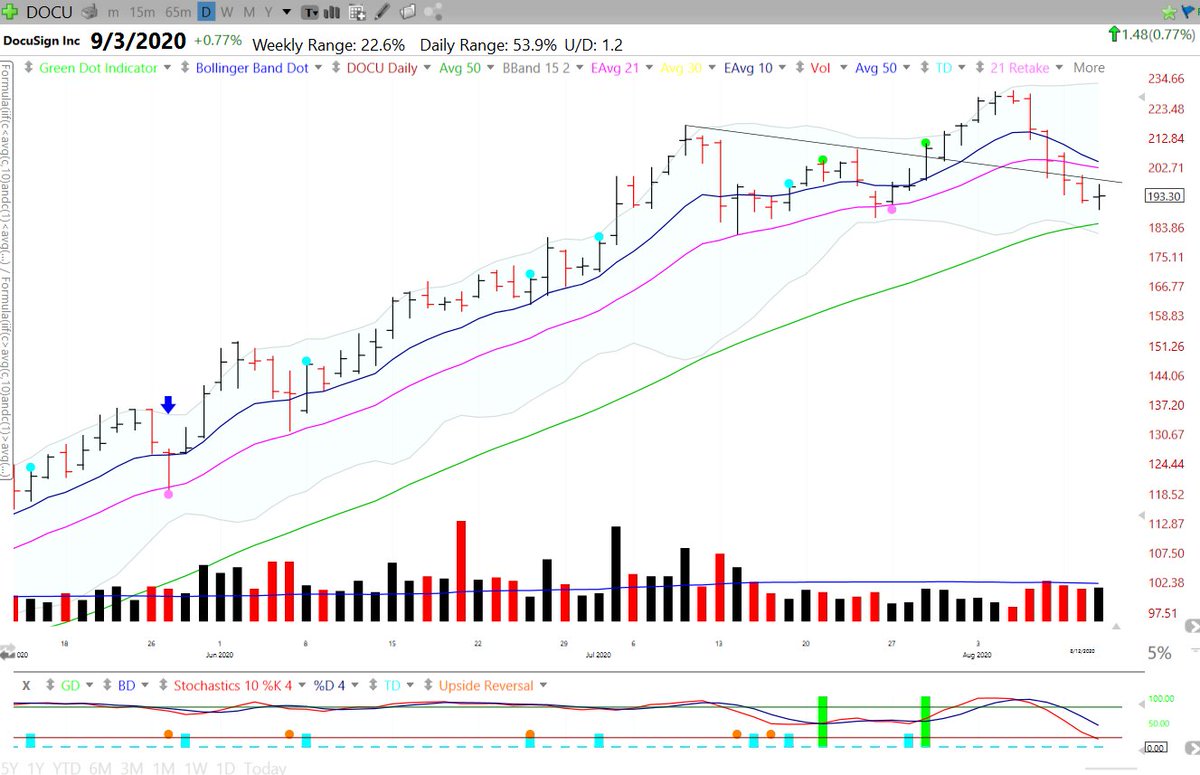
$DOCU
One of the many "ones that got away" of 2020. Now it& #39;s consolidating a killer move. Disruptive technology even before covid. Looks like an orderly pullback to the 50 day is in order.
One of the many "ones that got away" of 2020. Now it& #39;s consolidating a killer move. Disruptive technology even before covid. Looks like an orderly pullback to the 50 day is in order.
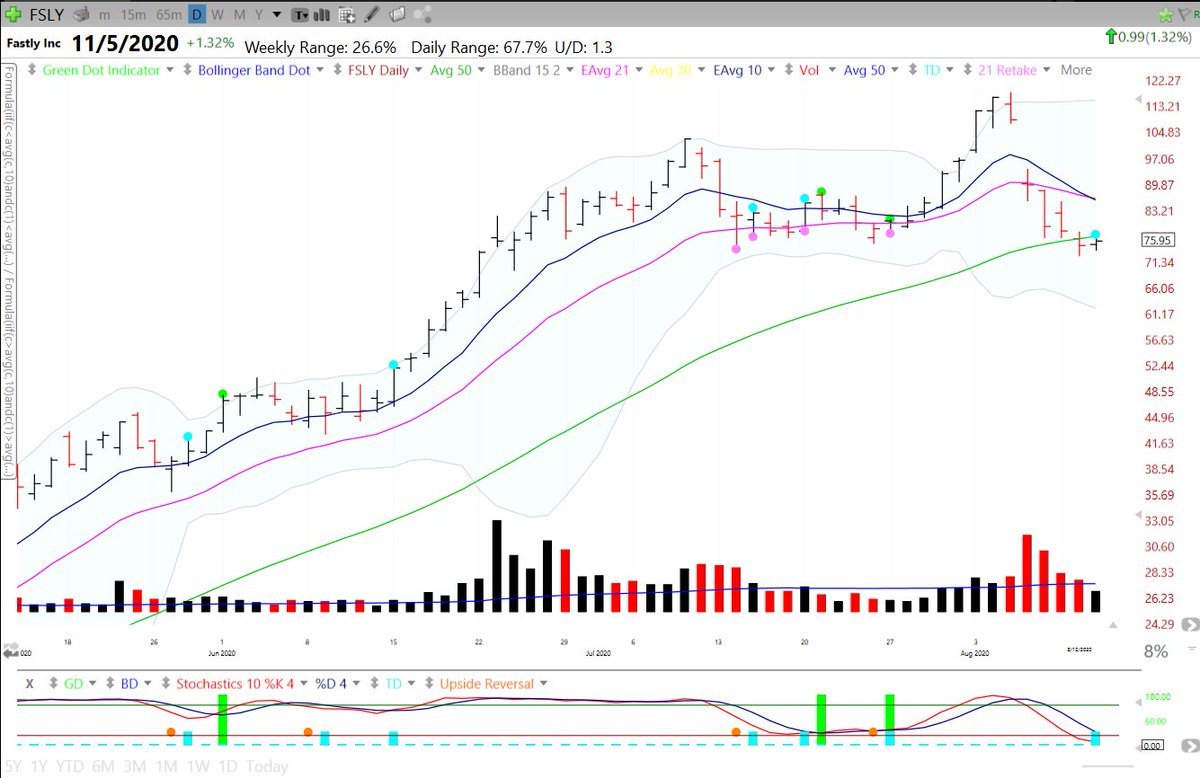
$FSLY
Big drop after decent earnings report. I felt that in my own account. Pullback is on high volume and the bounce so far has no "oomph" Needs time. You have to respect gaps down on volume. Red Flag. It is holding around 75 so far
Big drop after decent earnings report. I felt that in my own account. Pullback is on high volume and the bounce so far has no "oomph" Needs time. You have to respect gaps down on volume. Red Flag. It is holding around 75 so far
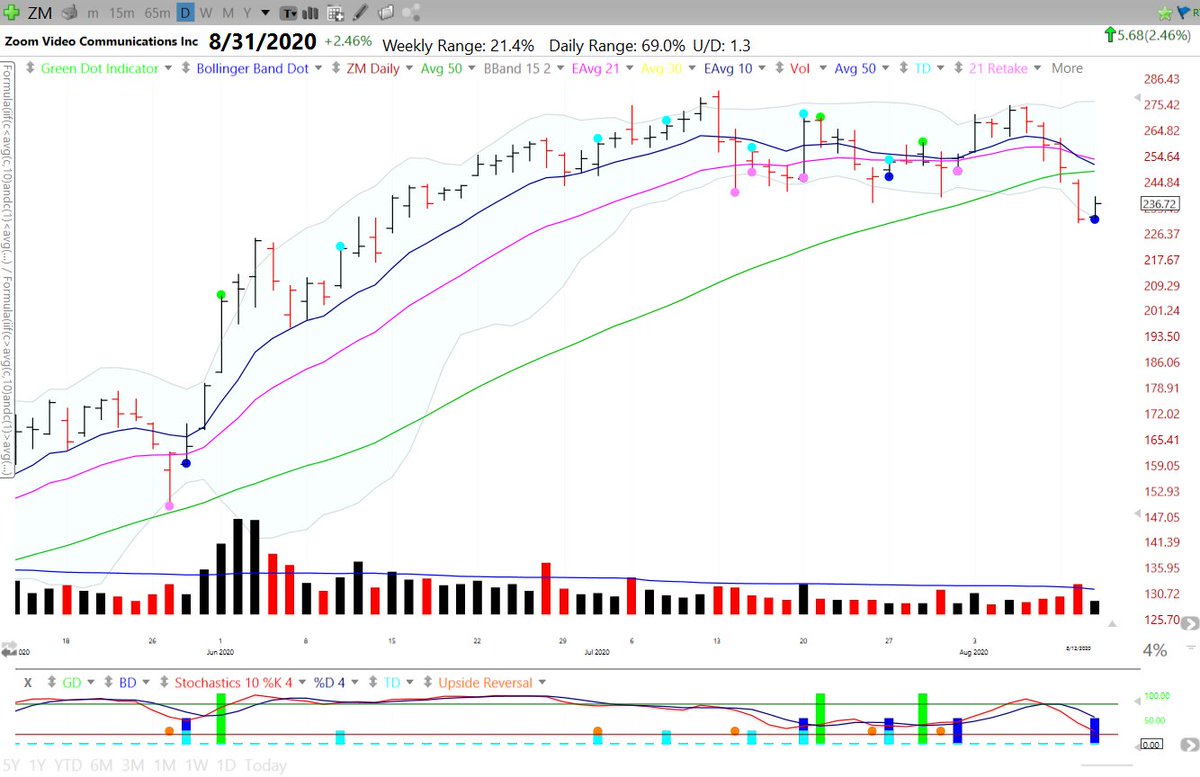
$ZM
The original covid stock. The pullback was on low volume until yesterday. Consolidating a monster run. Currently under the 50 day but it did have a lower bollinger band bounce on low volume today.
The original covid stock. The pullback was on low volume until yesterday. Consolidating a monster run. Currently under the 50 day but it did have a lower bollinger band bounce on low volume today.
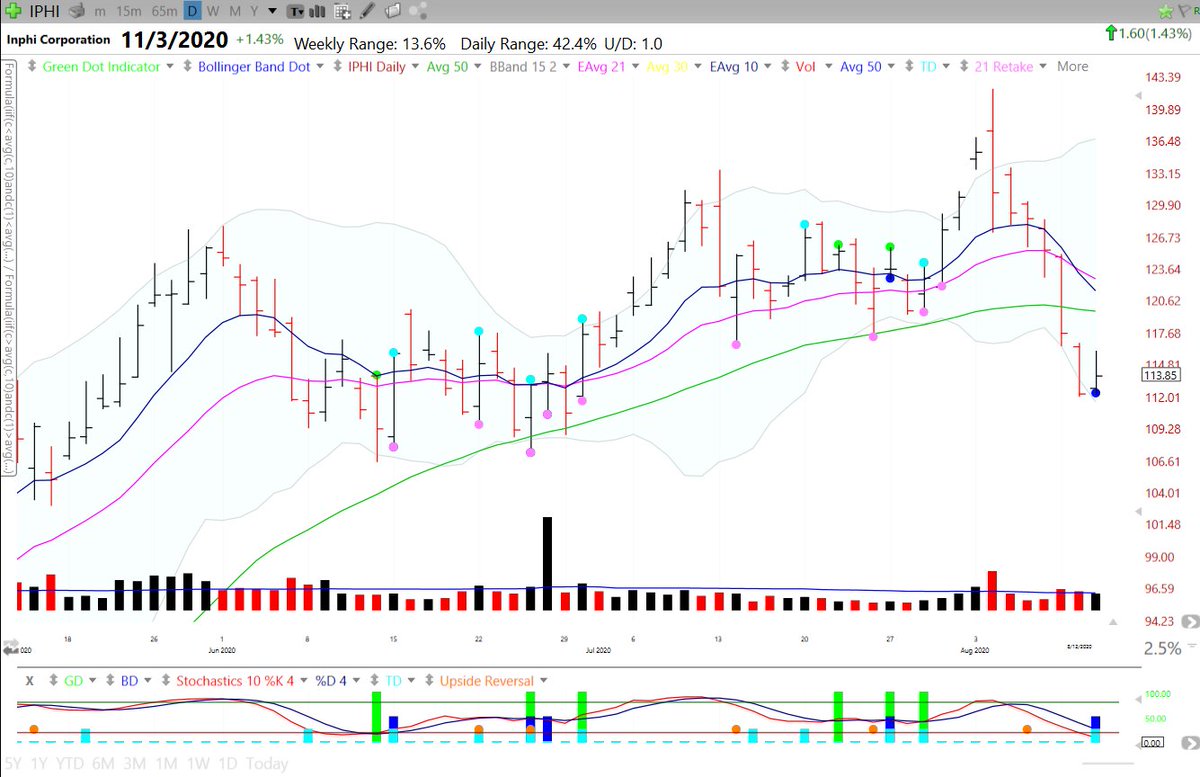
$IPHI
Not pretty price action. $AMD and $NVDA look much stronger in the chips space. Big downside reversal to start this pullback. It& #39;s now below the 50 day but still above ~105
Not pretty price action. $AMD and $NVDA look much stronger in the chips space. Big downside reversal to start this pullback. It& #39;s now below the 50 day but still above ~105
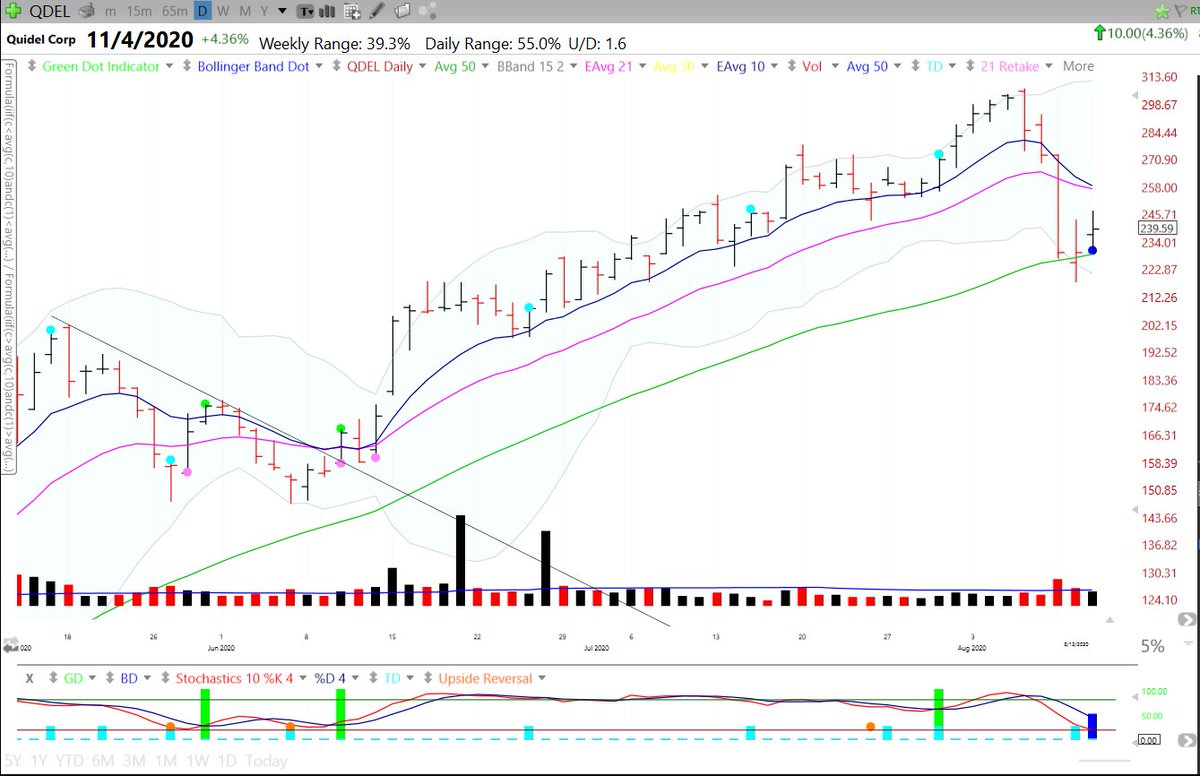
$QDEL
Sneaky high tight flag breakout a few months ago that it doubled from. Ugly action on this pullback but it is finding support around the 50 day sma.
Sneaky high tight flag breakout a few months ago that it doubled from. Ugly action on this pullback but it is finding support around the 50 day sma.
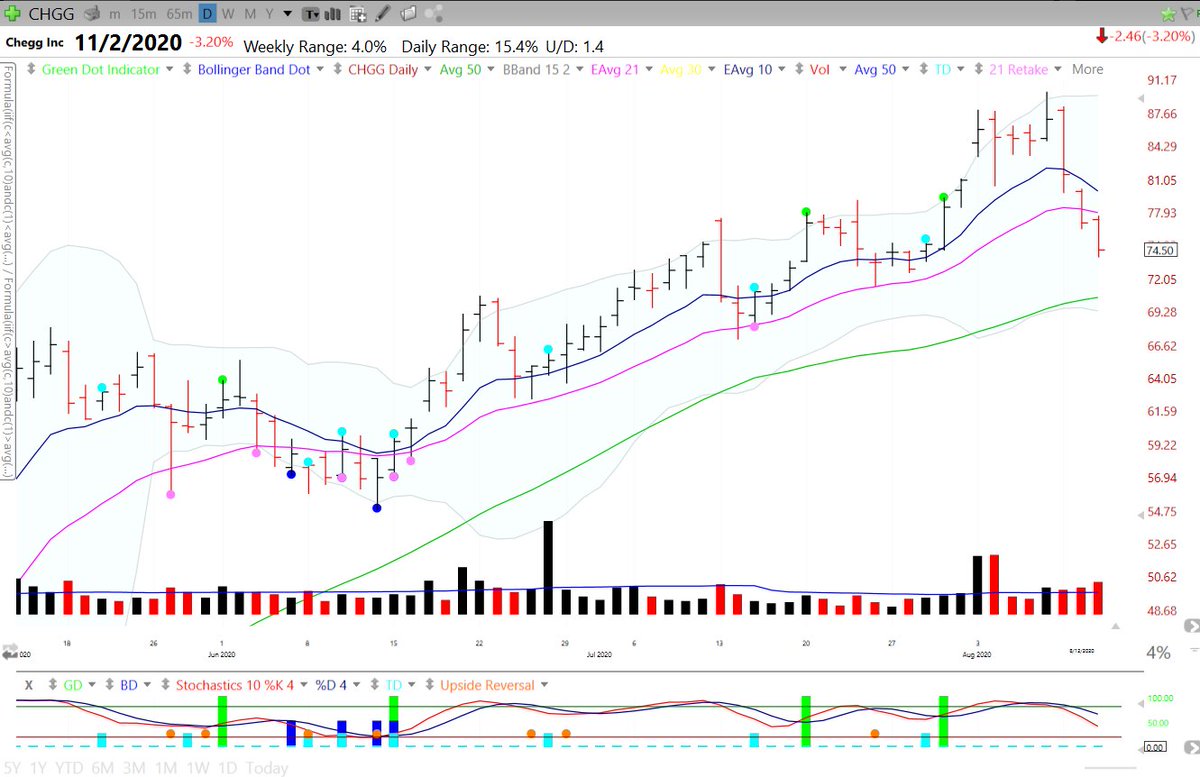
$CHGG
Declining 3 days in a row on higher volume each day and finishing in the lower third of the trading range on each of those days. Looks like a trip to the 50 day is in the cards
Declining 3 days in a row on higher volume each day and finishing in the lower third of the trading range on each of those days. Looks like a trip to the 50 day is in the cards

 Read on Twitter
 level. It& #39;s also still below the 50 day" title=" $CRWDHas had trouble staying above the IPO green line and https://abs.twimg.com/emoji/v2/... draggable="false" alt="💯" title="Hundert Punkte Symbol" aria-label="Emoji: Hundert Punkte Symbol"> level. It& #39;s also still below the 50 day" class="img-responsive" style="max-width:100%;"/>

