1. Several people have asked me to explain why a statistical model alone won’t give very accurate pupil-level grades. The short answer is uncertainty. This is the longer answer…
2. It is easy to replicate the usual national-level grade distribution. On its own, that does nothing to secure accurate pupil-level grades: every grade could be wrong. So Ofqual are taking two steps: the first is to model school/college grade distributions...
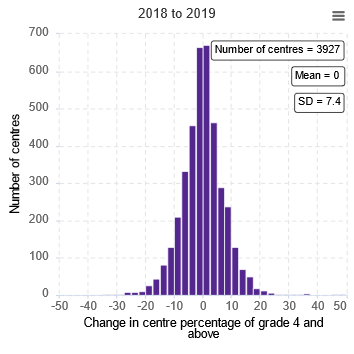
3. The problem with that is that at school level, subject results vary significantly from year to year in an unpredictable way. This Ofqual graph illustrates the point clearly - it is change at school level in percentage getting a 4+ in Eng Lang GCSE from 2018 to 2019.
4. This is a v large entry subject with v large average cohort size. But still only a third of schools had a year on year change of less than 2.5 percentage points in either direction. 5% of centres had a change of more than 15%pts; some over 30%pts.
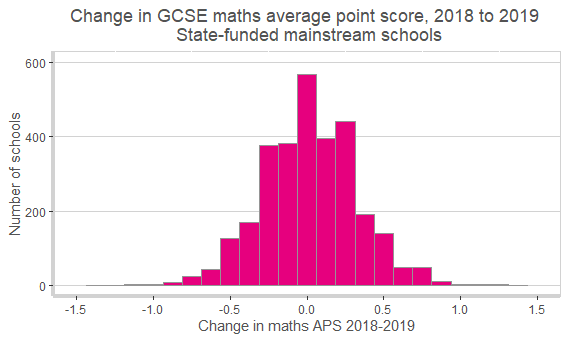
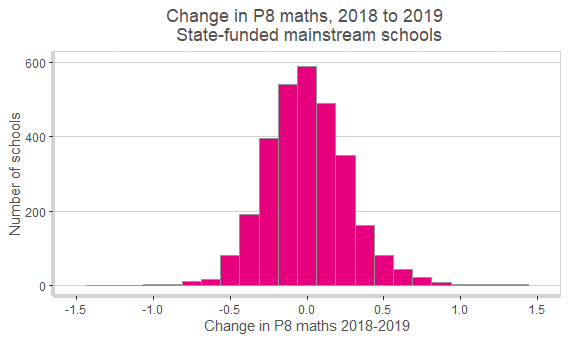
5. Using changes in cohort prior attainment explains some of this variation - but surprisingly little. FFT has looked at this: the two attached graphs of maths GCSE: show that little of the variation from year to year in APS goes away when looking at value added.
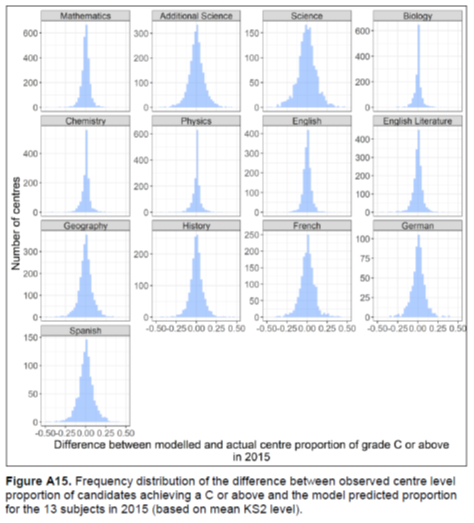
6. Ofqual& #39;s research on this shows a similar picture. (More graphs...) After taking account of KS2 results, significant unpredictable change in school results remains. (Varies by subject- maths one of the more predictable.)
7. So in summary: school results go up and down from year to year quite a lot. You can& #39;t predict accurately which schools would go up and which would go down. You can work out the most likely number to get a certain grade in any school, but this is highly likely to be wrong.
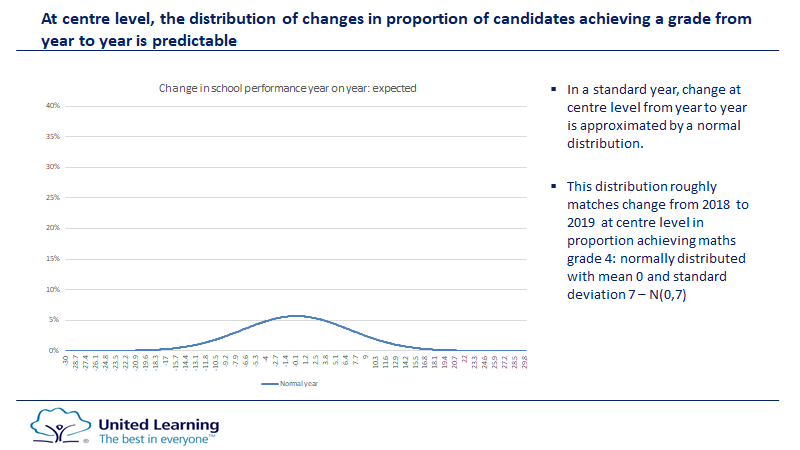
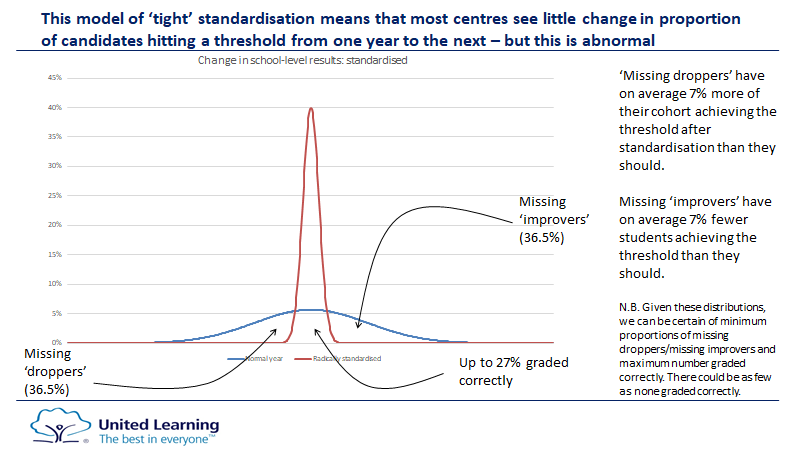
8. To illustrate this: the first graph illustrates the normal pattern of change at centre level (in maths GCSE). The second graph illustrates (heuristically) how this will differ from a radically standardised model . All the normal & #39;droppers& #39; and & #39;risers& #39; are cut out.
9. Using these (plausible but illustrative) numbers, the approach guarantees that 15,000 students who would have got a grade 4 GCSE don& #39;t, while 15,000 who wouldn& #39;t have got one do. There will be a similar picture at all grade boundaries.
10. This seems highly problematic. The difficulty, of course, is accurate identification of which schools would have dropped and which risen and therefore who the winners/losers are. But some schools will find CAGs replaced by less accurate standardised grades.
11. To be clear: I have never advocated adopting CAGs unmoderated. But there is an explicit decision simply to replace CAGs with standardised grades in most school, even where there is no evidence casting doubt on CAGs.
Incidentally: sources quoted @FFTEdu here: https://ffteducationdatalab.org.uk/2020/05/trying-to-predict-improvements-in-gcse-results/;">https://ffteducationdatalab.org.uk/2020/05/t... Ofqual research here: https://assets.publishing.service.gov.uk/government/uploads/system/uploads/attachment_data/file/746952/6432_designed.pdf">https://assets.publishing.service.gov.uk/governmen...

 Read on Twitter