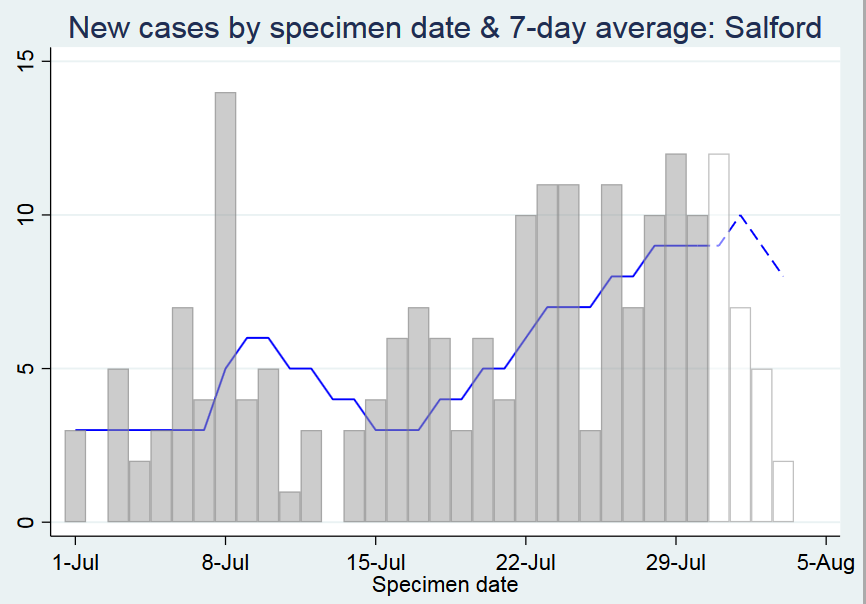
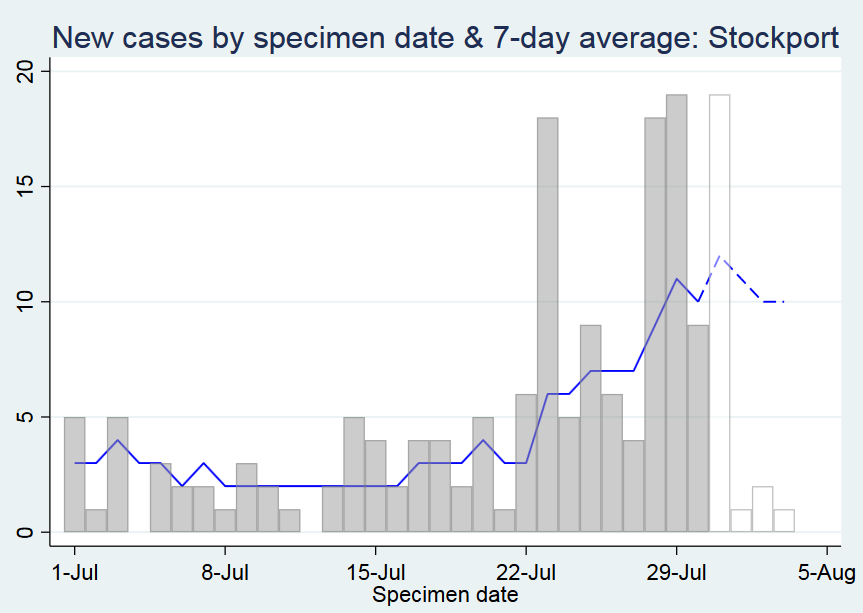
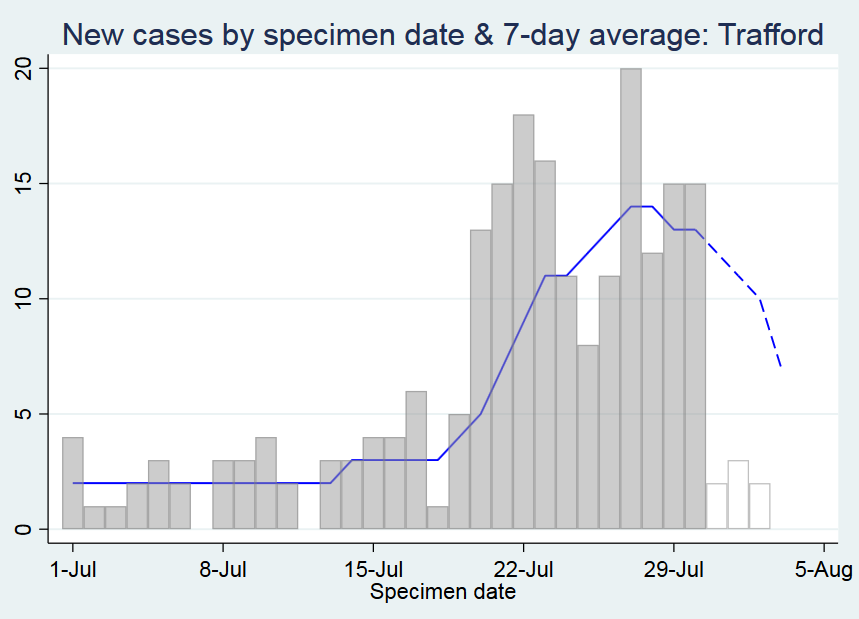
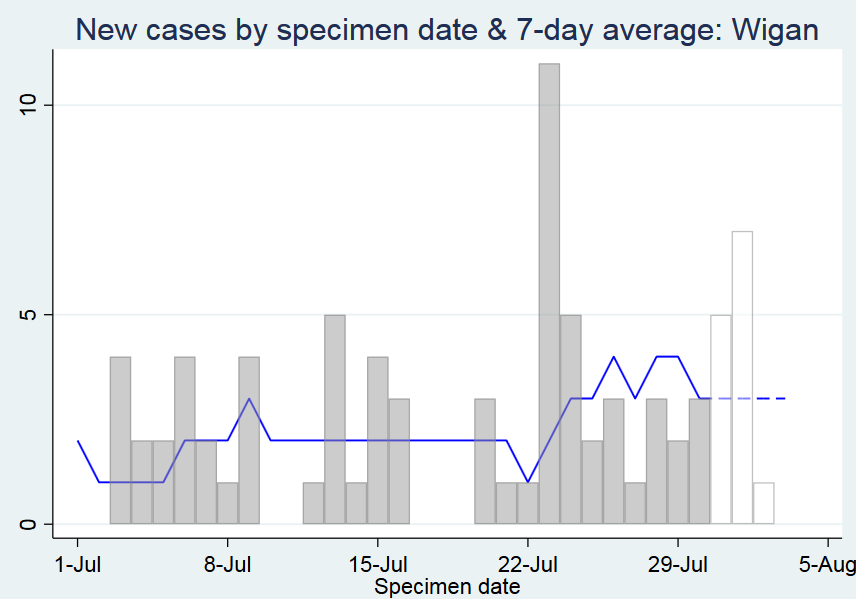
Some Northern lockdown charts of new cases by test date + 7-day ave (subject to change after 30 July).
Couple of points to note:
1. Effect of lockdown would not be observed until, say, 5 Aug given time between infection & test.
2. Cases will partly reflect ramp up of testing.
Couple of points to note:
1. Effect of lockdown would not be observed until, say, 5 Aug given time between infection & test.
2. Cases will partly reflect ramp up of testing.
Let& #39;s start with Greater Manchester.
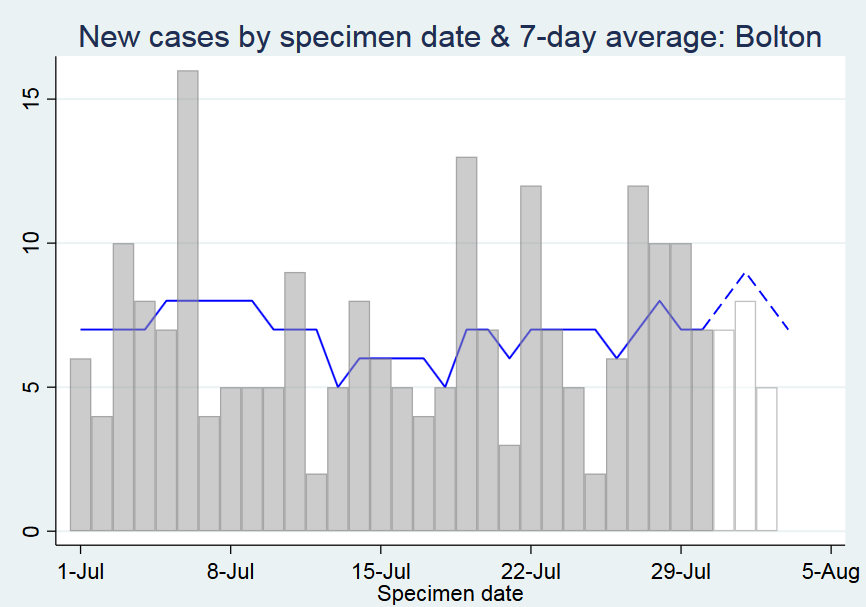
Bolton: slight rise in the average over past couple of weeks but nothing remarkable.
Bolton: slight rise in the average over past couple of weeks but nothing remarkable.
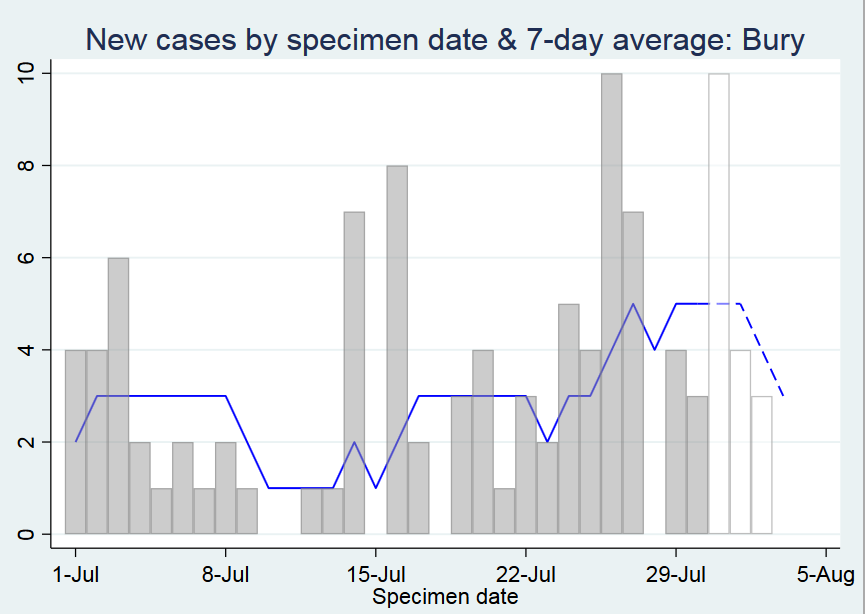
Bury: increase up to 27th July (but still less than 5 cases per day), looks to be stabilising already.
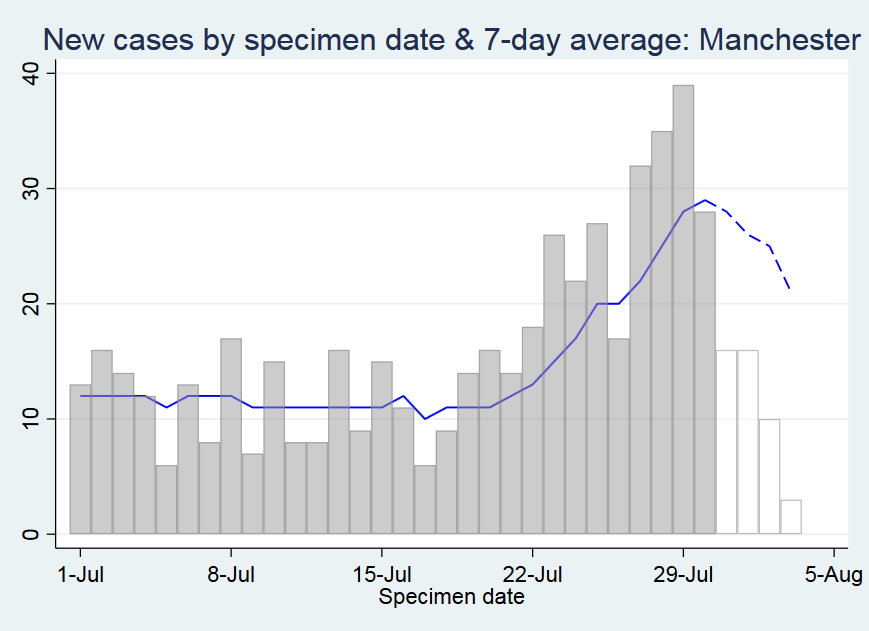
Manchester: fairly steep increase up to 30 July. Early signs that might be starting to stabilise. We will see.
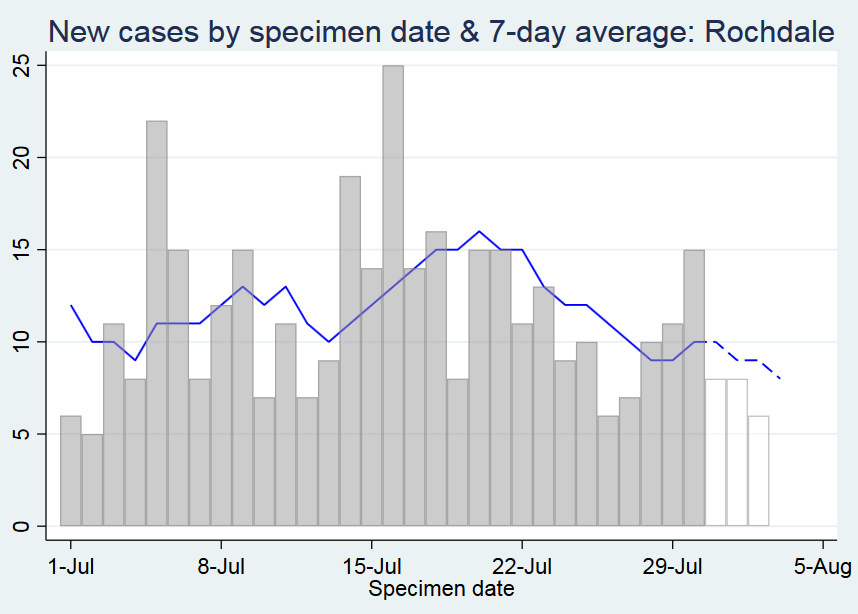
Rochdale: decreasing since 20 July and not much of an increase to start with. And it is still part of the lockdown???
Salford: steady increase but only up to 28 July and average 10 cases per day or less. You would think the BBC would be on top of this one!
I can& #39;t see strong evidence of an exponential increase in cases in a single one of the Greater Manchester boroughs. In fact, most seem to be stabilising before Northern lockdown even announced.
Any thoughts @AndyBurnhamGM ?
Any thoughts @AndyBurnhamGM ?

 Read on Twitter