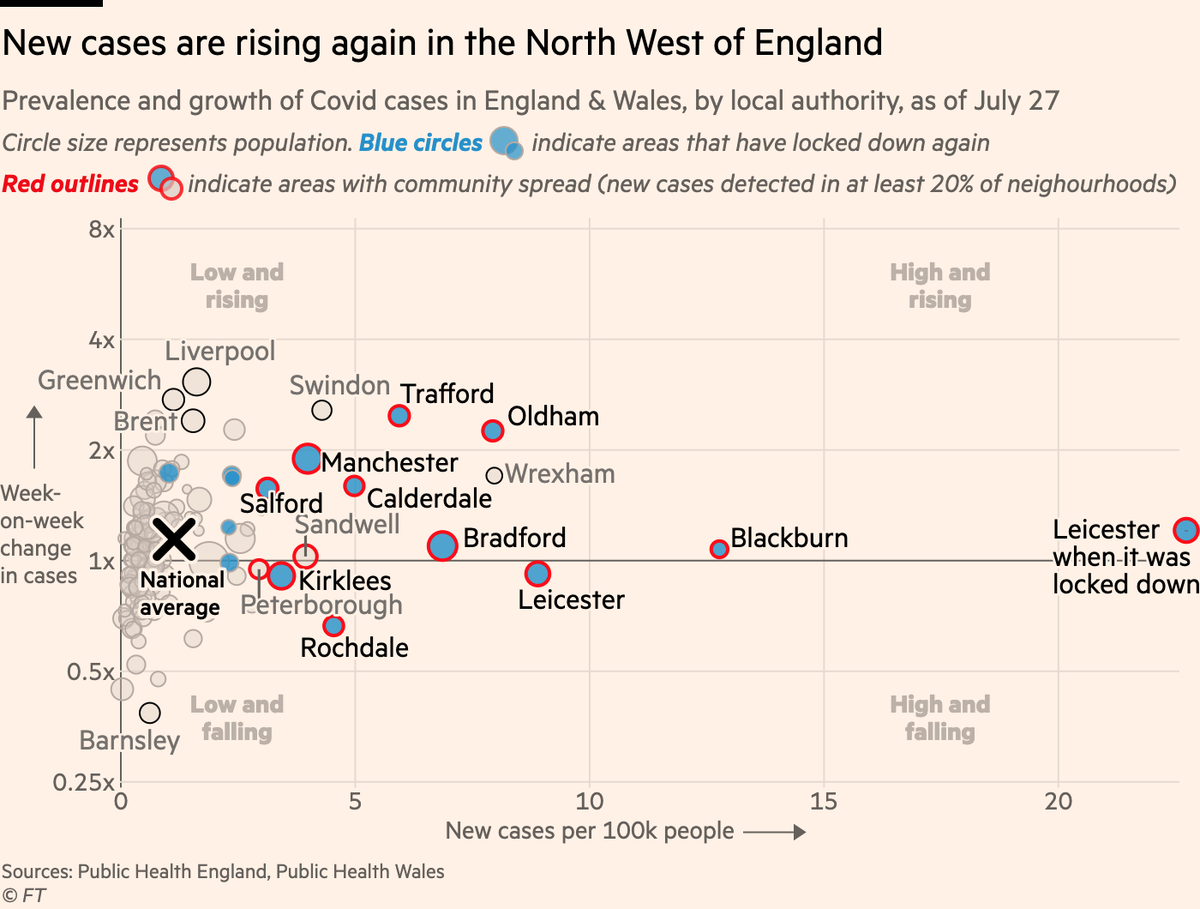
NEW: I’ve updated the chart of new cases in England & Wales to show two critical parts of the story:
• Differentiating between places with an isolated cluster (Swindon’s Iceland depot) vs community spread
• Showing where Leicester was when it locked down https://www.ft.com/content/a2dbf1c0-dcce-4eae-b1f6-f2c31bf0db8a">https://www.ft.com/content/a...
• Differentiating between places with an isolated cluster (Swindon’s Iceland depot) vs community spread
• Showing where Leicester was when it locked down https://www.ft.com/content/a2dbf1c0-dcce-4eae-b1f6-f2c31bf0db8a">https://www.ft.com/content/a...
By incorporating that crucial detail of isolated cluster vs community spread, the data and chart better reflect PHE’s own "watchlist" of local areas (see here https://assets.publishing.service.gov.uk/government/uploads/system/uploads/attachment_data/file/906073/Weekly_COVID19_Surveillance_Report_week_31_FINAL_V2.pdf)
They">https://assets.publishing.service.gov.uk/governmen... also show why Liverpool and Swindon were exempt from the blanket lockdowns.
They">https://assets.publishing.service.gov.uk/governmen... also show why Liverpool and Swindon were exempt from the blanket lockdowns.
And by adding Leicester at lockdown for context, we can show what @robertcuffe explained so concisely last week:
With the new restrictions in the NW, govt is acting *earlier* than they did in Leicester, but is also acting more *lightly* than it did there https://twitter.com/catherinehwyatt/status/1289169931049881600">https://twitter.com/catherine...
With the new restrictions in the NW, govt is acting *earlier* than they did in Leicester, but is also acting more *lightly* than it did there https://twitter.com/catherinehwyatt/status/1289169931049881600">https://twitter.com/catherine...
Hope this adds more of the nuance around the story:
• The resurgence is concerning
• But each outbreak is different, some riskier than others even if numbers look the same
• Action being taken earlier. New restrictions don’t mean new Leicester, they’re to prevent new Leicester
• The resurgence is concerning
• But each outbreak is different, some riskier than others even if numbers look the same
• Action being taken earlier. New restrictions don’t mean new Leicester, they’re to prevent new Leicester

 Read on Twitter


