LYING WITH GRAPHS: SUNDAY EDITION
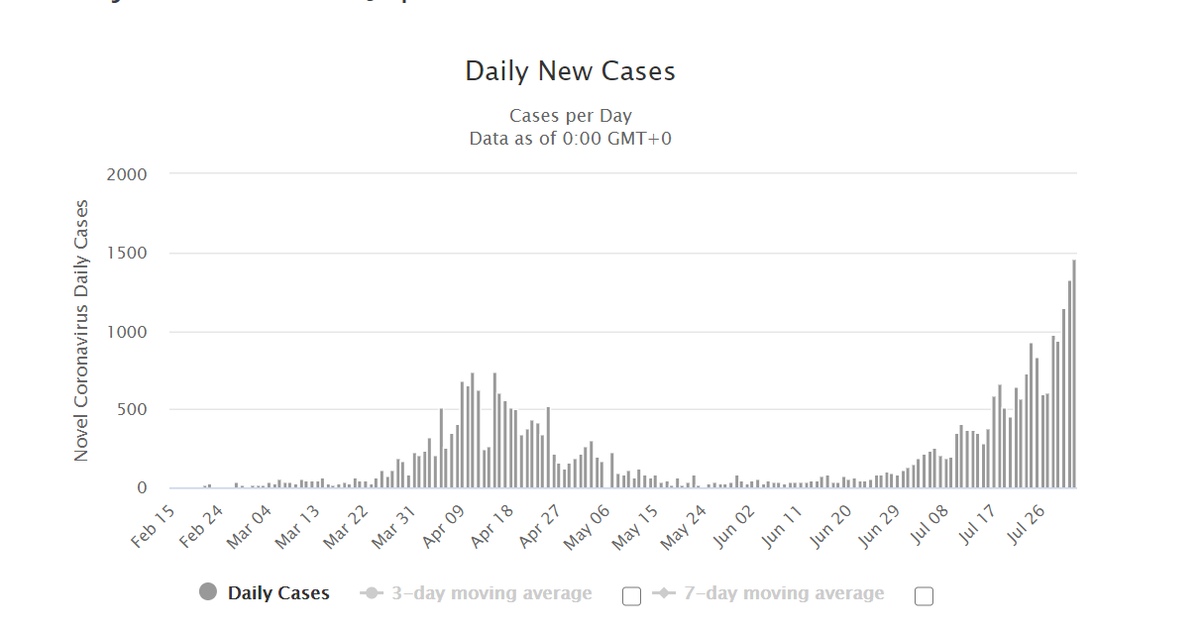
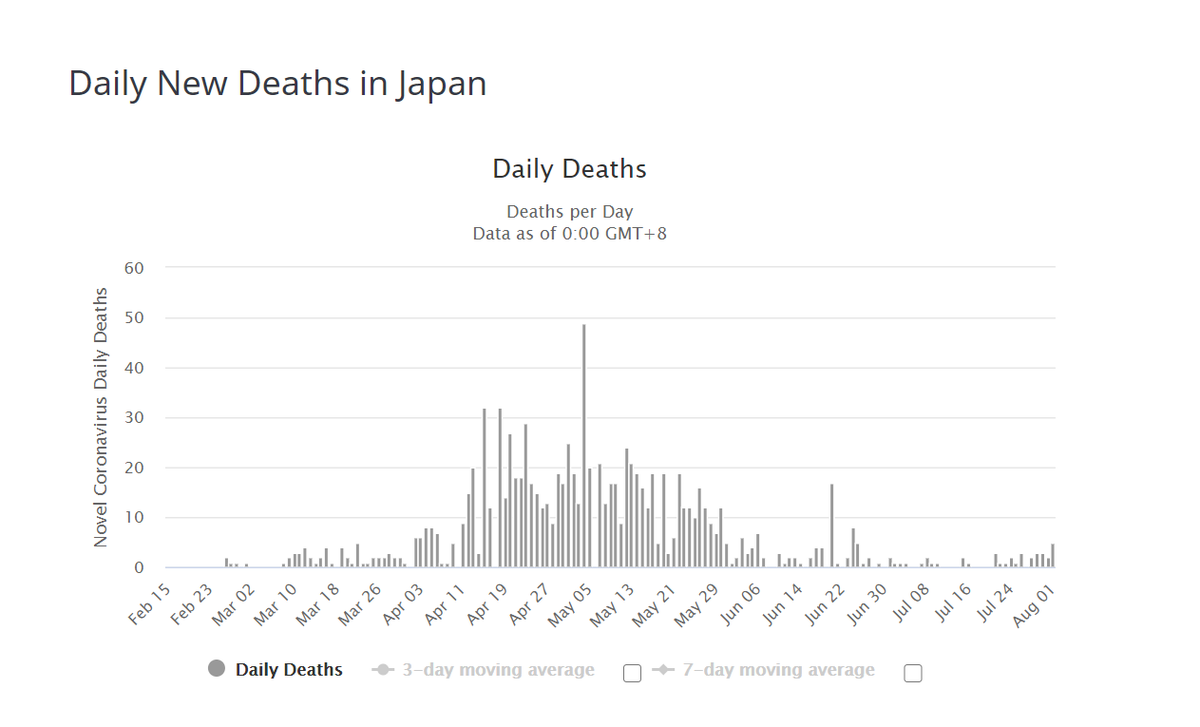
what addled & irresponsible state could this be w/ cases breaking out to new highs?
haven& #39;t they heard of masks/social distancing?
shouldn& #39;t we be scolding them?
over twice the rate of april!!!
who can this miscreant be?
what addled & irresponsible state could this be w/ cases breaking out to new highs?
haven& #39;t they heard of masks/social distancing?
shouldn& #39;t we be scolding them?
over twice the rate of april!!!
who can this miscreant be?
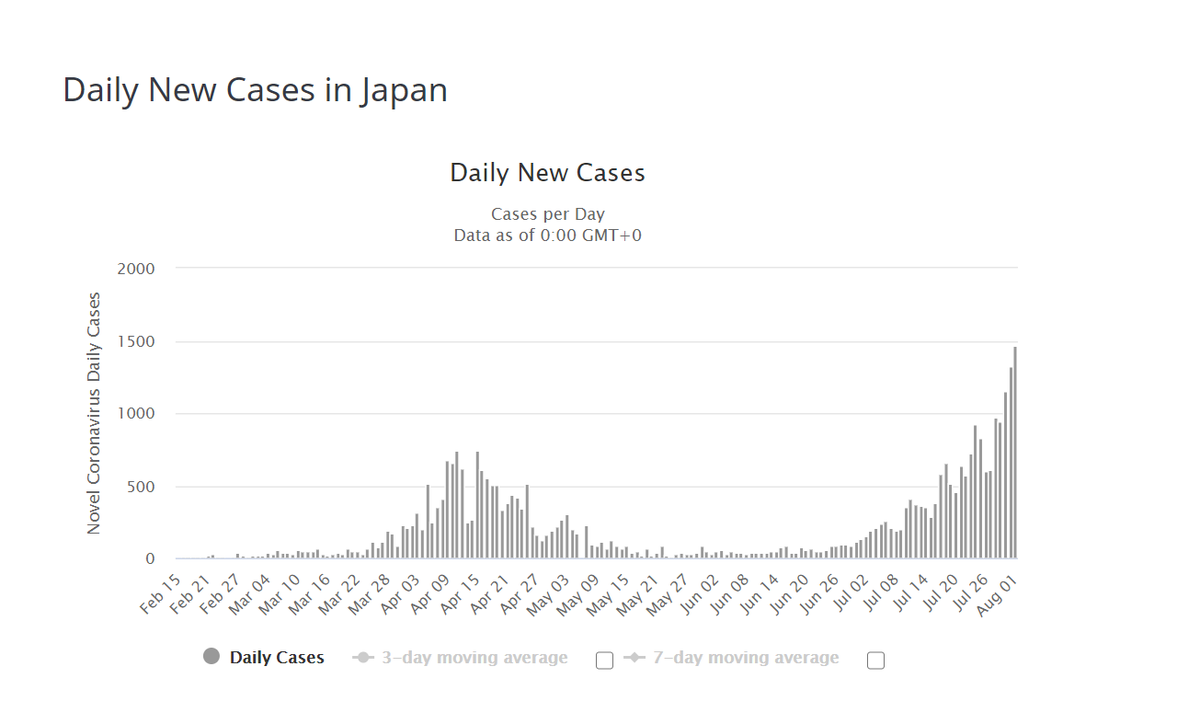
well, if you guessed "japan", nice one.
now let& #39;s add some context: japan has 126 million people.
1500 cases a day is a blip. it& #39;s 12 per million pop per day
NY state had 51 DEATHS per mm/day in april. this is 12 CASES/mm/d.
yawn.
but it& #39;s not even that bad.
now let& #39;s add some context: japan has 126 million people.
1500 cases a day is a blip. it& #39;s 12 per million pop per day
NY state had 51 DEATHS per mm/day in april. this is 12 CASES/mm/d.
yawn.
but it& #39;s not even that bad.
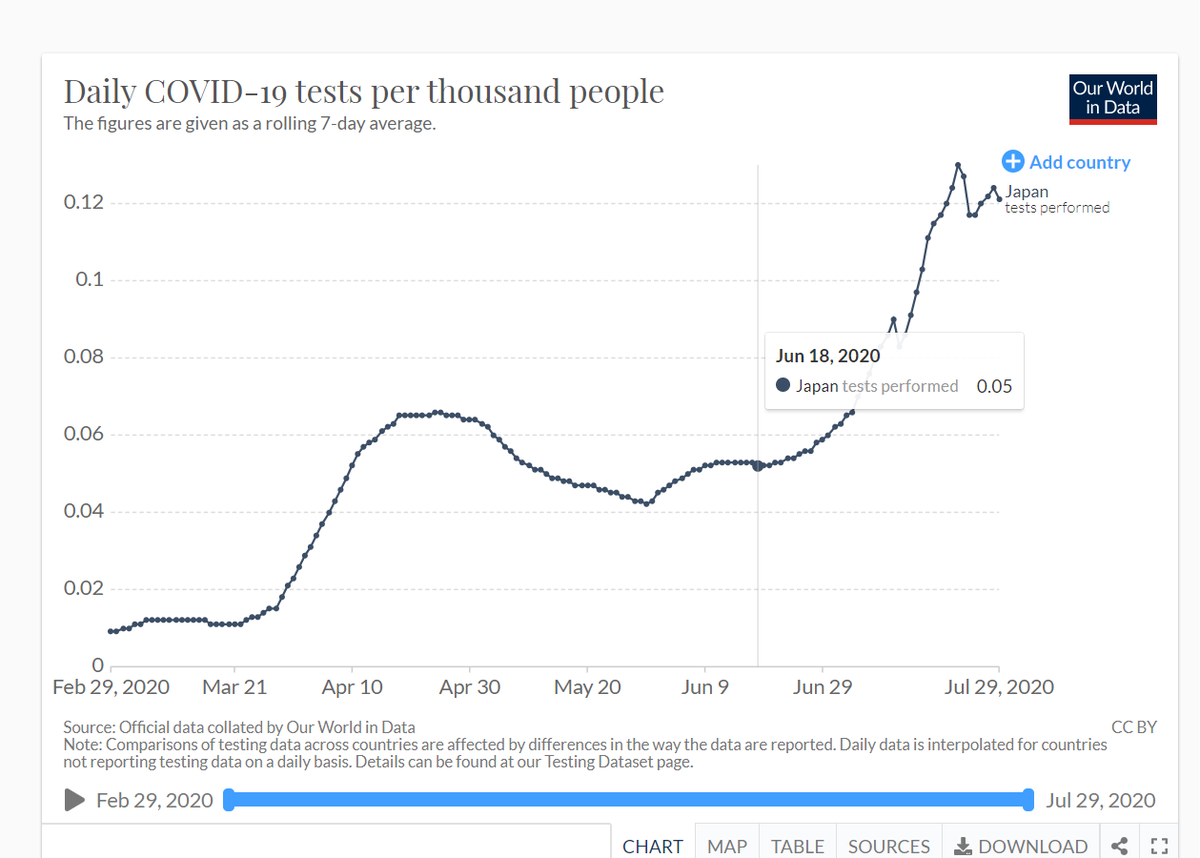
on their 4/11 cases peak, japan was testing 0.06/1000 people.
they are now at 0.12, twice as many.
peak then was 743. peak now is 1464. it& #39;s actually slightly lower than last one.
see how easy it is to lie with selective charts?
they are now at 0.12, twice as many.
peak then was 743. peak now is 1464. it& #39;s actually slightly lower than last one.
see how easy it is to lie with selective charts?
that first chart looks SCARY. wow, what an outbreak.
but, it& #39;s actually a tiny outbreak that would not even register in the US.
it& #39;s 11 cases per million per day. NY state peaked at 600.
and it& #39;s not even higher on a per test basis that april. the slope of the peaks is flat
but, it& #39;s actually a tiny outbreak that would not even register in the US.
it& #39;s 11 cases per million per day. NY state peaked at 600.
and it& #39;s not even higher on a per test basis that april. the slope of the peaks is flat
but, of course, now i& #39;m telling you a different set of lies.
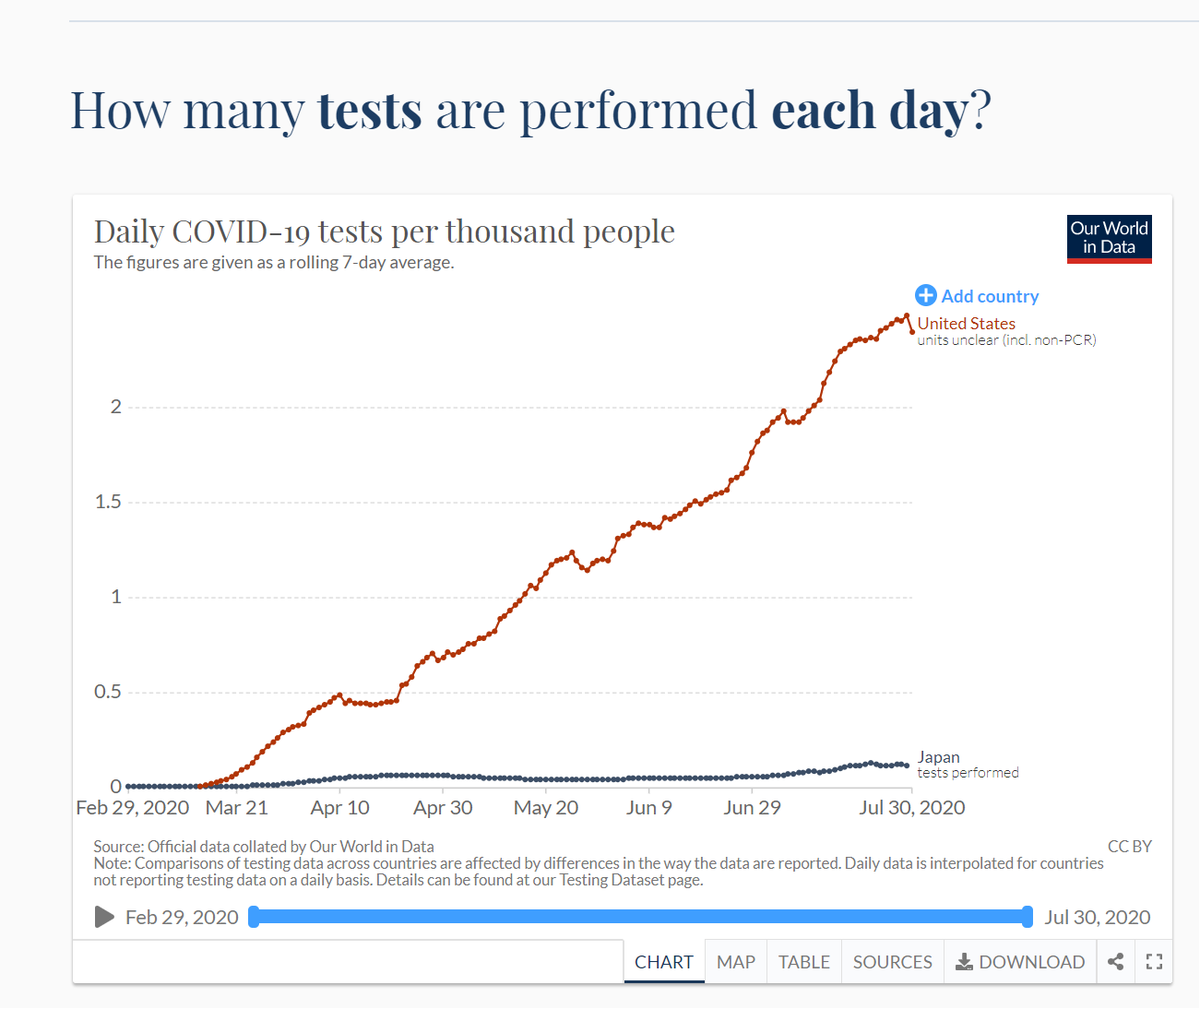
japan is barely testing at all.
the US is testing 20 times as much as japan on a per capita basis.
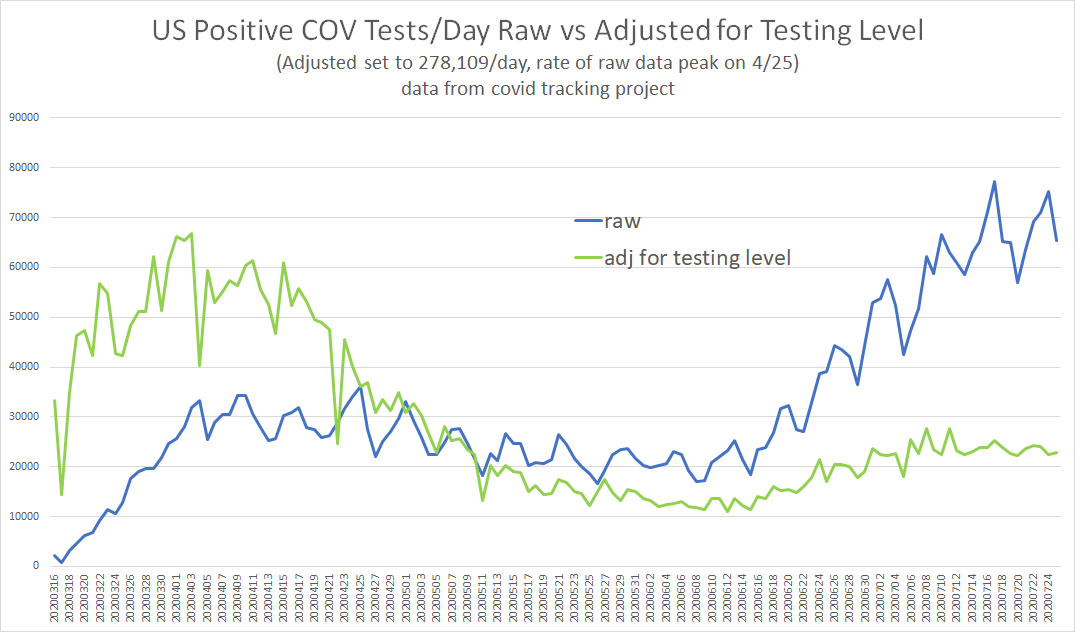
the US reported 58k cases and dropping. JPN = 1500 X 20 = 30,000 and rising if we adjust japan to US sample rate
japan is barely testing at all.
the US is testing 20 times as much as japan on a per capita basis.
the US reported 58k cases and dropping. JPN = 1500 X 20 = 30,000 and rising if we adjust japan to US sample rate
japan& #39;s cases are flat with the april peak on a testing level adjusted basis.
but in the US, it looks like this: we& #39;re at 34% of april peak and dropping.
japan is at 99% and rising.
but in the US, it looks like this: we& #39;re at 34% of april peak and dropping.
japan is at 99% and rising.
and the japanese are paragons of mask wearing AND have been more locked down that the US for the last 2 months.
huh.
at what point can we just stop pretending any of these non pharma interventions work?
they don& #39;t.
when it& #39;s your covid season, you get covid.
huh.
at what point can we just stop pretending any of these non pharma interventions work?
they don& #39;t.
when it& #39;s your covid season, you get covid.
of course, bacially no one in japan (or anywhere on the pac rim) has died of this, probably from more extensive pre existing immunity from exposure to SARS like viruses.
goodness, reality gets complex, doesn& #39;t it?
perhaps using single metrics and charts can be misleading.
goodness, reality gets complex, doesn& #39;t it?
perhaps using single metrics and charts can be misleading.
so remember this any time someone shows you a single metric, especially cases, and uses it to scare you or claim you need to adopt X policy.
make sure you know what you& #39;re really looking at.
if a picture is worth 1000 words, imagine how many lies it can tell...
make sure you know what you& #39;re really looking at.
if a picture is worth 1000 words, imagine how many lies it can tell...

 Read on Twitter