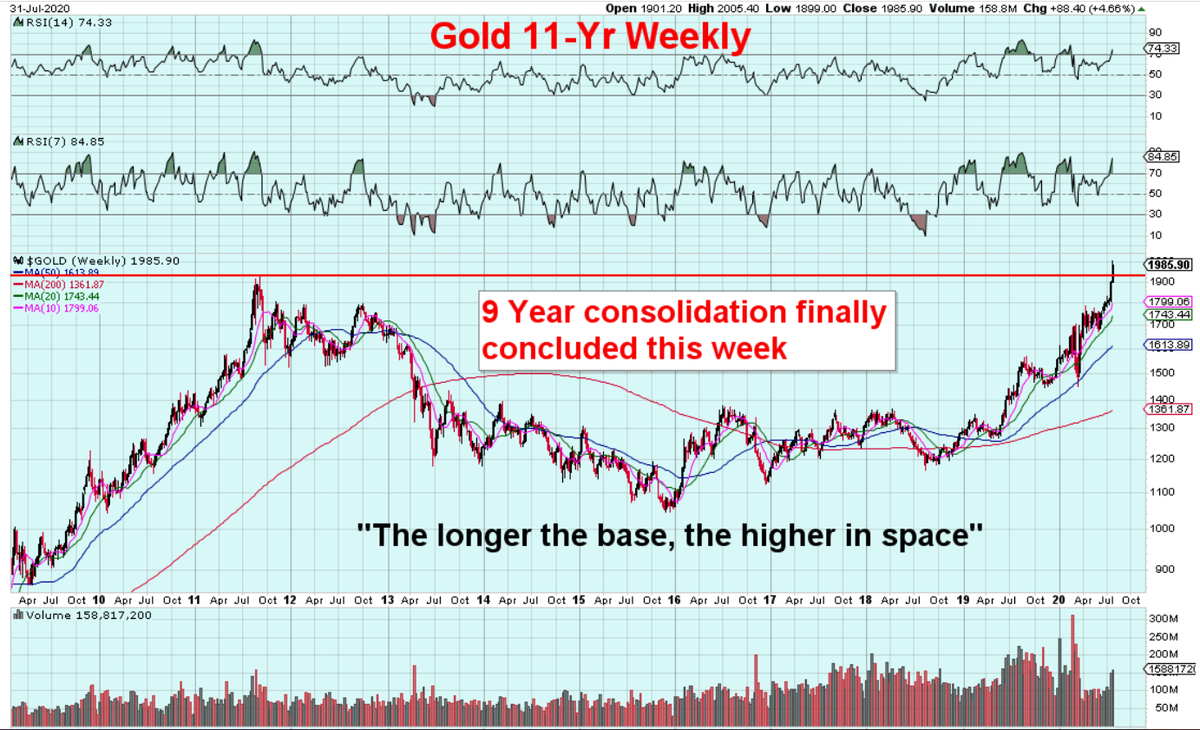
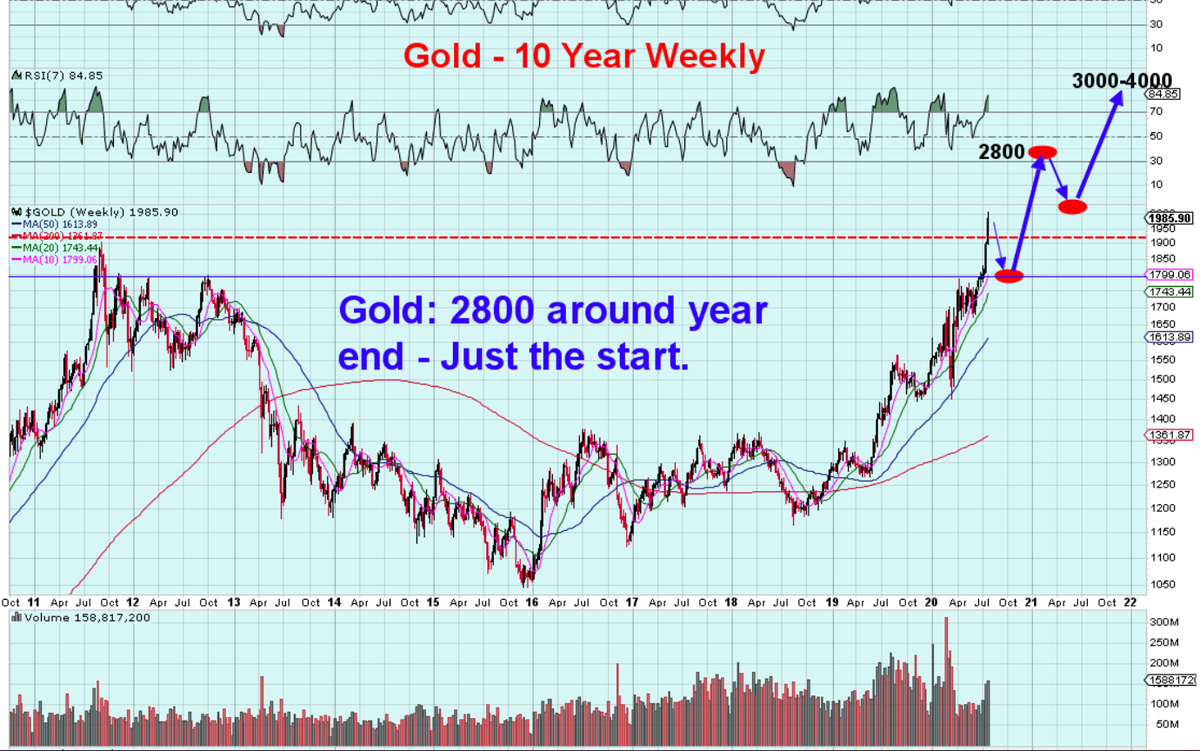
After concluding a monumental 9 year consolidation in #Gold, I thought I would mark the event with a little thread...
Needless to say, this event is very Bullish, short-medium, medium and long term. The fun, my friends, has only just started.
1
Needless to say, this event is very Bullish, short-medium, medium and long term. The fun, my friends, has only just started.
1
2
A long term, multi-year cup or & #39;pan& #39; formation is the most bullish of technical chart patterns.
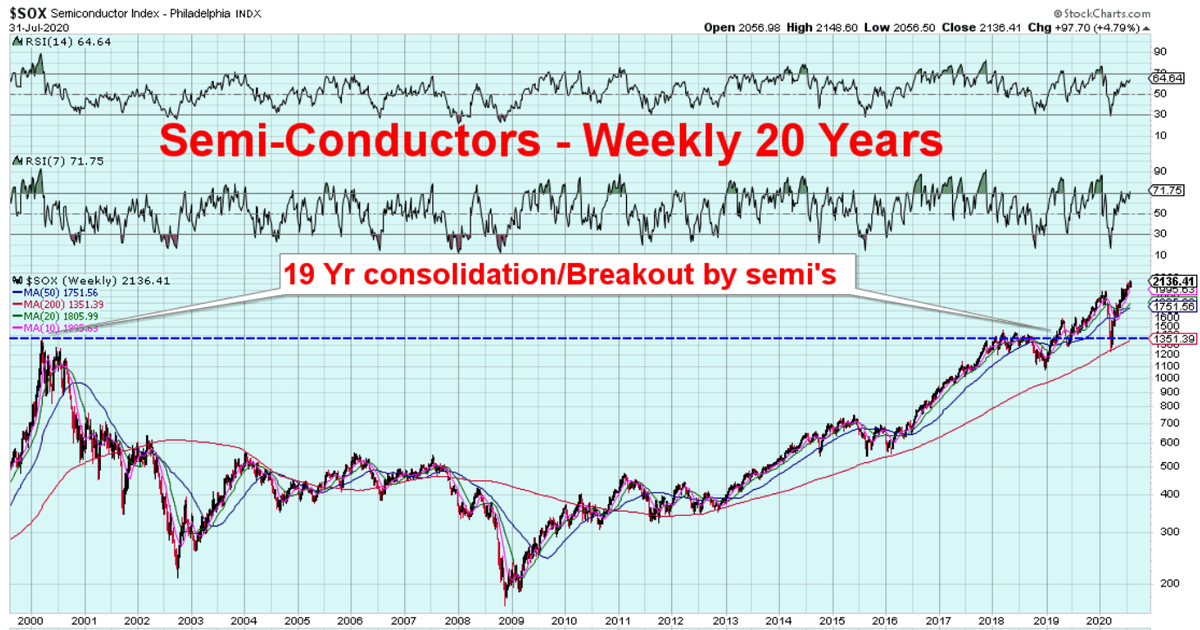
Here is another similar pattern that has taken 20 years to develop, finally concluding properly last year. No surprise then SOX has risen by 58% since breaking out last year.
A long term, multi-year cup or & #39;pan& #39; formation is the most bullish of technical chart patterns.
Here is another similar pattern that has taken 20 years to develop, finally concluding properly last year. No surprise then SOX has risen by 58% since breaking out last year.
3
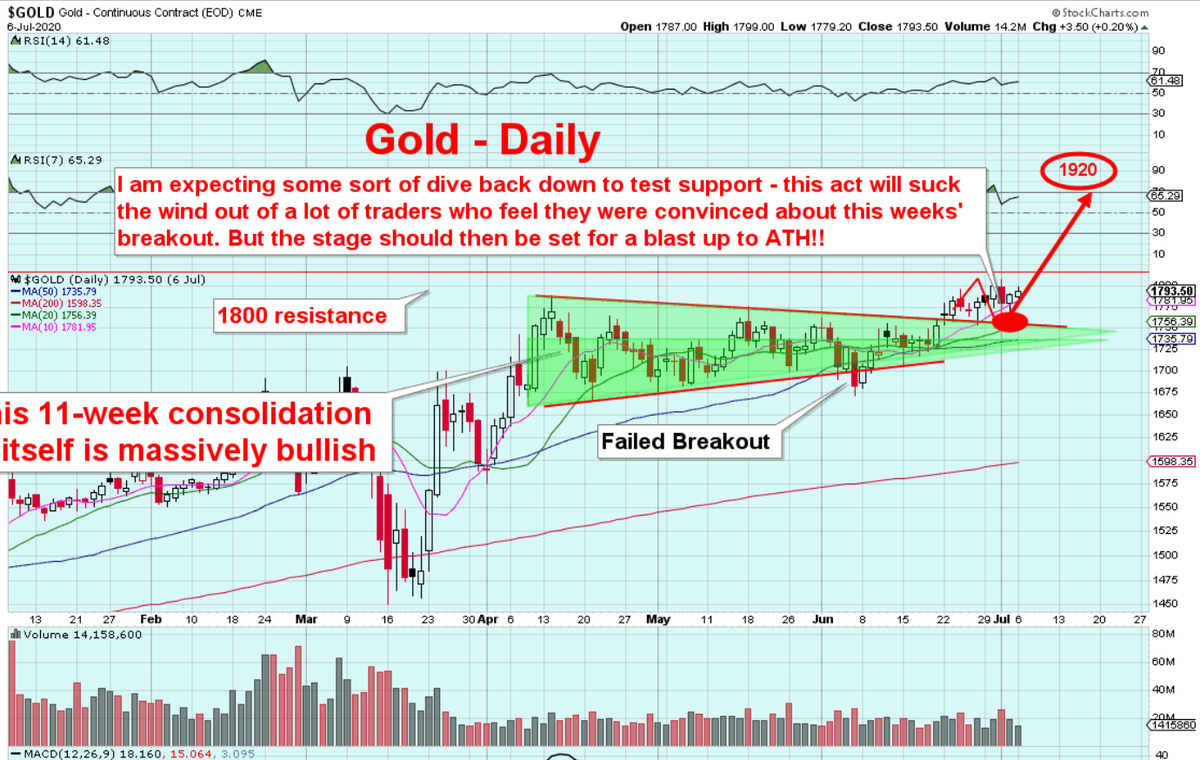
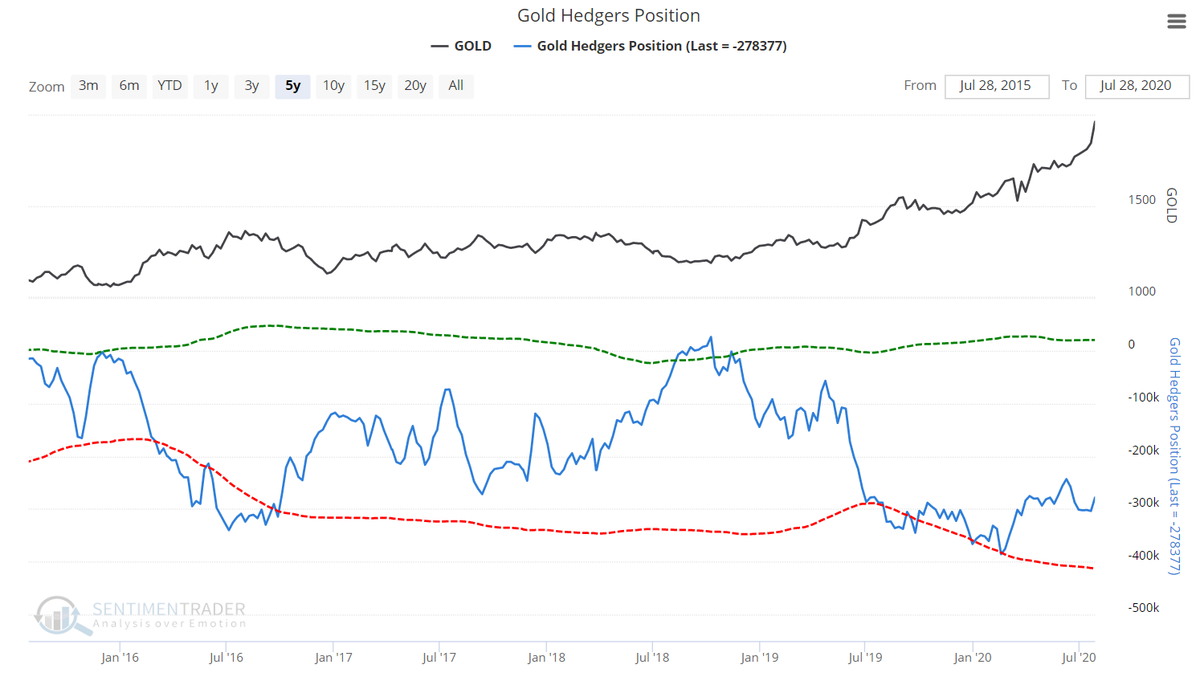
1-2 years ago I was concerned, as was a lot of other traders, about the size of commercial Short positions on Gold...It influenced my trading-as this is smart money positioning..However, since breaking out of a significant 11-week (green) triangle consolidation (end of June)...
1-2 years ago I was concerned, as was a lot of other traders, about the size of commercial Short positions on Gold...It influenced my trading-as this is smart money positioning..However, since breaking out of a significant 11-week (green) triangle consolidation (end of June)...
4
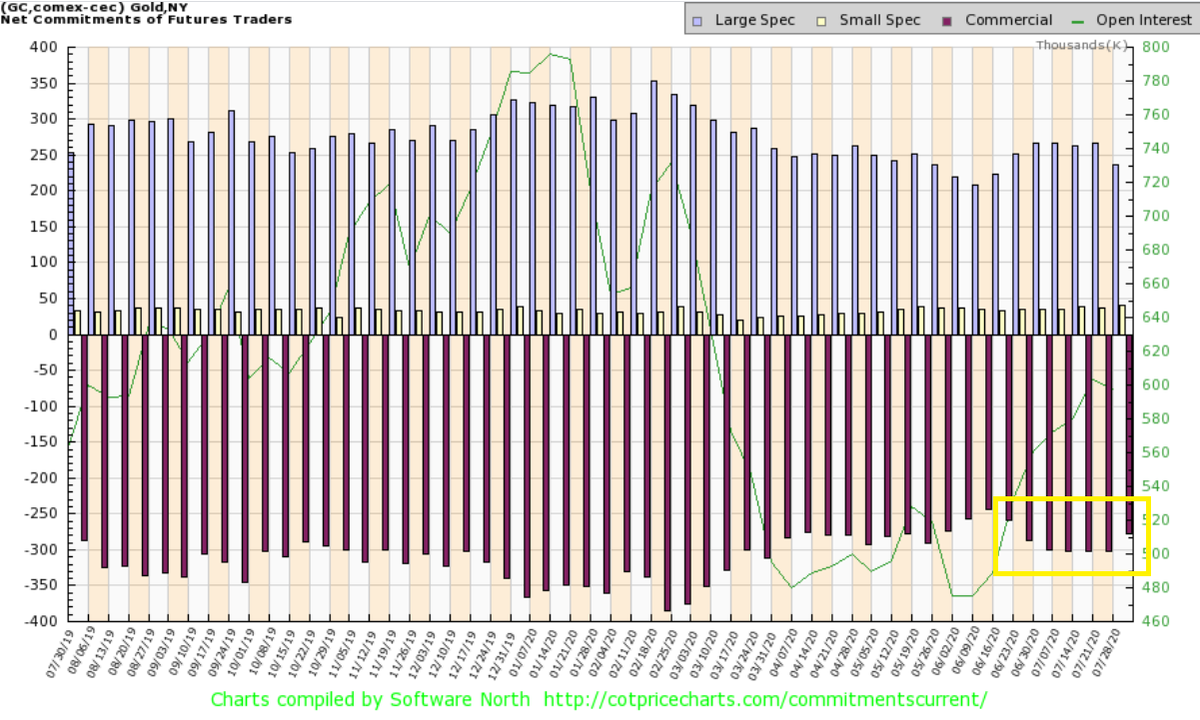
..the CoT& #39;s have markedly improved. *Counter-intuitive*. Since the price has broken out of the above Triangle, commercial Shorts have gone the opposite way. Funny eh? I guarantee in the next 1/4 you will read JPM et al reporting huge losses as a result of its& #39; trading of PM& #39;s!
..the CoT& #39;s have markedly improved. *Counter-intuitive*. Since the price has broken out of the above Triangle, commercial Shorts have gone the opposite way. Funny eh? I guarantee in the next 1/4 you will read JPM et al reporting huge losses as a result of its& #39; trading of PM& #39;s!
5
By rights, those shorts should have dropped off the bottom of the chart with Gold moving up-hence short squeeze. They have literally lost their shorts!
To see how long the banks have been shorting the hell out of Gold in their attempt at controlling it, here is the 5 yr chart..
By rights, those shorts should have dropped off the bottom of the chart with Gold moving up-hence short squeeze. They have literally lost their shorts!
To see how long the banks have been shorting the hell out of Gold in their attempt at controlling it, here is the 5 yr chart..

 Read on Twitter