Learning thread (things I’ve learned that helped me become a better trader and can make you better traders too):
-EMA (Exponential Moving Average) the sum of a stocks closing price in a set time frame
- common time frames used: 15,25,50,200
-MACD (Moving Average Coverage Divergence)
- basically is a indicator that tracks momentum of a stock (oversold vs. over bought)
- common time frames used: 15,25,50,200
-MACD (Moving Average Coverage Divergence)
- basically is a indicator that tracks momentum of a stock (oversold vs. over bought)
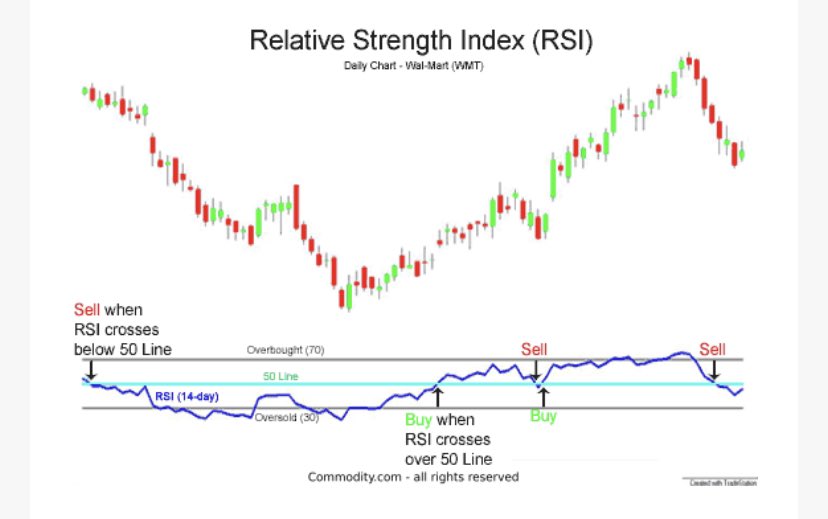
-RSI (Relative Strength Index) another way to tell momentum
-goes between 0 and 100
-generally over 70 is over bought and under 30 is oversold
-in a bull market the RSI usually remains 40 - 90 and in bear markets it is usually is 10 - 60
-goes between 0 and 100
-generally over 70 is over bought and under 30 is oversold
-in a bull market the RSI usually remains 40 - 90 and in bear markets it is usually is 10 - 60
When a stock is facing resistance the RSI usually is between 50 and 60
- the RSI is a good tool to also find when a stock is losing momentum or gaining some
- the RSI is a good tool to also find when a stock is losing momentum or gaining some
A great visual from http://commodity.com"> http://commodity.com shows how to know when to sell and buy depending on the RSI.
Lines of support:
- a price that the market sets naturally. if the price dips it will stop dipping at that price
-it stops there because people see that price as a point where they want to buy again
-it is a price where the stock dips to multiple times and goes back up
- a price that the market sets naturally. if the price dips it will stop dipping at that price
-it stops there because people see that price as a point where they want to buy again
-it is a price where the stock dips to multiple times and goes back up
Lines of resistance:
-the opposite of a line of support
-if a stock rises to a price the resistance is a price that shareholders will usually sell at so the stock will bounce off of that line back down because that is where people tend to sell
-the opposite of a line of support
-if a stock rises to a price the resistance is a price that shareholders will usually sell at so the stock will bounce off of that line back down because that is where people tend to sell
Websites I use often:
-finviz
-stockcharts
-chartmills
-bezinga
-finviz
-stockcharts
-chartmills
-bezinga
I don’t usually post about options but this is where is learned about them: https://youtu.be/SD7sw0bf1ms ">https://youtu.be/SD7sw0bf1...
Hope this helped. Let’s beat the market together.

 Read on Twitter


