Here& #39;s the latest global epidemic curve from @WHO .
Notice the huge swath from the Americas ("PAHO" = Pan American Health Organization).
https://www.who.int/docs/default-source/coronaviruse/situation-reports/20200724-covid-19-sitrep-186.pdf?sfvrsn=4da7b586_2
(2/n)">https://www.who.int/docs/defa...
Notice the huge swath from the Americas ("PAHO" = Pan American Health Organization).
https://www.who.int/docs/default-source/coronaviruse/situation-reports/20200724-covid-19-sitrep-186.pdf?sfvrsn=4da7b586_2
(2/n)">https://www.who.int/docs/defa...
Also India, whose infection rates just keeps building up.
"SEARO" = Regional Office for South-East Asia
(3/n)
"SEARO" = Regional Office for South-East Asia
(3/n)
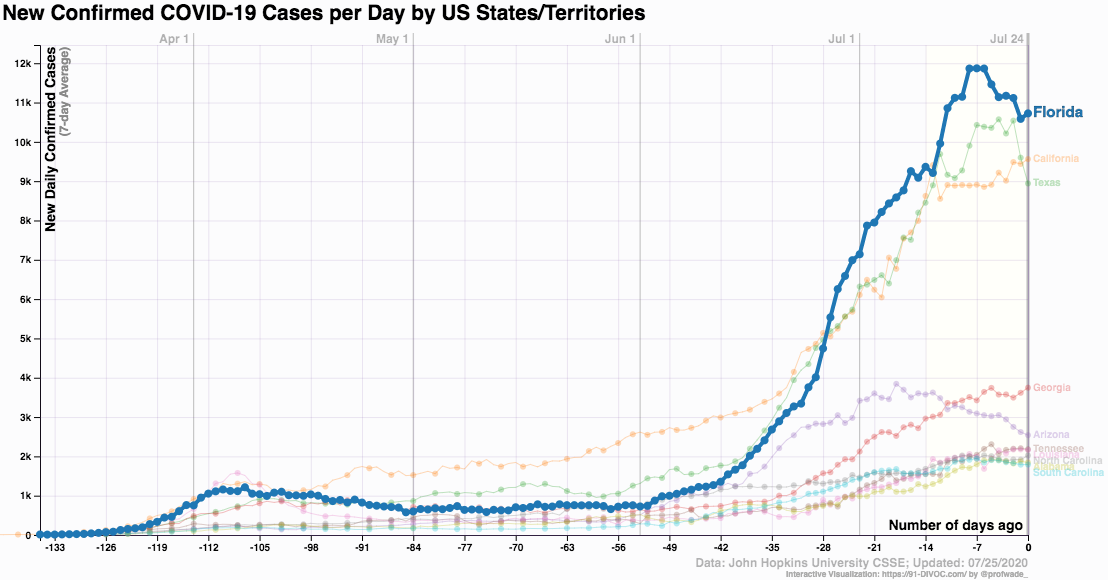
That national pattern is confirmed in the 91-DIVOC data by @profwade_ .
http://www.91-divoc.com/pages/covid-visualization/
(4/n)">https://www.91-divoc.com/pages/cov...
http://www.91-divoc.com/pages/covid-visualization/
(4/n)">https://www.91-divoc.com/pages/cov...
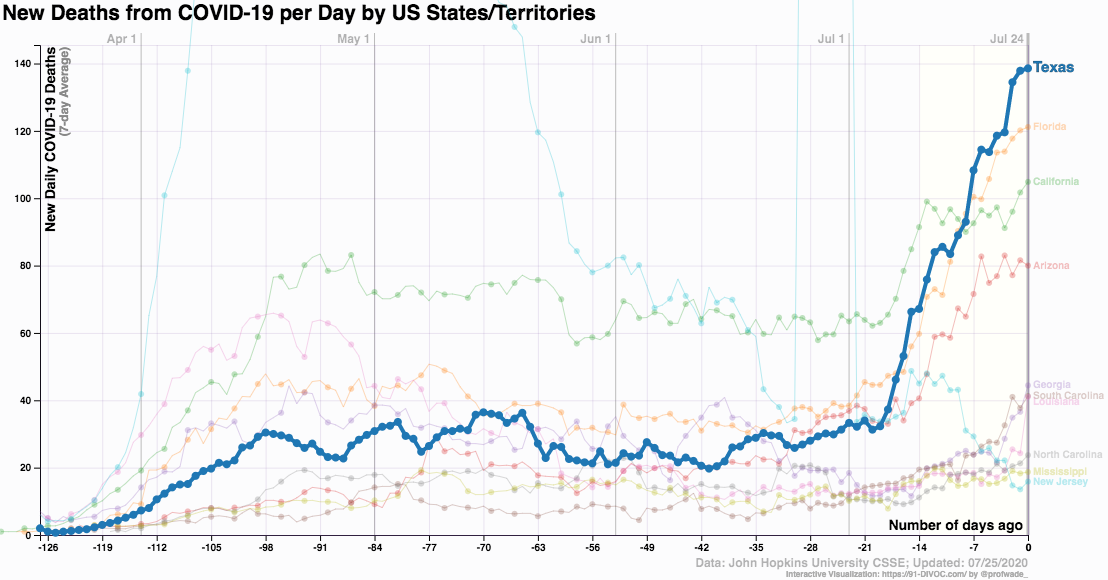
Death rates appear differently than infections.
America& #39;s deaths are rising, but more slowly than infections.
(5/n)
America& #39;s deaths are rising, but more slowly than infections.
(5/n)
Overall stats?
Global infections: 15,995,114
Deaths: 643,736
https://www.worldometers.info/coronavirus/
(6/n)">https://www.worldometers.info/coronavir...
Global infections: 15,995,114
Deaths: 643,736
https://www.worldometers.info/coronavirus/
(6/n)">https://www.worldometers.info/coronavir...
Remember than many think these official stats are seriously undercounting the reality for a variety of reasons.
Let& #39;s say they& #39;re off by a factor of five.
Estimate global infections at 79,975,570.
Deaths: 3,218,680.
(7/n)
Let& #39;s say they& #39;re off by a factor of five.
Estimate global infections at 79,975,570.
Deaths: 3,218,680.
(7/n)
Or try official stats being just 1/3rd of reality.
Total infections would be around 45 million and deaths closer to 2 million.
(8/n)
Total infections would be around 45 million and deaths closer to 2 million.
(8/n)
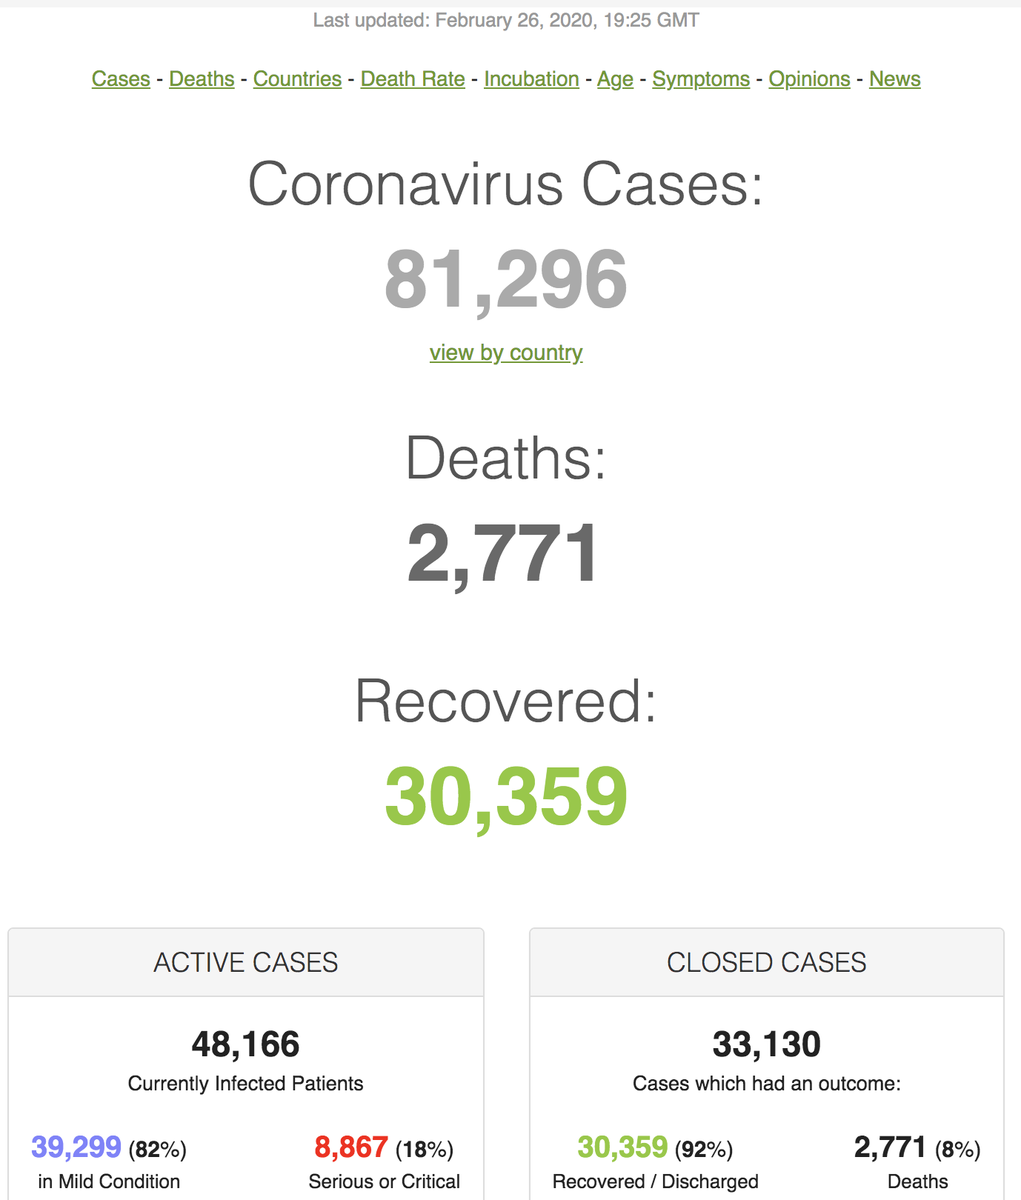
(Sorry - late, not mid-February)
(10/n)
(10/n)
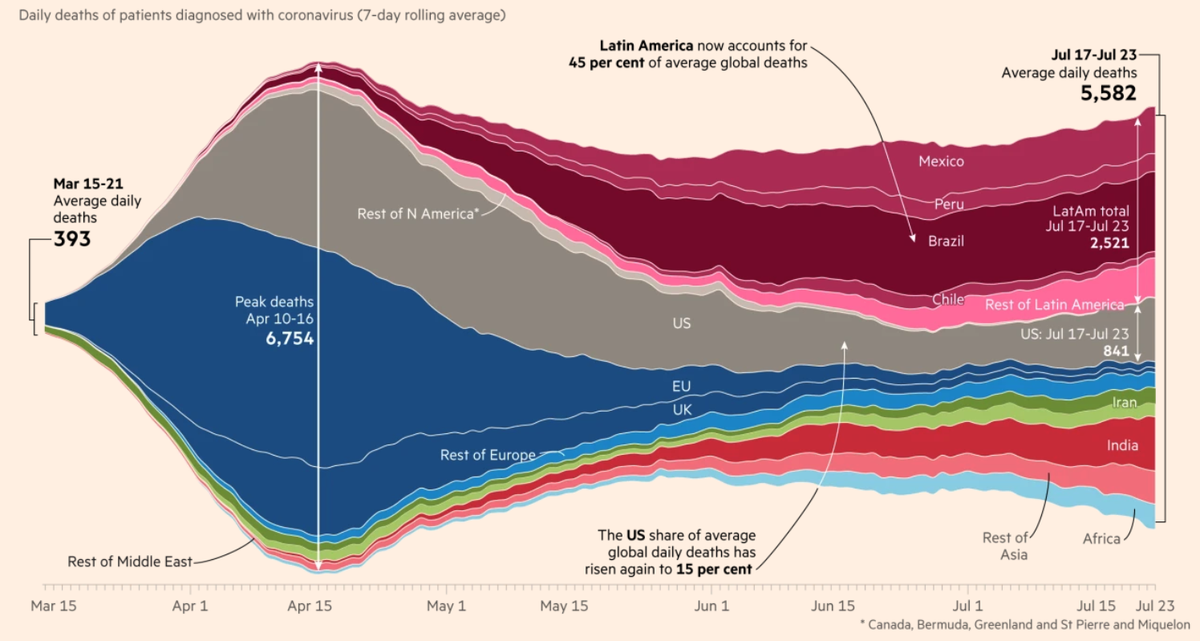
Back to the present: the Americas are leading the world in #Covid_19 deaths.
@FinancialTimes graphic:
https://www.ft.com/content/a26fbf7e-48f8-11ea-aeb3-955839e06441
(11/n)">https://www.ft.com/content/a...
@FinancialTimes graphic:
https://www.ft.com/content/a26fbf7e-48f8-11ea-aeb3-955839e06441
(11/n)">https://www.ft.com/content/a...
How& #39;s the US faring?
According to @CDCgov :
TOTAL CASES: 4,024,492
TOTAL DEATHS: 143,868
https://www.cdc.gov/coronavirus/2019-ncov/cases-updates/cases-in-us.html
(12/n)">https://www.cdc.gov/coronavir...
According to @CDCgov :
TOTAL CASES: 4,024,492
TOTAL DEATHS: 143,868
https://www.cdc.gov/coronavirus/2019-ncov/cases-updates/cases-in-us.html
(12/n)">https://www.cdc.gov/coronavir...
That means about 1.2% of America is infected, as the US just broke 330 million people this month.
https://www.census.gov/popclock/
(13/n)">https://www.census.gov/popclock/...
https://www.census.gov/popclock/
(13/n)">https://www.census.gov/popclock/...
Let& #39;s say reported cases and deaths are undercounted by 3.
Then we could estimate around 12 million infections and 431,604 deaths.
(14/n)
Then we could estimate around 12 million infections and 431,604 deaths.
(14/n)
If we break infections down by state, the big 3 are still very high: California, Texas, Florida.
Source: http://www.91-divoc.com/pages/covid-visualization/
(15/n)">https://www.91-divoc.com/pages/cov...
Source: http://www.91-divoc.com/pages/covid-visualization/
(15/n)">https://www.91-divoc.com/pages/cov...
@COVID19Tracking has a good thread on the unevenness of US data:
https://twitter.com/COVID19Tracking/status/1286793355742126080
(17/n)">https://twitter.com/COVID19Tr...
https://twitter.com/COVID19Tracking/status/1286793355742126080
(17/n)">https://twitter.com/COVID19Tr...
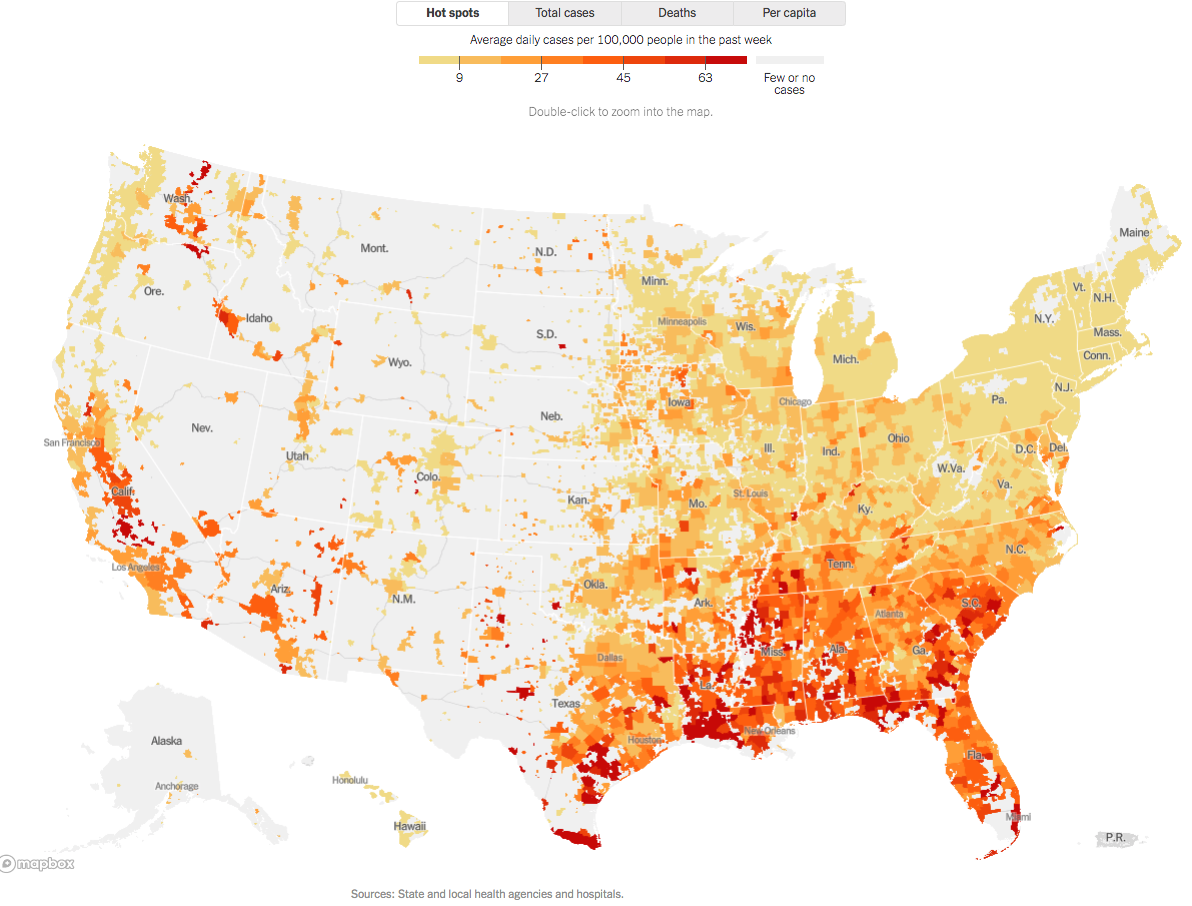
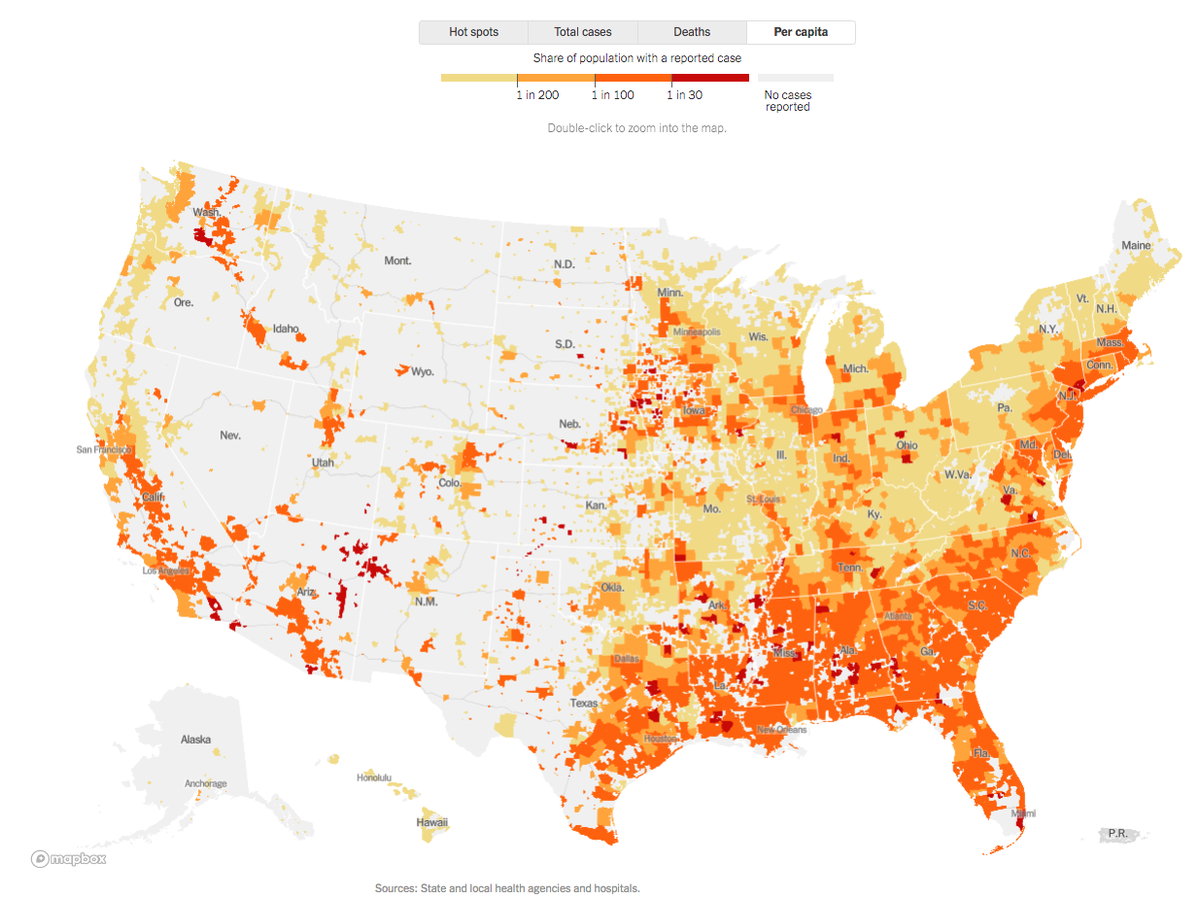
We can zoom in a bit and look at #Covid_19 data by county, thanks to the @nytimes (is nobody else doing this?)
https://www.nytimes.com/interactive/2020/us/coronavirus-us-cases.html?action=click&pgtype=Article&state=default&module=styln-coronavirus®ion=TOP_BANNER&context=storylines_menu
(18/n)">https://www.nytimes.com/interacti...
https://www.nytimes.com/interactive/2020/us/coronavirus-us-cases.html?action=click&pgtype=Article&state=default&module=styln-coronavirus®ion=TOP_BANNER&context=storylines_menu
(18/n)">https://www.nytimes.com/interacti...

 Read on Twitter


