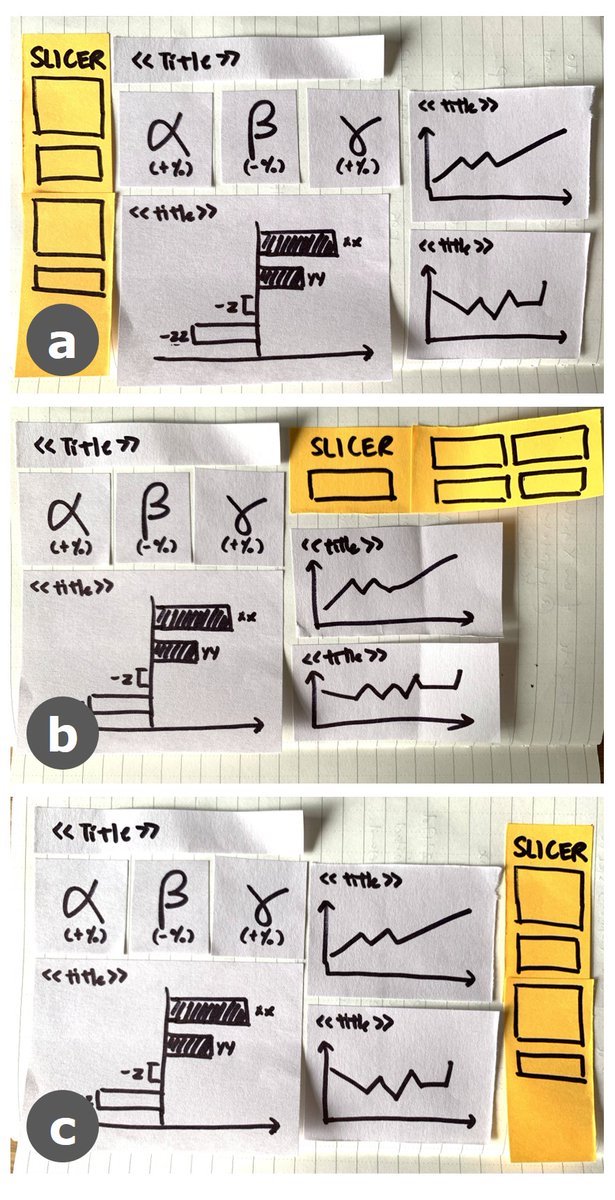
Where do you put #slicers in your #PowerBI #dashboards? And why? Here are 3 possible positions:
(a) Left vertical
(b) Top horizontal
(c) Right vertical
 https://abs.twimg.com/emoji/v2/... draggable="false" alt="👉🏼" title="Rückhand Zeigefinger nach rechts (mittelheller Hautton)" aria-label="Emoji: Rückhand Zeigefinger nach rechts (mittelheller Hautton)"> I recommend (c).
Here& #39;s why:
1/6
#dataviz #datavisualisation
(a) Left vertical
(b) Top horizontal
(c) Right vertical
Here& #39;s why:
1/6
#dataviz #datavisualisation
Our eyes usually traverse the screen left to right, top to bottom - we first see position (a), (b), then (c). Hence, the most important information should be at (a).
If we put slicers at (a) and (b), we are confronted with them once we open our dashboard.
2/6
#PowerBI #dataviz
If we put slicers at (a) and (b), we are confronted with them once we open our dashboard.
2/6
#PowerBI #dataviz
We are forced to consider what to do with them BEFORE even taking in the big picture of latest results.
By placing slicers at (c), we focus first on headline results and overall performance. AFTER we get the big picture,
3/6
#PowerBI #slicers #dataviz #datavisualisation
By placing slicers at (c), we focus first on headline results and overall performance. AFTER we get the big picture,
3/6
#PowerBI #slicers #dataviz #datavisualisation
we then use slicers to filter the data for further investigation.
I guess (a) and (b) are common as websites put navigation menus there. Landing on a page with intent, we use them to quickly get what we want. Hence, (a) and (b) make sense for websites.
4/6
#PowerBI #slicers
I guess (a) and (b) are common as websites put navigation menus there. Landing on a page with intent, we use them to quickly get what we want. Hence, (a) and (b) make sense for websites.
4/6
#PowerBI #slicers
But for #dashboards, I find it more important to show the latest big picture update first before fiddling with the finer details. Hence, (c) makes more sense to me.
How do you decide where to place your #slicers? Let me know!
5/6
#dataviz #datavisualisation #PowerBI
How do you decide where to place your #slicers? Let me know!
5/6
#dataviz #datavisualisation #PowerBI
P.S. Kudos @CharlesElwoodBI for sharing your #dashboard which got Ian Bowman, Kenneth Tyler, and I mulling over this!
6/6
6/6
Wow, this same thread blew up in LinkedIn. From the comments, I realised there are many other perspectives I haven’t considered in deciding What’s Important such as our end users’ background. (a), (b), and even more positions are possible!
 https://abs.twimg.com/emoji/v2/... draggable="false" alt="👉🏼" title="Rückhand Zeigefinger nach rechts (mittelheller Hautton)" aria-label="Emoji: Rückhand Zeigefinger nach rechts (mittelheller Hautton)"> https://www.linkedin.com/posts/graceteohwx_slicers-powerbi-dashboards-activity-6692287288346513408-6VAl
7/6">https://www.linkedin.com/posts/gra...
7/6">https://www.linkedin.com/posts/gra...

 Read on Twitter
 I recommend (c). Here& #39;s why:1/6 #dataviz #datavisualisation" title="Where do you put #slicers in your #PowerBI #dashboards? And why? Here are 3 possible positions:(a) Left vertical(b) Top horizontal(c) Right verticalhttps://abs.twimg.com/emoji/v2/... draggable="false" alt="👉🏼" title="Rückhand Zeigefinger nach rechts (mittelheller Hautton)" aria-label="Emoji: Rückhand Zeigefinger nach rechts (mittelheller Hautton)"> I recommend (c). Here& #39;s why:1/6 #dataviz #datavisualisation" class="img-responsive" style="max-width:100%;"/>


