I& #39;m tuning into a presentation on the impact of COVID-19 in North Carolina by @UNCPublicPolicy graduates + students. They are sharing data related to COVID-19& #39;s impact on the economy, education, and more.
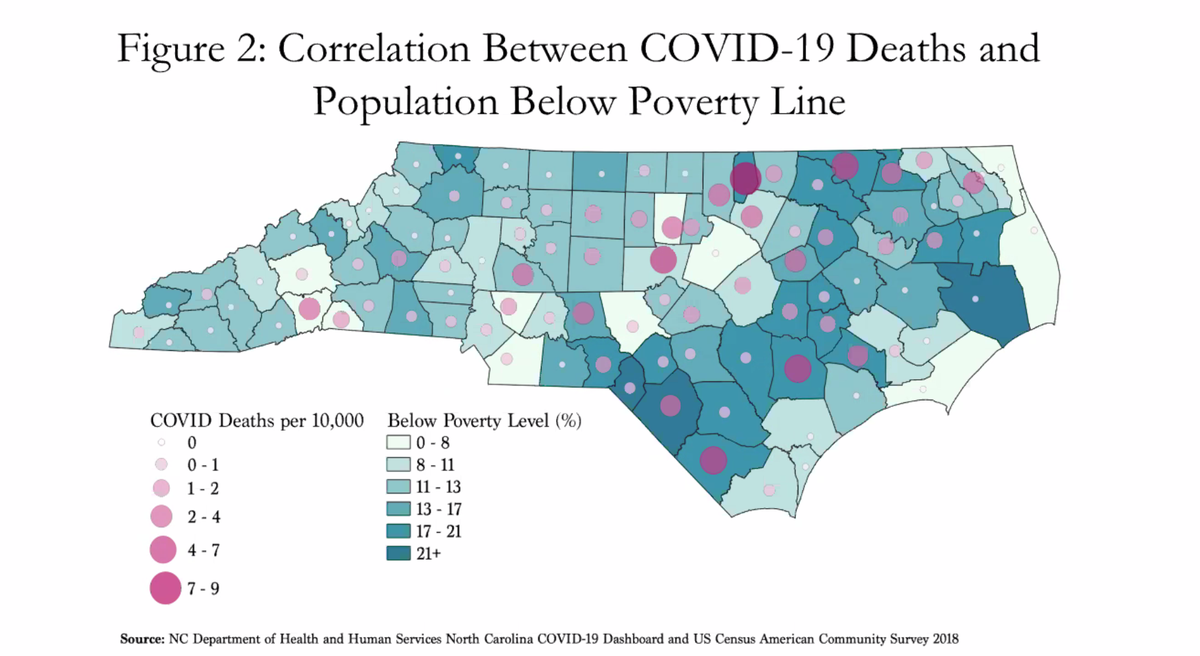
The @UNCPublicPolicy health team found a strong correlation between deaths from COVID-19 and the percent of the population in the county that is below the poverty line.
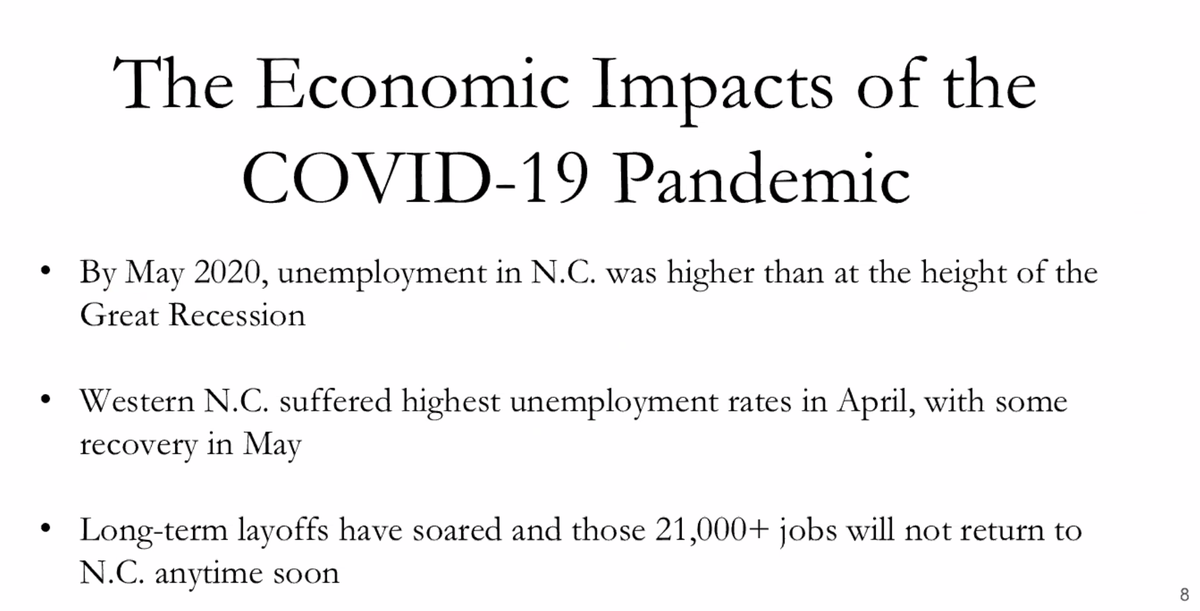
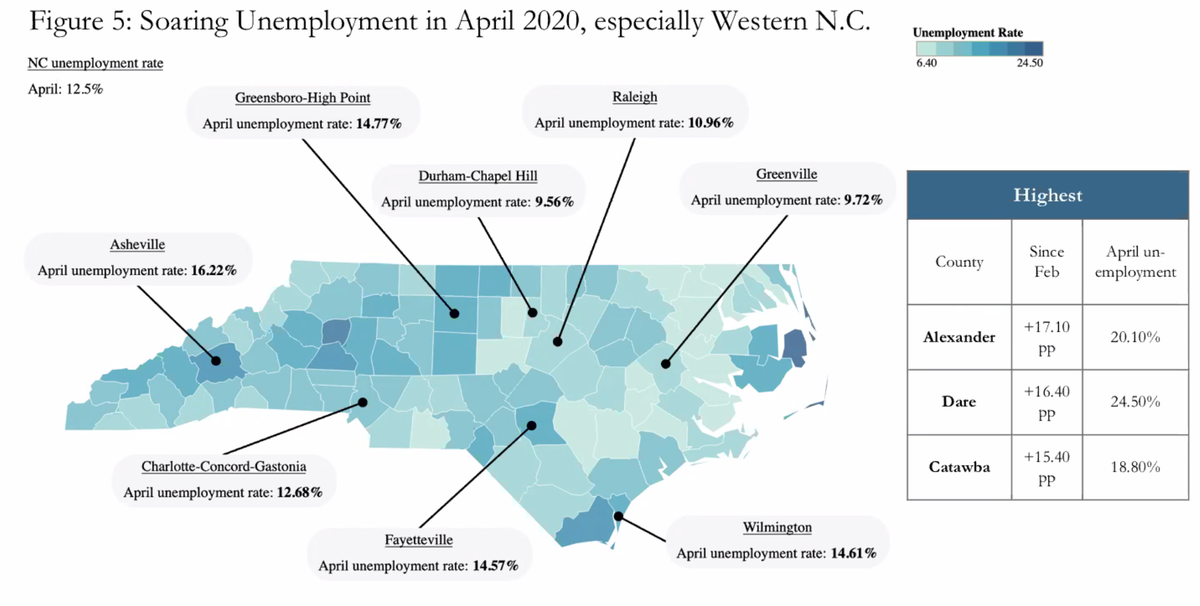
The economic team& #39;s takeaways include that western North Carolina had the highest unemployment rates in April, with some recovery in May. Highest change in unemployment from February to April: Alexander, Dare, and Catawba.
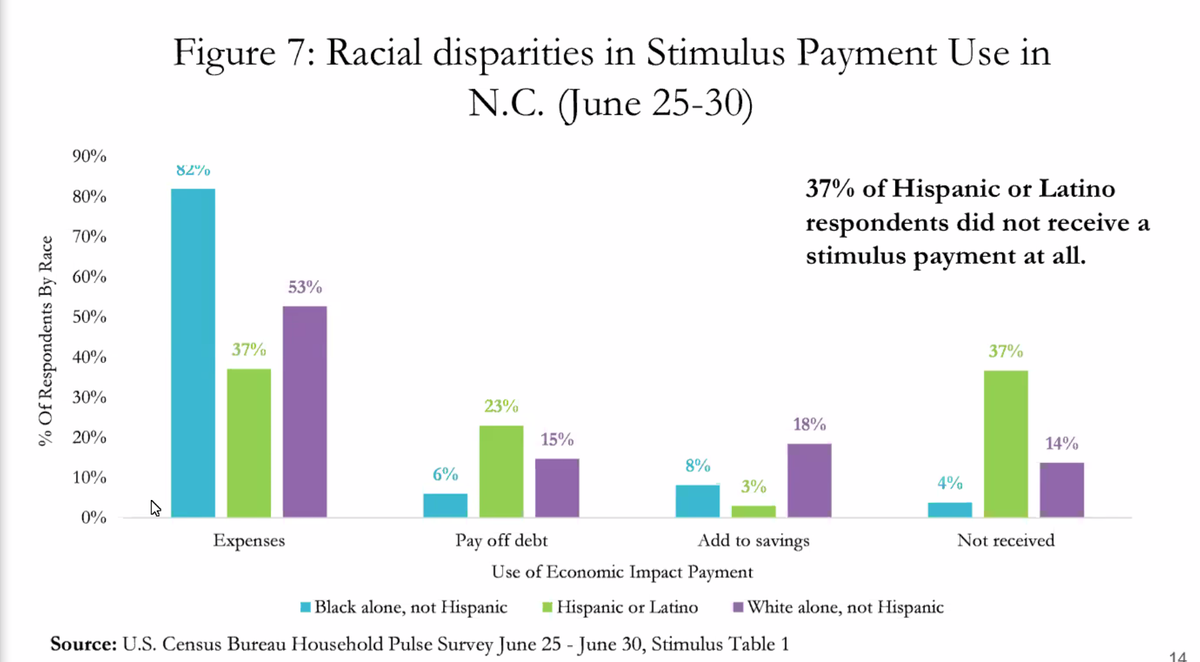
Most North Carolinians used their stimulus payment for expenses, but disparities exist between racial groups. 37% of Hispanic/Latino respondents did not receive a stimulus payment at all.
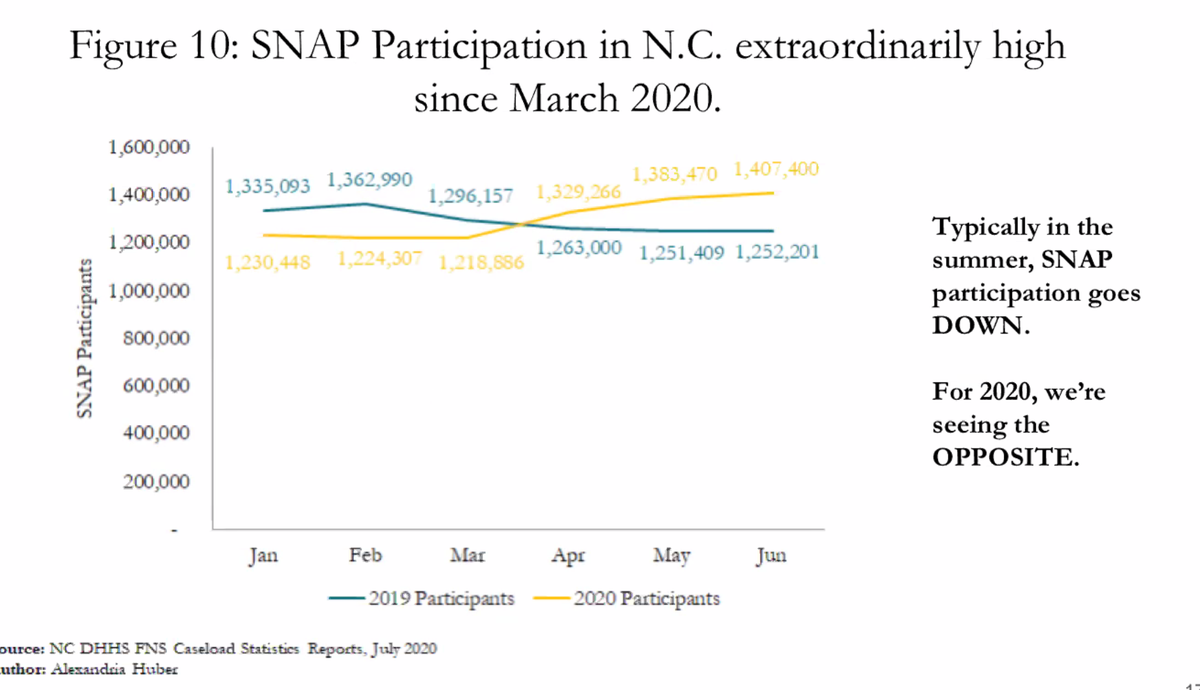
While SNAP participation usually goes down in the summer, the trend for the summer of 2020 is the opposite. NC SNAP participation has been increasing since March 2020.
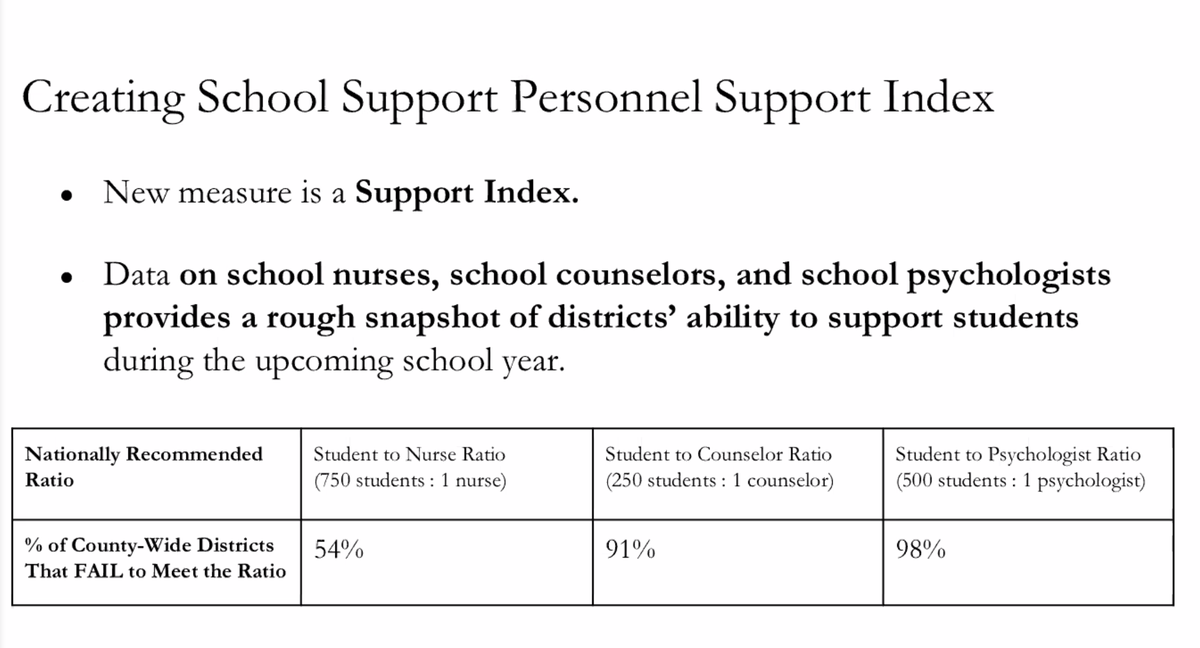
The @UNCPublicPolicy ed team created a support index that combines data on K-12 school nurses, counselors, and psychologists. More than half of districts fail to meet the nationally recommended student-to-nurse ratio, and 90%+ fail to meet ratios for counselors & psychologists.
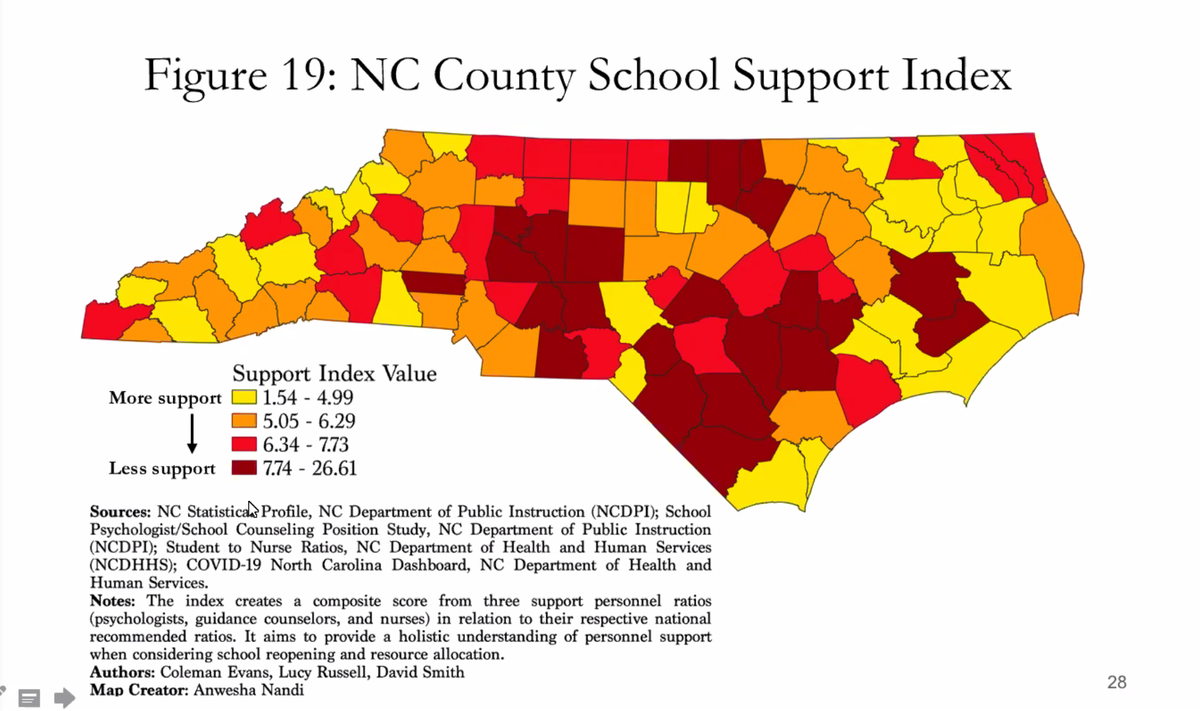
Districts with a lower score have more personnel support (yellow), and districts with a higher score have fewer support personnel (dark red). This map is only for the 100 county-wide LEAs. #nced #eddata @UNCPublicPolicy

 Read on Twitter