When is a #COVID19 trend real or not?
If real, do we need to reimpose restrictions in area X?
Answering this is not easy especially when a wrong answer leads to false positive & false negative consequences.
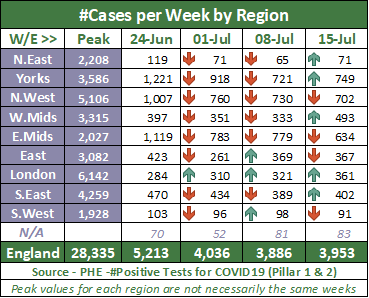
This thread was prompted after I updated this table.
1/10
If real, do we need to reimpose restrictions in area X?
Answering this is not easy especially when a wrong answer leads to false positive & false negative consequences.
This thread was prompted after I updated this table.
1/10
1st thing I noticed was London. Cases increased in each of the last 3 weeks.
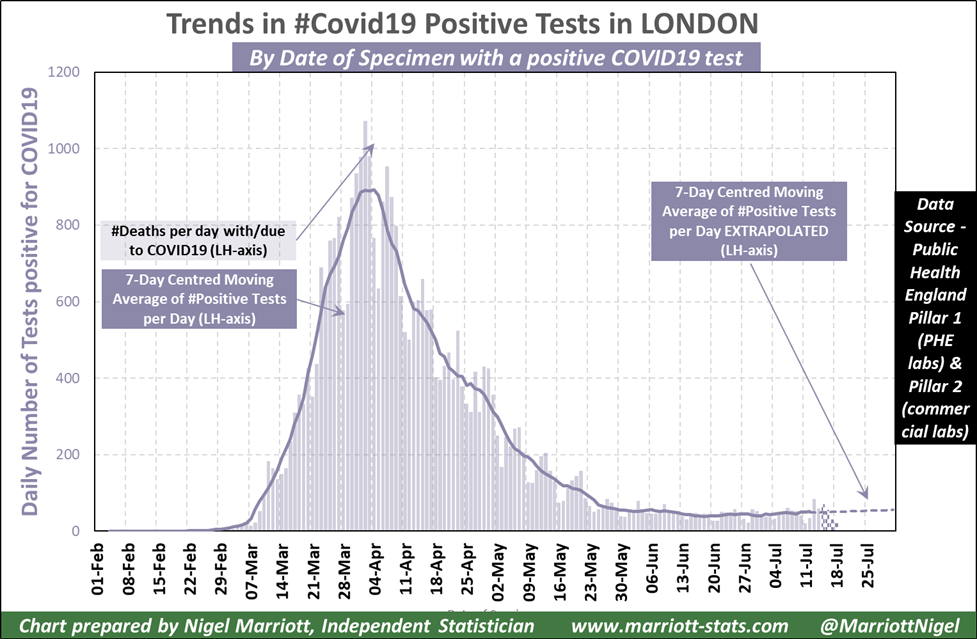
Daily chart shows a steady increase but the rate is slow. Extrapolating to end of the year gives 210 +ve tests per day, well down on peak when testing capacity was less.
No lockdown is imminent ... /2
Daily chart shows a steady increase but the rate is slow. Extrapolating to end of the year gives 210 +ve tests per day, well down on peak when testing capacity was less.
No lockdown is imminent ... /2
... & a nudge of some kind could still turn this trend downwards.
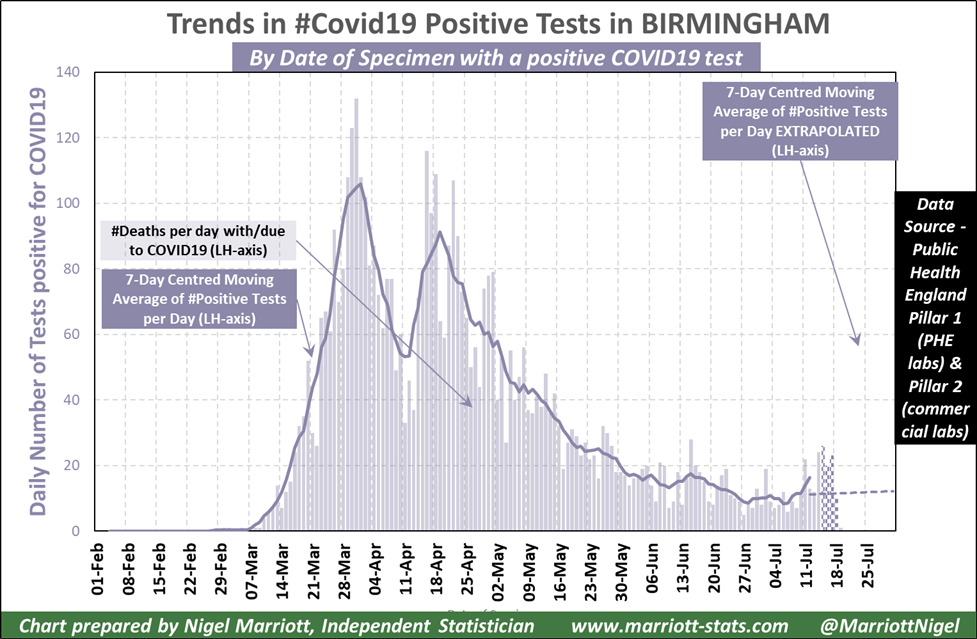
How about Birmingham?
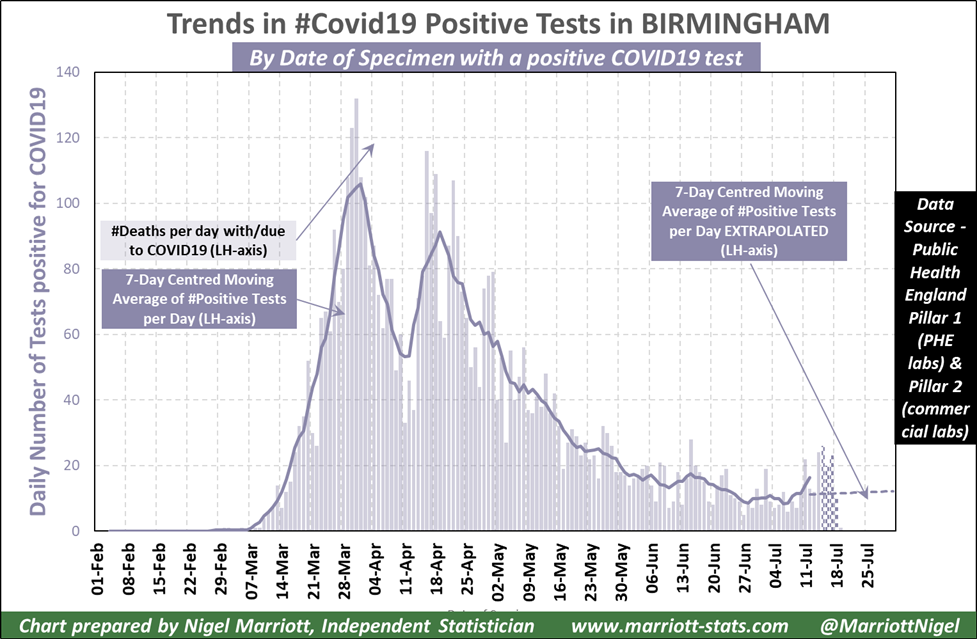
Moving average has turned upwards & extrapolation is for slow increase. Concern here is the last 4 days which have a patterned shade to show that data is incomplete and will be ... /3
How about Birmingham?
Moving average has turned upwards & extrapolation is for slow increase. Concern here is the last 4 days which have a patterned shade to show that data is incomplete and will be ... /3
... revised upwards. Remember chart is based on date specimen was taken but given turnaround times for testing & reporting, the last 5 days of the time series can & do get revised upwards sometimes by considerable amounts.
I& #39;d be much more concerned about Birmingham than ... /4
I& #39;d be much more concerned about Birmingham than ... /4
... London but if the spike can be traced to a single source, there is an opportunity to nip it in the bud and isolate those who had come into contact with those without affecting the wider population.
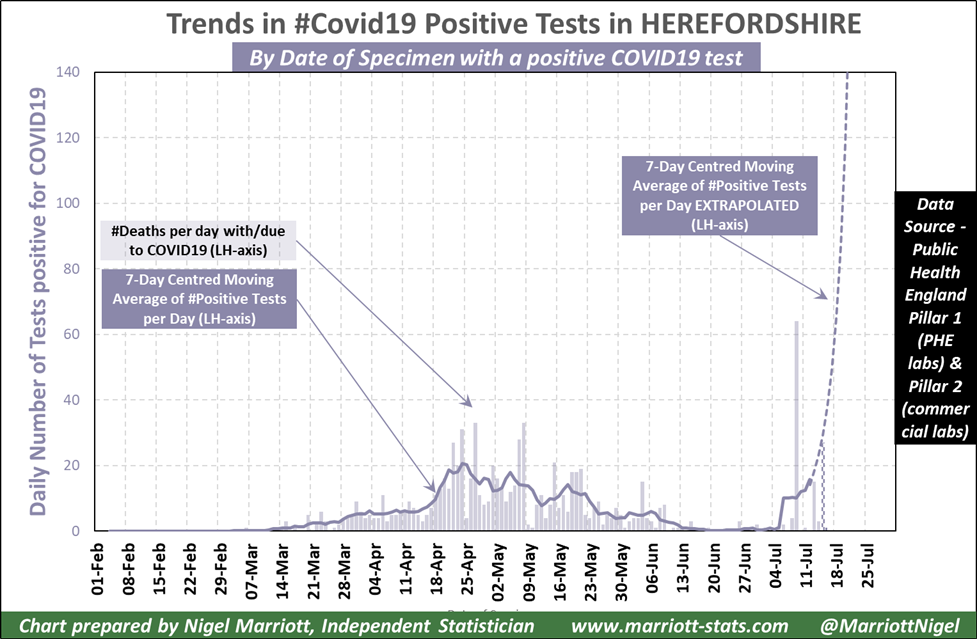
We recently had an example of this with a farm in Herefordshire where a .../5
We recently had an example of this with a farm in Herefordshire where a .../5
... sent the extrapolation into orbit. Chances are that this outbreak will be brought under control given that it is a rural area where social isolation is easier to practice.
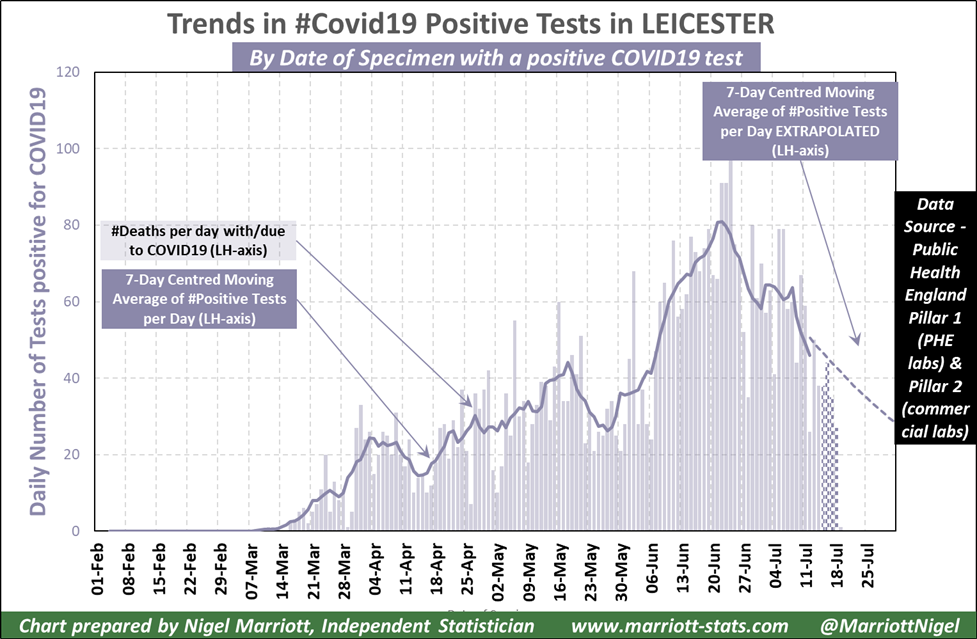
Do we know how easy it is to bring outbreaks under control? Leicester was the first area to go .../6
Do we know how easy it is to bring outbreaks under control? Leicester was the first area to go .../6
... under renewed restrictions. In that instance, we were slow to realise that the trend was still upwards there because @PHE_uk were not publishing pillar 2 cases. It would appear though the turning point came before the new lockdown so I don& #39;t think we can conclude ... /7
... we have proven our ability to stop outbreaks.
The 4 areas I& #39;ve shown give us a flavour of what to look for when analysing #covid19 trends. An upward trend is not enough. The speed of the trend is also important but a very rapid increase might indicate an outbreak .../8
The 4 areas I& #39;ve shown give us a flavour of what to look for when analysing #covid19 trends. An upward trend is not enough. The speed of the trend is also important but a very rapid increase might indicate an outbreak .../8
... which can be isolated rather than a general spread which will require reimposition of lockdown.
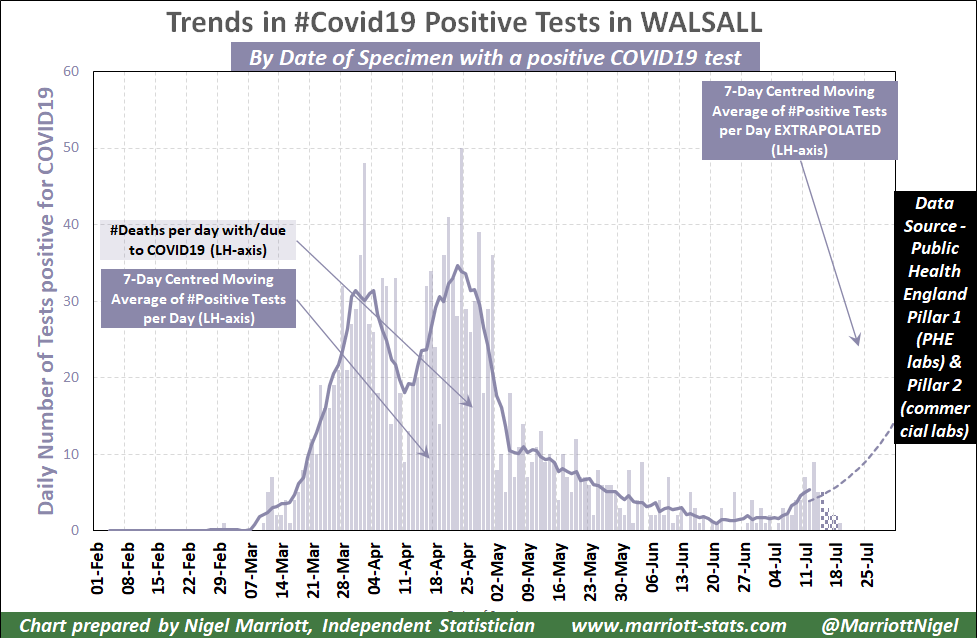
One way to decide if a possible outbreak is more general than localised is if an area& #39;s neighbour is seeing a similar trend. Let& #39;s look at Walsall, next door to Birmingham. /8
One way to decide if a possible outbreak is more general than localised is if an area& #39;s neighbour is seeing a similar trend. Let& #39;s look at Walsall, next door to Birmingham. /8
That looks quite similar to Birmingham doesn& #39;t it?
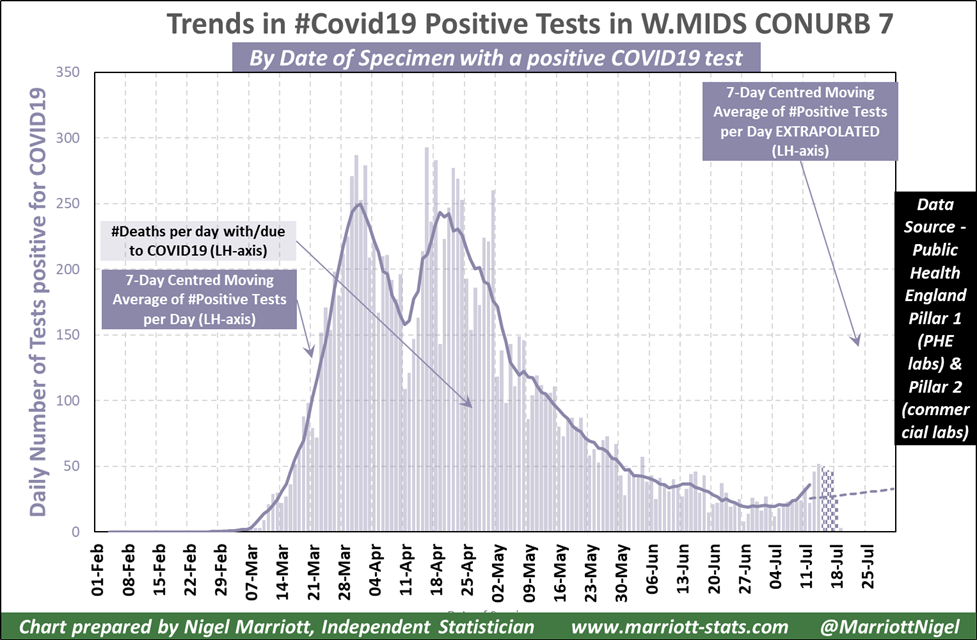
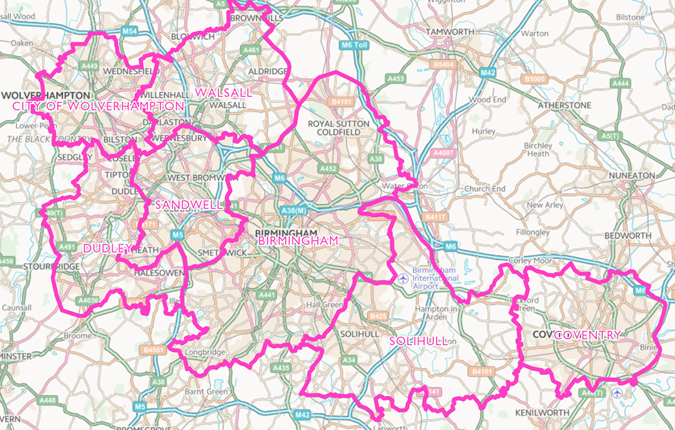
In fact I see same thing for each council of the West Midlands conurbation area (the 7 metropolitan councils of Birmingham, Walsall, Wolverhampton, Sandwell, Dudley, Solihull & Coventry)
Are Lockdowns returning here? /9
In fact I see same thing for each council of the West Midlands conurbation area (the 7 metropolitan councils of Birmingham, Walsall, Wolverhampton, Sandwell, Dudley, Solihull & Coventry)
Are Lockdowns returning here? /9
All charts here come from a spreadsheet available on my blog here. You will need to update the file for the last few days but instructions are given in the HELP sheet.
https://marriott-stats.com/nigels-blog/covid19-cases-latest-data-england/
I& #39;m">https://marriott-stats.com/nigels-bl... happy to add a few charts to this thread so let me know which area you want. /end
https://marriott-stats.com/nigels-blog/covid19-cases-latest-data-england/
I& #39;m">https://marriott-stats.com/nigels-bl... happy to add a few charts to this thread so let me know which area you want. /end

 Read on Twitter