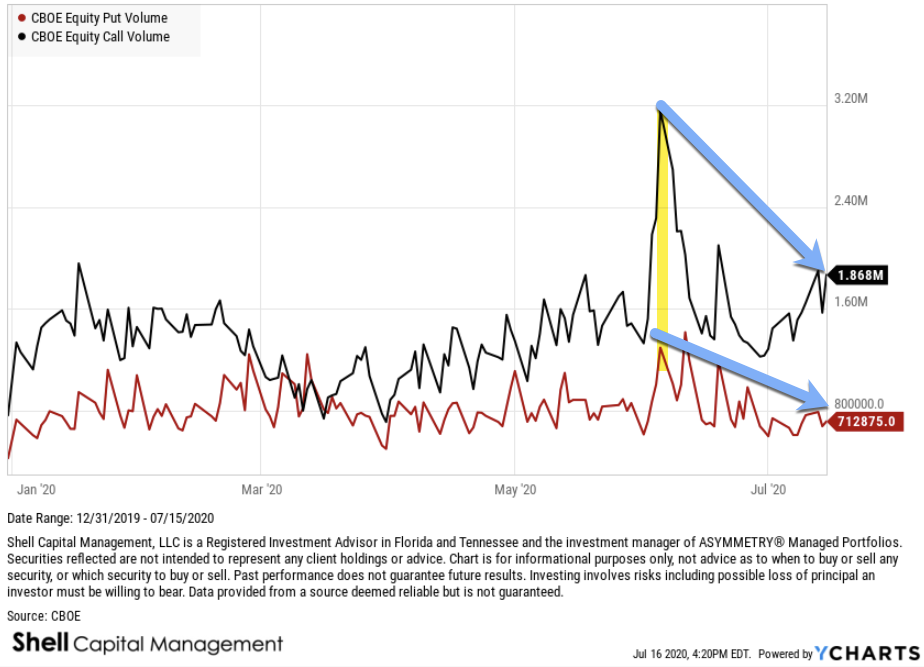
1) Lot& #39;s of talk about the CBOE Equity Put/Call Ratio reaching an extreme low, but...
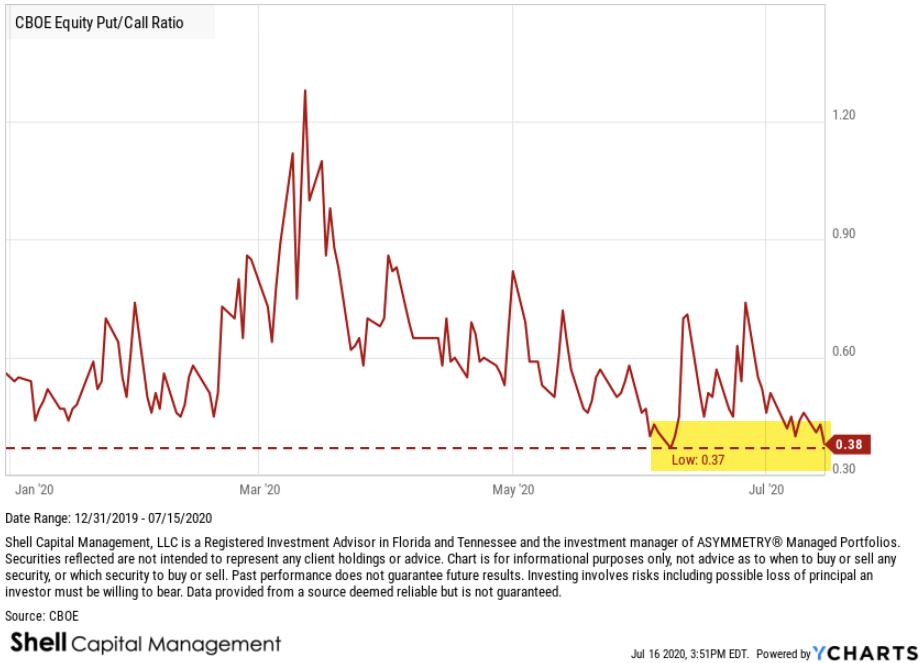
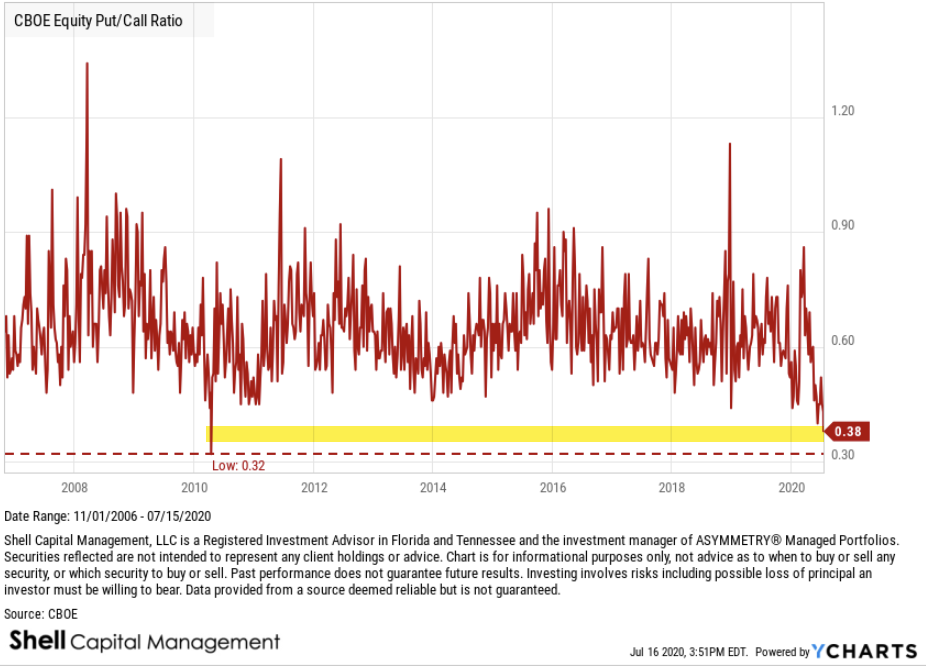
2) Yes, indeed, the CBOE Equity Put/Call Ratio reaching an extremely low level. In fact, it& #39;s as low as it has ever been going back to 2006.
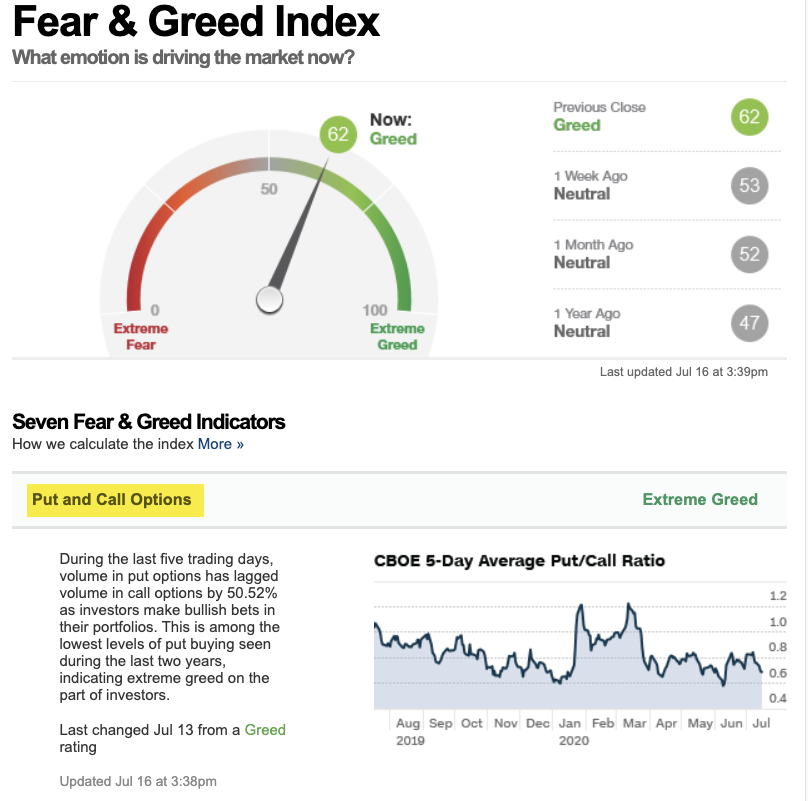
3) Normally, we consider such a low level to be an example of extreme complacency and GREED DRIVING THE MARKET. For example, the CBOE Equity Put/Call Ratio is the first of seven indicators used in the Fear & Greed Index.
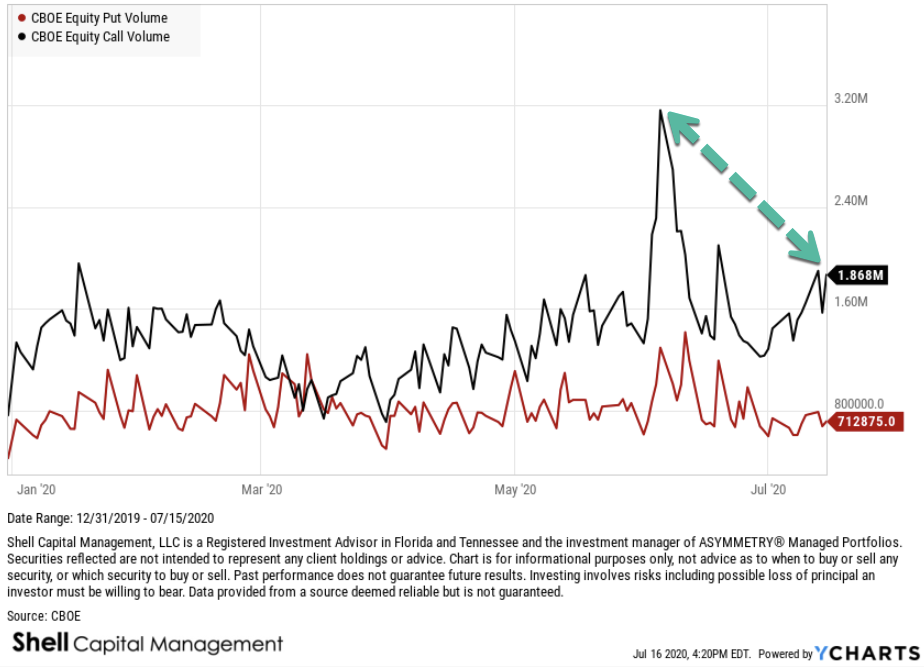
4) When the ratio is trending down and at a low level, it& #39;s because equity Call option volume is greater than the equity Put option volume. When there& #39;s more trading volume in equity calls, we assume options traders buying speculative calls, so they are bullish. VERY bullish now.
5) When the market is so one-sidedly bullish, it& #39;s a contrarian indicator suggesting over-enthusiasm. That is, we assume the calls are mostly speculative positions and puts are defensive, so the demand is on the long side. It& #39;s an imperfect assumption, but I generally agree.
6) I pointed out a similar extreme read out early June, when Call Volume spiked up to a historically high level. Indeed, the stock market had a -6% down day afterward. This time is a little different, and the chart shows why. Call volume isn& #39;t nearly as high, relatively speaking.
7) Call volume isn& #39;t as high as it was in June, but put volume is also lower. So, the ratio is at the same low level at 0.38, but the absolute volume is different. It& #39;s still probably an indication of enthusiasm and complacency, but it may not have the delta it had last time.
and if you liked this one, you& #39;ll love the next: https://twitter.com/MikeWShell/status/1283871872287936513">https://twitter.com/MikeWShel...
@SoberLook  https://abs.twimg.com/emoji/v2/... draggable="false" alt="☝🏼" title="Zeigefinger nach oben (mittelheller Hautton)" aria-label="Emoji: Zeigefinger nach oben (mittelheller Hautton)">

 Read on Twitter