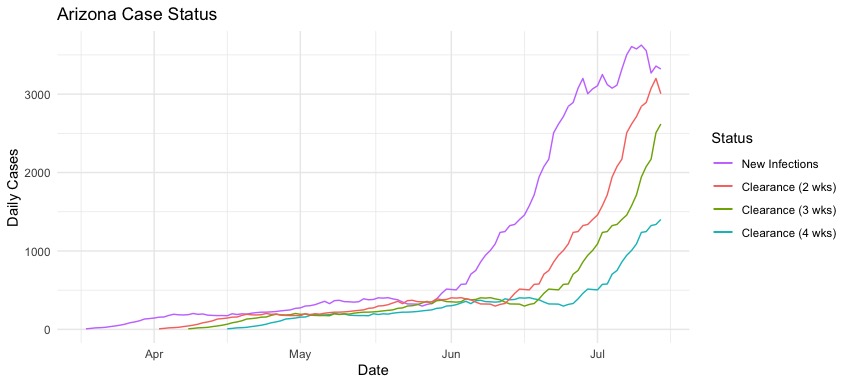
We& #39;ve talked about this before, but the Rt estimated for Arizona by the generative algorithm on http://rt.live"> http://rt.live does not pass the sanity test right now. You may already know the details, but perhaps it will be helpful for some people if I walk through why. https://twitter.com/TheTucsonHeat/status/1283793209420689408">https://twitter.com/TheTucson...
The engine behind the growth of an epidemic is the number of infectious cases circulating in a population. When the number of infectious cases increases, that is bad for two reasons:
1. More people are sick
2. More people are able to transmit the virus.
(2/N)
1. More people are sick
2. More people are able to transmit the virus.
(2/N)
If you want to get an epidemic under control, the number of infectious cases circulating in the population has to decrease. This means, each day, more people have to clear the virus (or be isolated, or die) than get the virus.
(3/N)
(3/N)
To understand where AZ’s epidemic is, you need to look at the balance between the number of people getting the virus and the number of people clearing the virus. So, imagine we have good test coverage and good turn around time. We don’t, but pretend like we do.
(4/N)
(4/N)
In that scenario, we can look at a given day and say, ok, we have 3000 new cases, but 2500 cases that used to be infectious have been removed from the population (either are no longer shedding active virus, they’ve been isolated, or they died).
(5/N)
(5/N)
If more cases enter the pool of infectious cases than leave it, the epidemic is expanding (this corresponds to an Rt of > 1). If more leave than enter, the epidemic is contracting (this corresponds to an Rt of < 1).
(6/N)
(6/N)
A quick and dirty estimate of the number of cases leaving the pool is the number of new cases identified at some time in the past. You don& #39;t necessarily recover from COVID19 very quickly, but we have reasonable data to suggest viral load drops off at some point around 28 days.
So, a sanity check on an Rt estimate would compare new cases to new cases in the past (who have presumably cleared the virus). If Rt < 1, the curve for new cases should be lower than the curve for cleared cases.
(8/N)
(8/N)
Even looking at a hopeful scenario where the average case clears in 2 weeks, reported daily cases are higher than estimated cleared cases.
(9/N)
(9/N)

 Read on Twitter


