1/ Covid ( @UCSF) Chronicles, Day 120
Not a full-fledged thread tonite, but the numbers are changing quickly enough @UCSF, in SF, and in CA (and concerning enough) that I thought I& #39;d update them for folks who are following closely...
Not a full-fledged thread tonite, but the numbers are changing quickly enough @UCSF, in SF, and in CA (and concerning enough) that I thought I& #39;d update them for folks who are following closely...
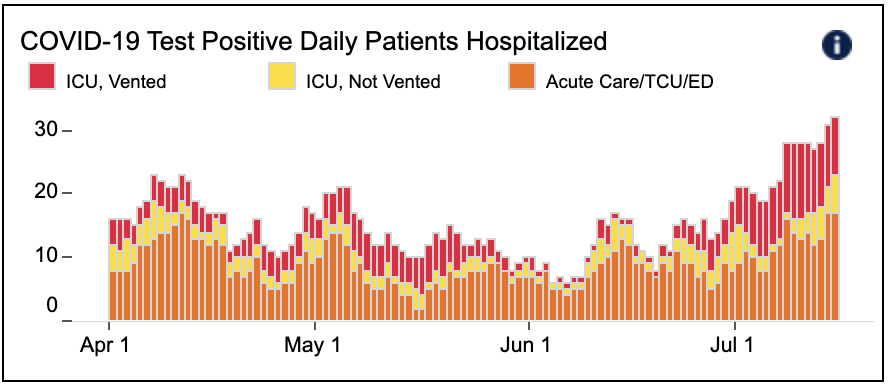
2/ @ucsfhospitals, we& #39;re at 30 patients, 15 in ICU, 9 intubated (Fig). 30 is higher than our previous peak in mid-April. It& #39;s not straining our capacity...but we have re-uped our Command Center. A few from elsewhere (4 from San Quentin) but mostly home-grown. Worrisome trend.
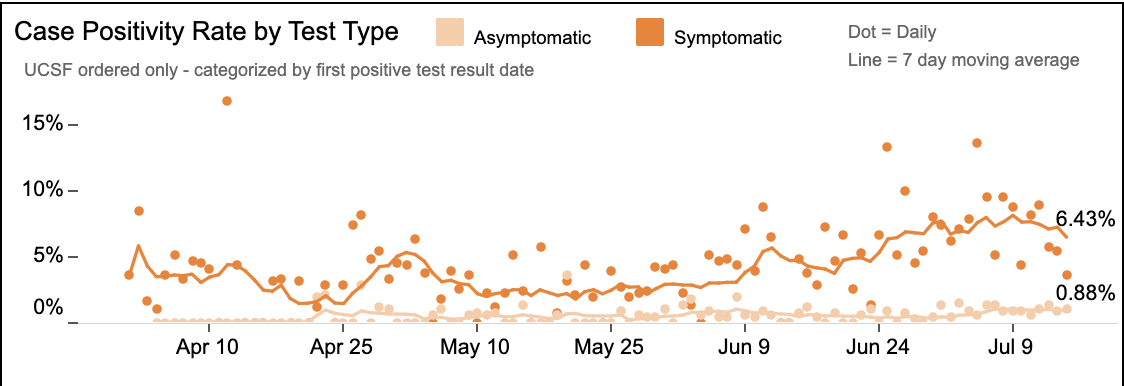
3/ Also @ucsfhospitals: test positivity rate is ~2% overall; 6.4% in pts w/ Covid symptoms; 0.9 in pts w/ no symptoms. Both a bit lower than last wk, but 2x last mth& #39;s %s. As I said before, I follow asymptomatic % as rough guide to chance that avg person in SF has active virus.
4/ So takeaway from @UCSF& #39;s numbers: hospitalizations up significantly, test positivity rate stable – might mean that we& #39;re nearing peak. Sadly, we had one new death, our first in several weeks. Still a total of only 8 deaths for entire pandemic, which is remarkably low.
5/ Contrast w/ #& #39;s I got from friend at a large Houston hospital (900 beds, a bit larger than @UCSF): ~280 Covid pts in hospital, 60 in ICU; nearing NYC-in-April levels. The term "surge" requires a little granularity: we& #39;re both having surges, but that& #39;s overwhelming, ours isn& #39;t.
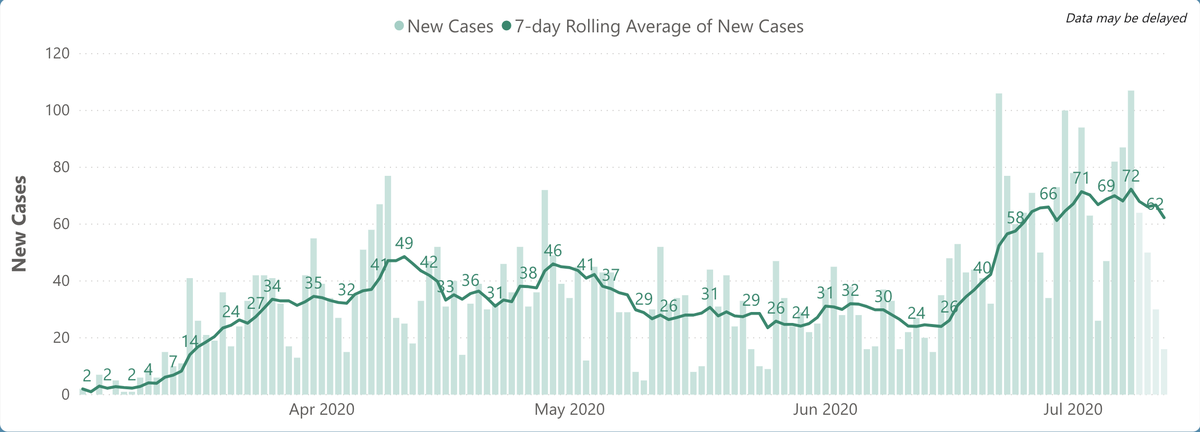
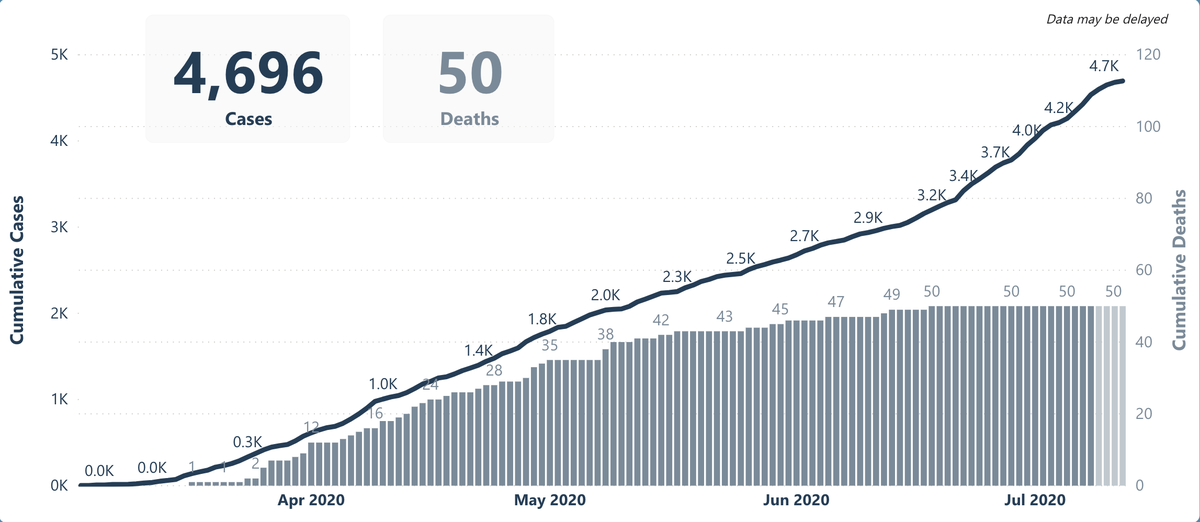
6/ On to SF: cases on L, rolling average of 62/day. Plateaued, maybe downtrending a bit, but still 2.5x last mth& #39;s. Fig R: total cases & deaths – astoundingly, death # (50) hadn& #39;t budged since June 16. But as I said, 1 new death @ucsf, which will show up in SF count soon (a lag).
7/ The small # of SF deaths is remarkable. Likely a combo of great care, impact of remdesivir & dexamethasone, younger pts (though still sick enough to be in hospital), and, importantly, hospitals that aren& #39;t overwhelmed. Don& #39;t expect this mortality rate in Houston, PHX or Miami.
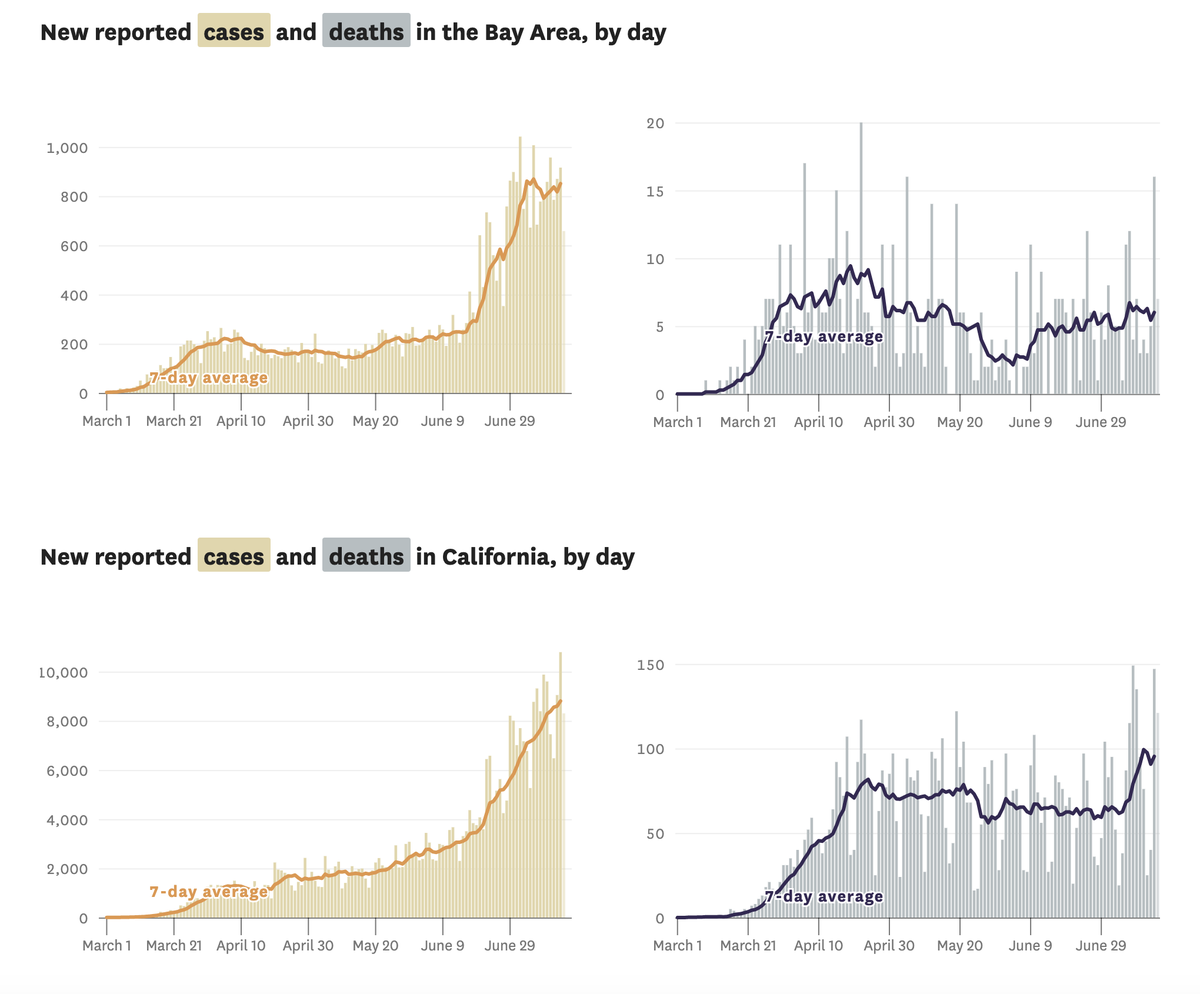
8/ Fig below shows Bay Area (SF & adding other counties), which shows bump but now plateau in cases & deaths. Contrast CA, below, with ongoing surges in cases/deaths. Throughout pandemic, Bay Area has done better than rest of CA; hoping that entire state will turn around soon.
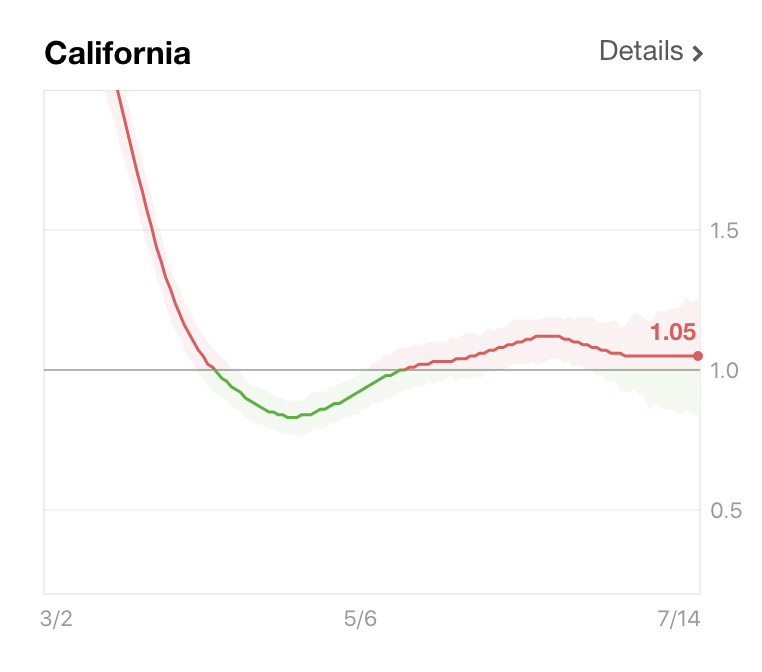
9/ A bit of a hopeful sign for CA, from http://rt.live"> http://rt.live , which shows mild downtrend in the effective reproductive rate, now 1.05. Remember the drill: when that number goes below 1 (as it used to be in CA), each person gives virus to fewer than one other, and cases fall.
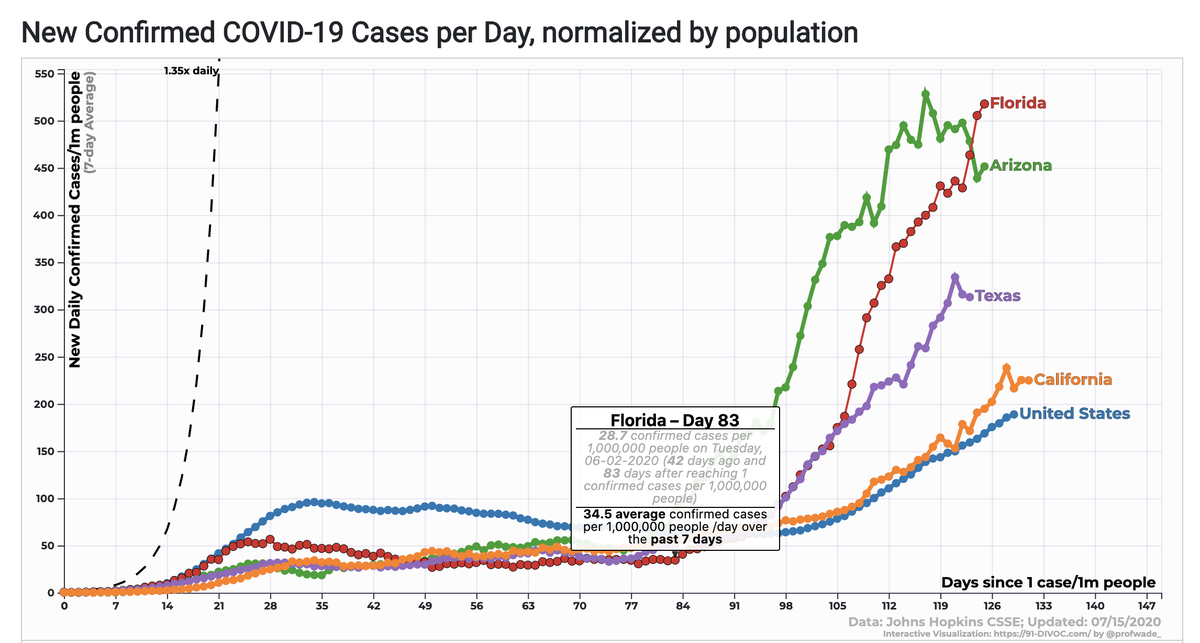
10/ Finally, just as "surge" wrongly implies equivalence of SF& #39;s situation vs that of Houston, PHX, Miami, saying "CA is surging" implies equivalence w/ other surging states. Not so: the massive surges in FL & AZ are truly overwhelming; TX a bit less so. CA is bad, but not that.

 Read on Twitter