"Some countries have been hit hard 2020, some not."
A follow up Thread.
A key issue during the SARS-CoV-2 pandemic is obviously how to protect vulnerables.
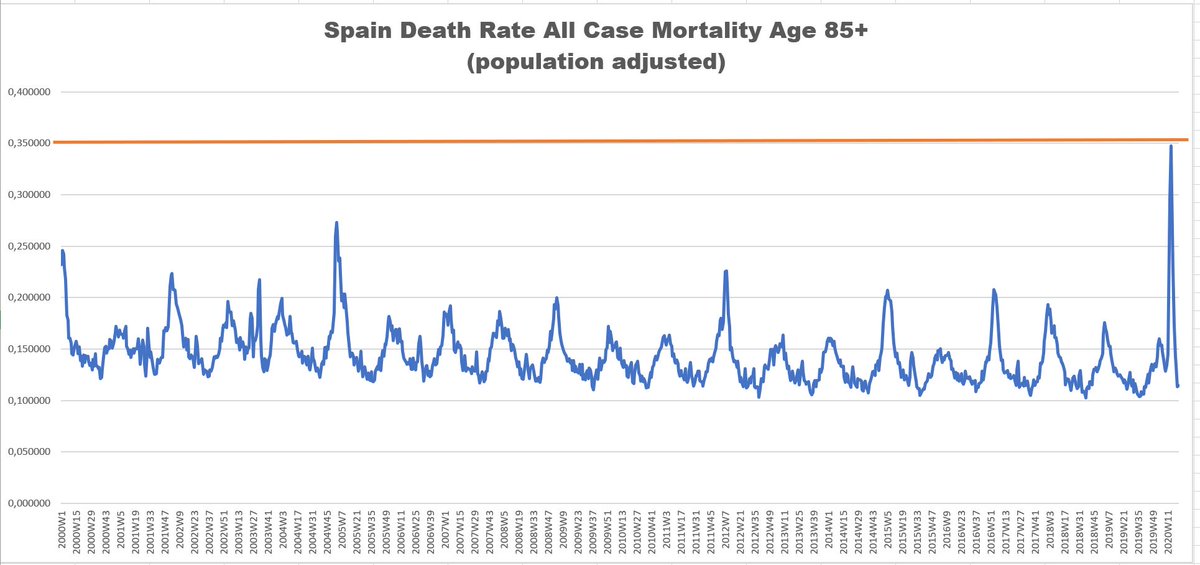
Let& #39;s do some deep dive into the age group 85+
The first I& #39;ve seen this chart the first time I couldn& #39;t believe it.
A follow up Thread.
A key issue during the SARS-CoV-2 pandemic is obviously how to protect vulnerables.
Let& #39;s do some deep dive into the age group 85+
The first I& #39;ve seen this chart the first time I couldn& #39;t believe it.
(2)
Are the numbers wrong?
The first chart was "death rate", hence it is population adjusted.
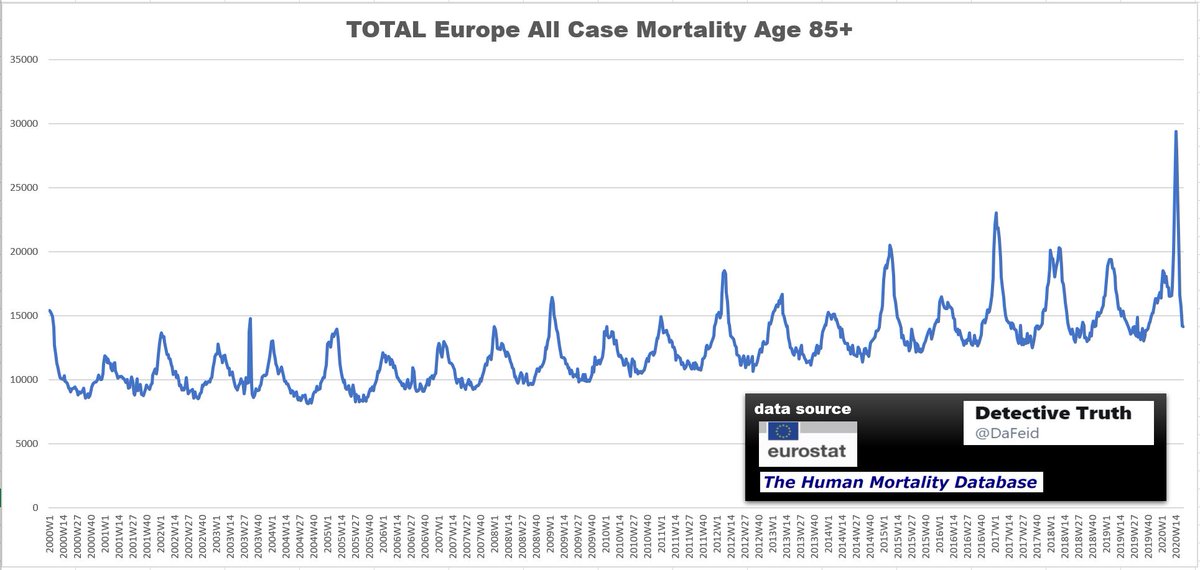
Lets have a look into total numbers.
This looks more reliable as there is a problem 2020, right?
Are the numbers wrong?
The first chart was "death rate", hence it is population adjusted.
Lets have a look into total numbers.
This looks more reliable as there is a problem 2020, right?
(4)
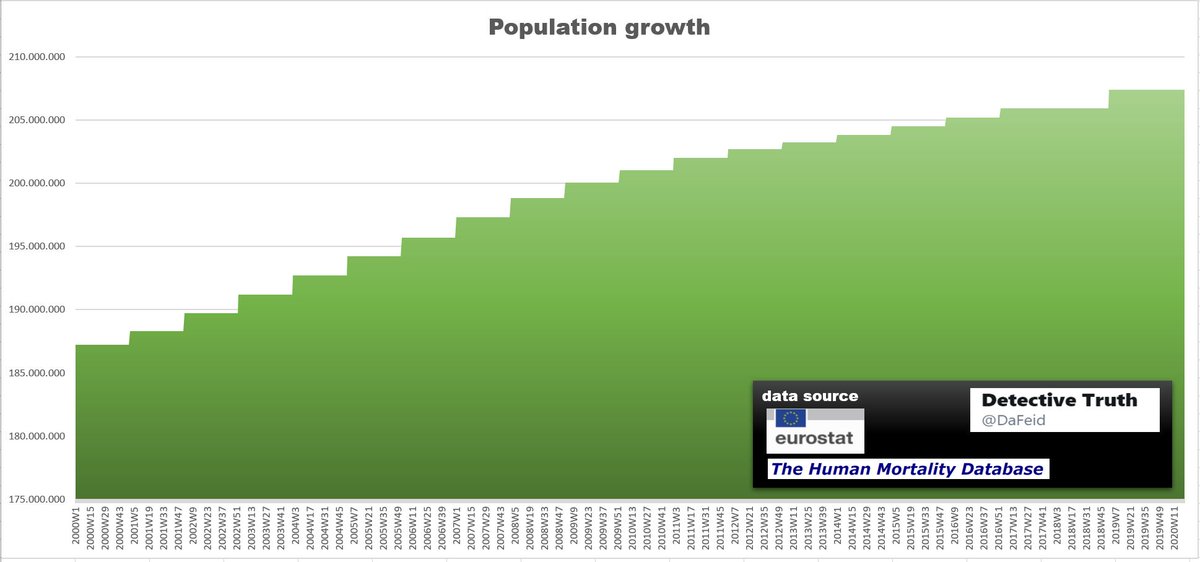
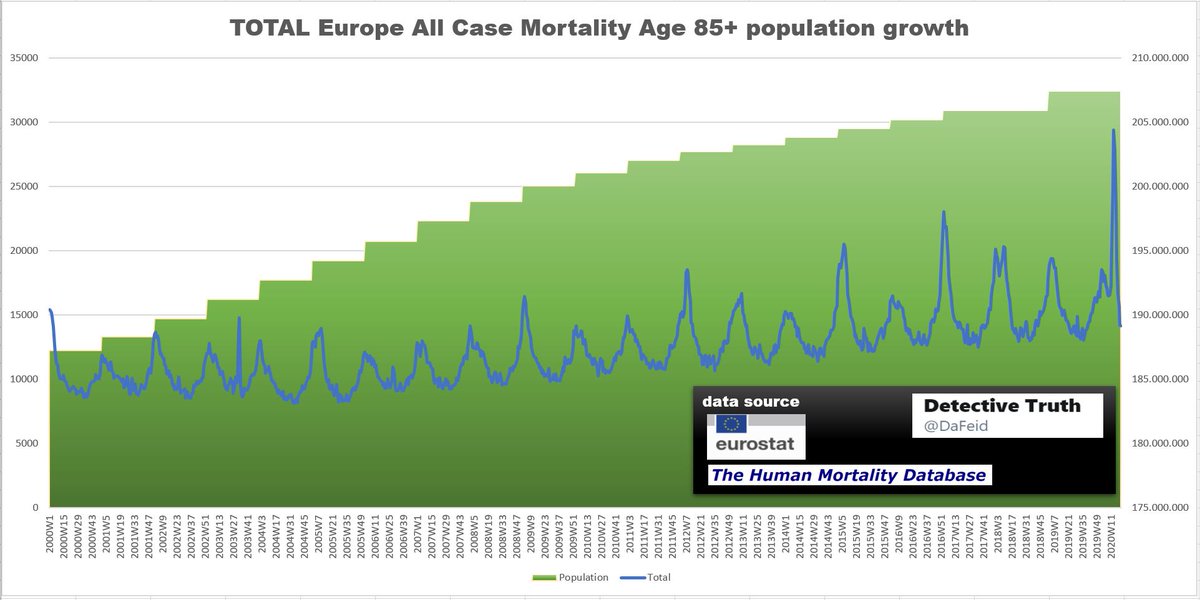
Now, lets compare the total deaths vs. population growth and it gets clearer.
Keep in mind:
Growth of life excpectancy is not even considered!
Now, lets compare the total deaths vs. population growth and it gets clearer.
Keep in mind:
Growth of life excpectancy is not even considered!
(5)
Why to compare european countries instead of single countries?
Single countries may be missleading, as an example
Spain vs. Portugal.
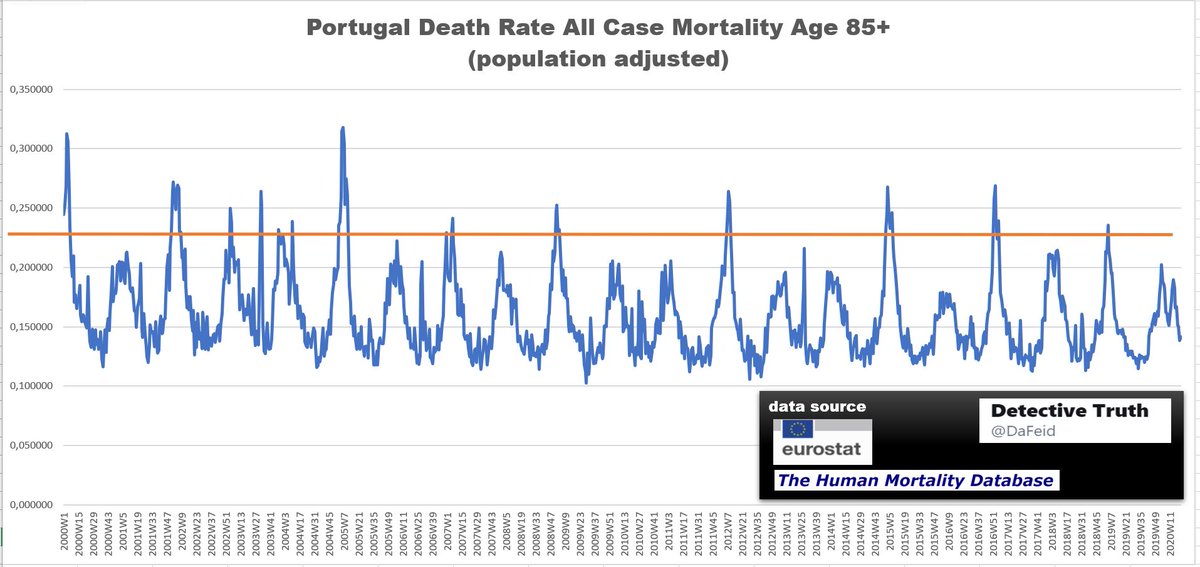
Portugal:
Why to compare european countries instead of single countries?
Single countries may be missleading, as an example
Spain vs. Portugal.
Portugal:
(7)
My own conclusion:
This pandemic is obviously challenging ethical principles!
Deaths rates hits the line of 2001 again.
2000 was even worse than 2020 !
What has changed during the last 20 years?
Population and life exectancy... and viruses, of course.
My own conclusion:
This pandemic is obviously challenging ethical principles!
Deaths rates hits the line of 2001 again.
2000 was even worse than 2020 !
What has changed during the last 20 years?
Population and life exectancy... and viruses, of course.
(8)
Countries included (full data since 2000):
Austria
Belgium
Switzerland
Spain
Finland
France
Hungary
Netherlands
Norway
Portugal
Sweden
Data source:
Eurostat and http://mortality.org"> http://mortality.org
Countries included (full data since 2000):
Austria
Belgium
Switzerland
Spain
Finland
France
Hungary
Netherlands
Norway
Portugal
Sweden
Data source:
Eurostat and http://mortality.org"> http://mortality.org
Typo in (3).
It must be 2000 instead 2010.
Chart is correct.
It must be 2000 instead 2010.
Chart is correct.
(9)
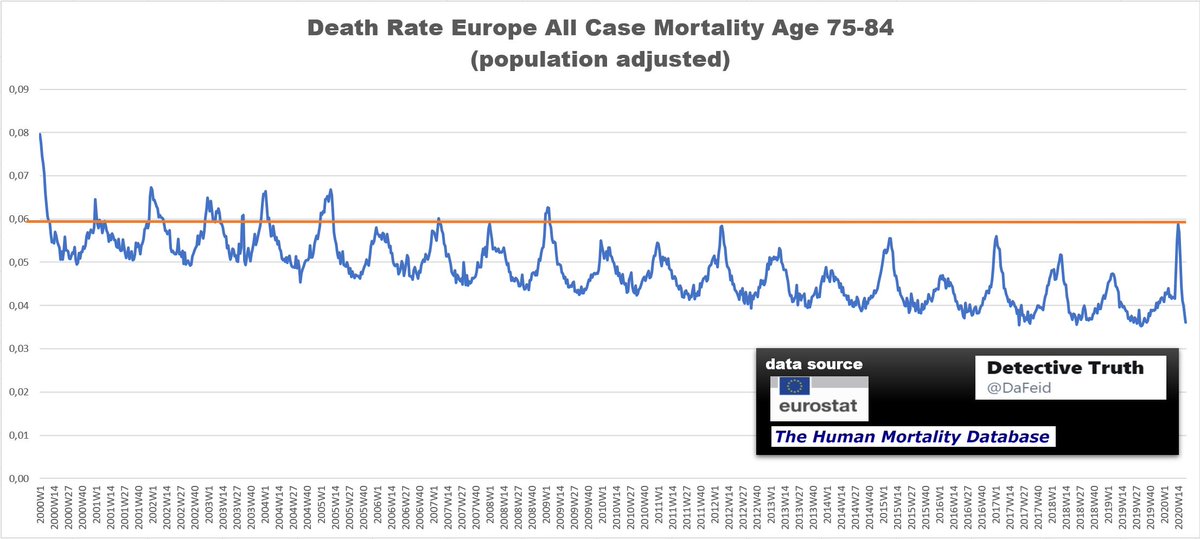
I thought age group > 85 may be not representative enough I did the same analysis for age group 75-84
All charts are per week, either rate based on population...:
(look at many years 15-20 years ago!)
I thought age group > 85 may be not representative enough I did the same analysis for age group 75-84
All charts are per week, either rate based on population...:
(look at many years 15-20 years ago!)
(10)
...or based on total numbers.
Again: What is this pandemic about?
Isn& #39;t it just a natural effect?
I am sorry for that question!!!
...or based on total numbers.
Again: What is this pandemic about?
Isn& #39;t it just a natural effect?
I am sorry for that question!!!

 Read on Twitter
