Let& #39;s look at England & Wales all cause deaths back until 1953.
In the last 68 years, 51 have had more deaths than in 2020.
There is a noticeable increase in deaths for 2020 but note the slight upward trend in recent years.
1/n
In the last 68 years, 51 have had more deaths than in 2020.
There is a noticeable increase in deaths for 2020 but note the slight upward trend in recent years.
1/n
2/n
If we rank the 68 years of data by number of adjusted deaths, 2020 has the 17th fewest - its in the bottom 25% of total deaths.
Of course healthcare has improved over time but it does put into perspective how lucky we are with the treatments available to us now.
If we rank the 68 years of data by number of adjusted deaths, 2020 has the 17th fewest - its in the bottom 25% of total deaths.
Of course healthcare has improved over time but it does put into perspective how lucky we are with the treatments available to us now.
3/n
Also note the drop in deaths in 2019.
A significant portion of covid-related excess mortality appears to be related to mild prior flu seasons accross the world. The Uk is no exception. https://twitter.com/Humble_Analysis/status/1277804862734925827?s=20">https://twitter.com/Humble_An...
Also note the drop in deaths in 2019.
A significant portion of covid-related excess mortality appears to be related to mild prior flu seasons accross the world. The Uk is no exception. https://twitter.com/Humble_Analysis/status/1277804862734925827?s=20">https://twitter.com/Humble_An...
4/n
The wonderful work by @HaraldofW on Sweden was what gave me the idea to look more closely at this. https://twitter.com/LearnLeapLean/status/1283122703503958016?s=20">https://twitter.com/LearnLeap...
The wonderful work by @HaraldofW on Sweden was what gave me the idea to look more closely at this. https://twitter.com/LearnLeapLean/status/1283122703503958016?s=20">https://twitter.com/LearnLeap...
5/n
Method:
The yearly data is adjusted for population changes.
For 2020 I& #39;ve taken weekly deaths up until week 26 and then the 5 year average deaths for the rest of the year
I think this is a reasonable to thing to given deaths have been below average for the last 3 weeks.
Method:
The yearly data is adjusted for population changes.
For 2020 I& #39;ve taken weekly deaths up until week 26 and then the 5 year average deaths for the rest of the year
I think this is a reasonable to thing to given deaths have been below average for the last 3 weeks.
6/n
The data is from the ONS.
https://www.ons.gov.uk/peoplepopulationandcommunity/populationandmigration/populationestimates/datasets/vitalstatisticspopulationandhealthreferencetables
https://www.ons.gov.uk/peoplepop... href=" https://www.ons.gov.uk/peoplepopulationandcommunity/birthsdeathsandmarriages/deaths/datasets/weeklyprovisionalfiguresondeathsregisteredinenglandandwales">https://www.ons.gov.uk/peoplepop...
The data is from the ONS.
https://www.ons.gov.uk/peoplepopulationandcommunity/populationandmigration/populationestimates/datasets/vitalstatisticspopulationandhealthreferencetables
7/n
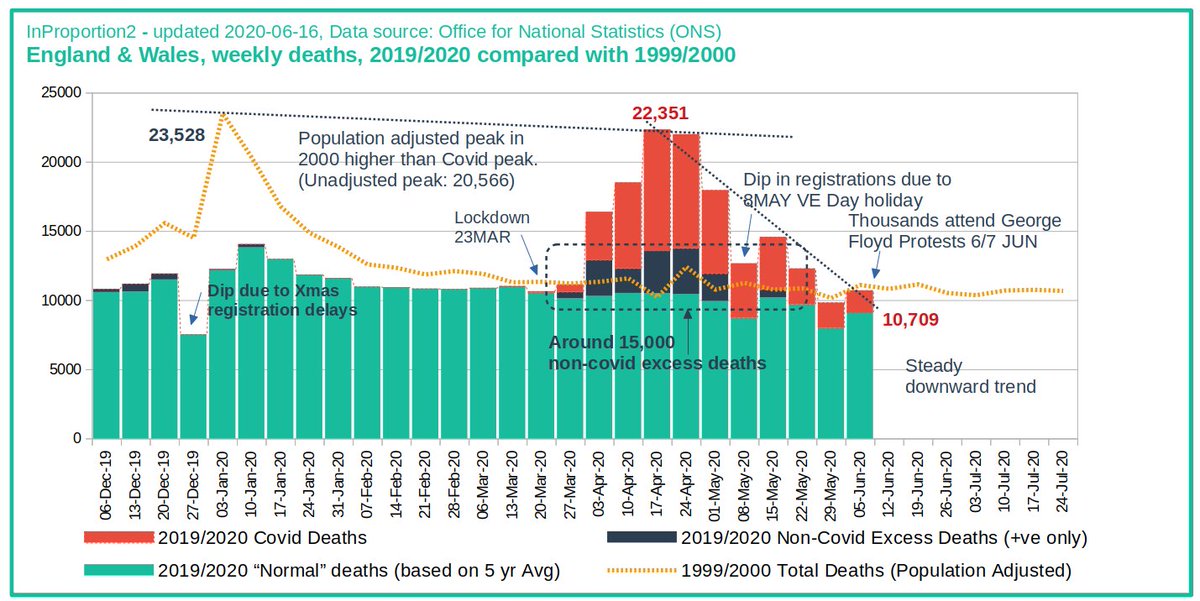
We also know that there have been at least 15,000 excess deaths not from Covid but likely a side effect of lockdown.
For example:
-Missed cancer or heart treatments.
-Delayed organ transplants.
-Increase in suicides.
@InProportion2
We also know that there have been at least 15,000 excess deaths not from Covid but likely a side effect of lockdown.
For example:
-Missed cancer or heart treatments.
-Delayed organ transplants.
-Increase in suicides.
@InProportion2

 Read on Twitter


