Thread explaining the current situation with the coronavirus (covid-19) in Sweden
If you want to know about the trend in new infections and deaths in Sweden. This is for you
 https://abs.twimg.com/emoji/v2/... draggable="false" alt="👇" title="Rückhand Zeigefinger nach unten" aria-label="Emoji: Rückhand Zeigefinger nach unten">
If you want to know about the trend in new infections and deaths in Sweden. This is for you
First a quick introduction to the Swedish approach to handling the outbreak. As you know, it is different to most countries
There are new rules but mostly is has been about giving people advice on how to behave and then we have been free to follow them as we wish
There are new rules but mostly is has been about giving people advice on how to behave and then we have been free to follow them as we wish
The rules and advice started coming on the 11th of March. So I will start from there
Everything did however not come a once. Here& #39;s the development with dates.
 https://abs.twimg.com/emoji/v2/... draggable="false" alt="📌" title="Reißzwecke" aria-label="Emoji: Reißzwecke"> 11th of March: Gatherings of over 500 people are not allowed (rule)
Everything did however not come a once. Here& #39;s the development with dates.
During this time, starting on the 11th of March there has also been a lot of information on hygiene and washing your hands.
There was also talk about keeping your distance to other people. This was however not truly emphasized in any press releases until the 1st of April, IMHO
There was also talk about keeping your distance to other people. This was however not truly emphasized in any press releases until the 1st of April, IMHO
So what effects did this have?
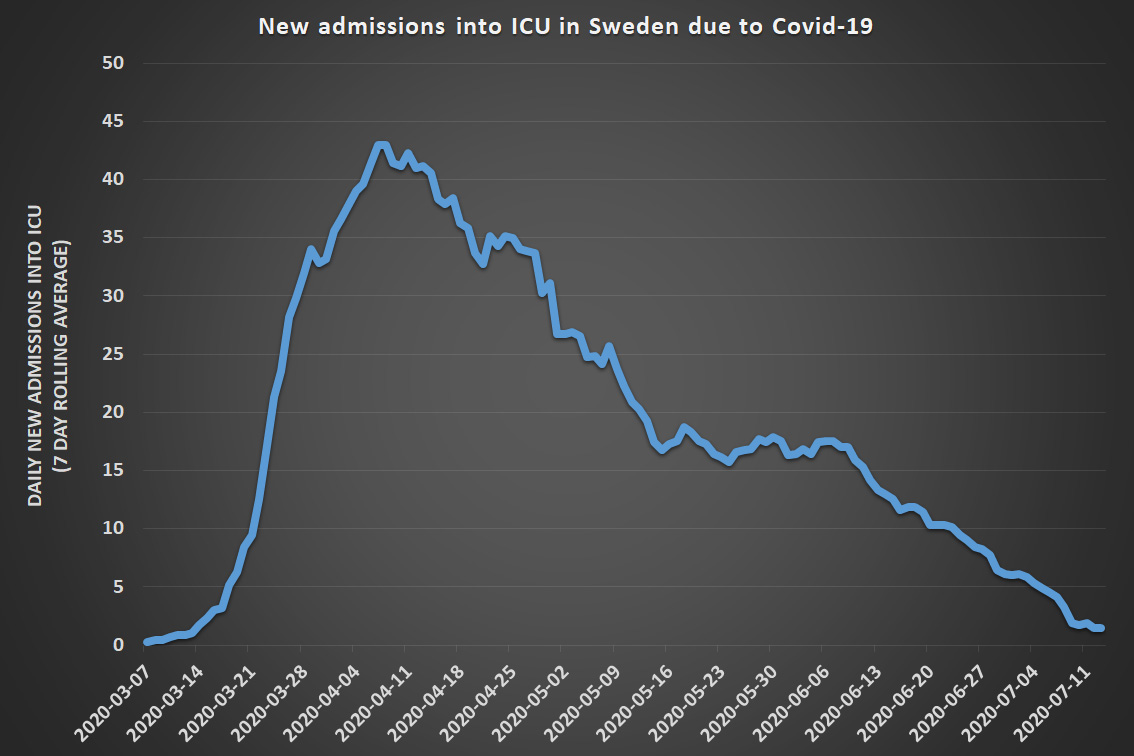
Within 3 weeks after the start of the changes the number of people hospitalized or admitted into ICU peaked
It takes ~2w from infection to ICU admission so this change in sick people matches up time wise with the changes in rules/recommendations
Within 3 weeks after the start of the changes the number of people hospitalized or admitted into ICU peaked
It takes ~2w from infection to ICU admission so this change in sick people matches up time wise with the changes in rules/recommendations
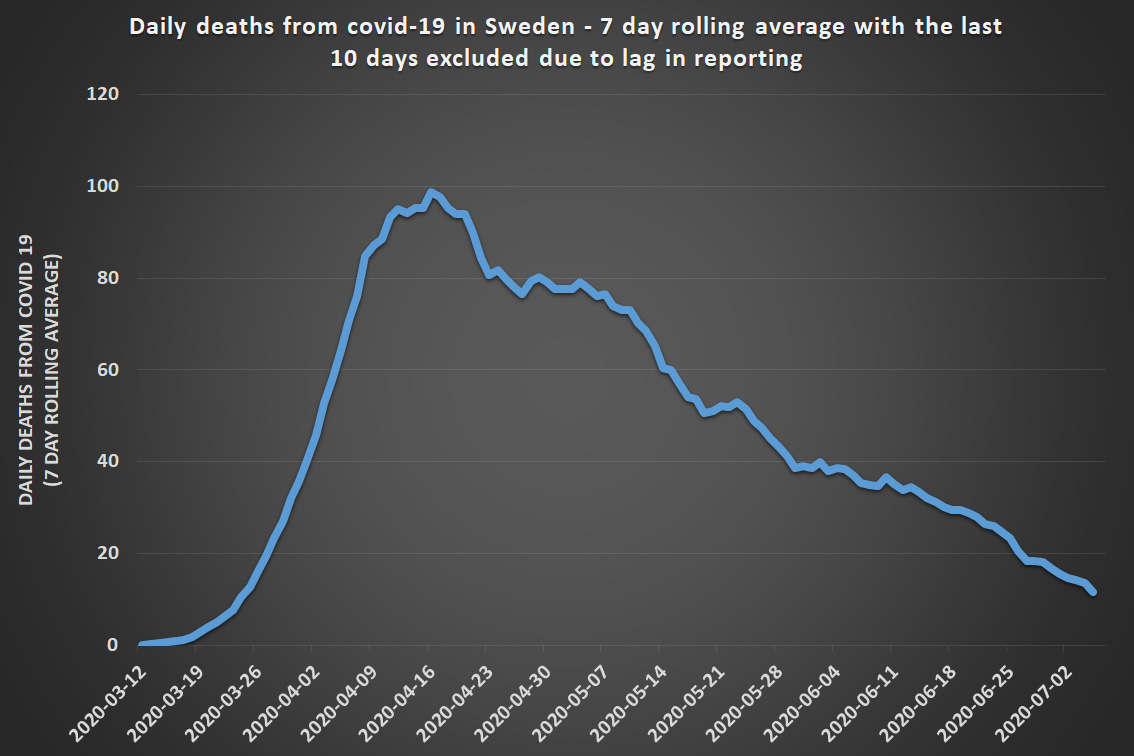
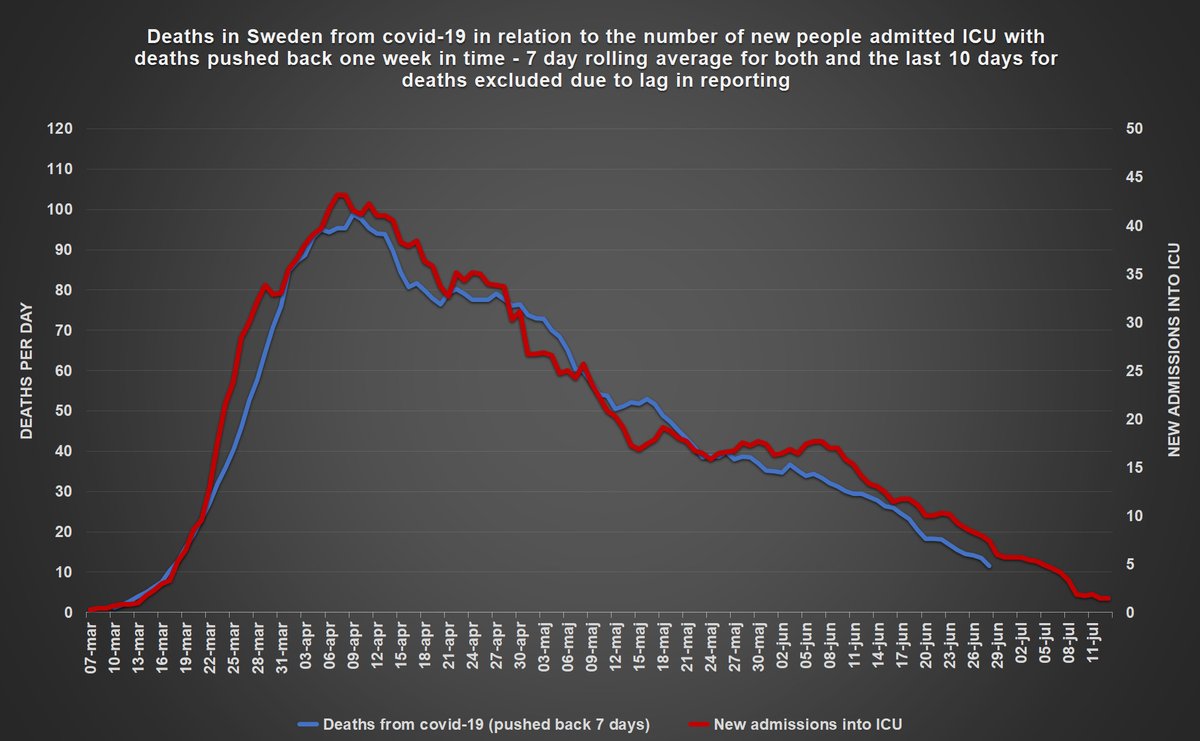
Deaths from covid-19 in Sweden has also followed the same pattern.
Here are the official numbers showing day of death.
Not the day the deaths get reported which is what you find on basically all international sites
Here are the official numbers showing day of death.
Not the day the deaths get reported which is what you find on basically all international sites
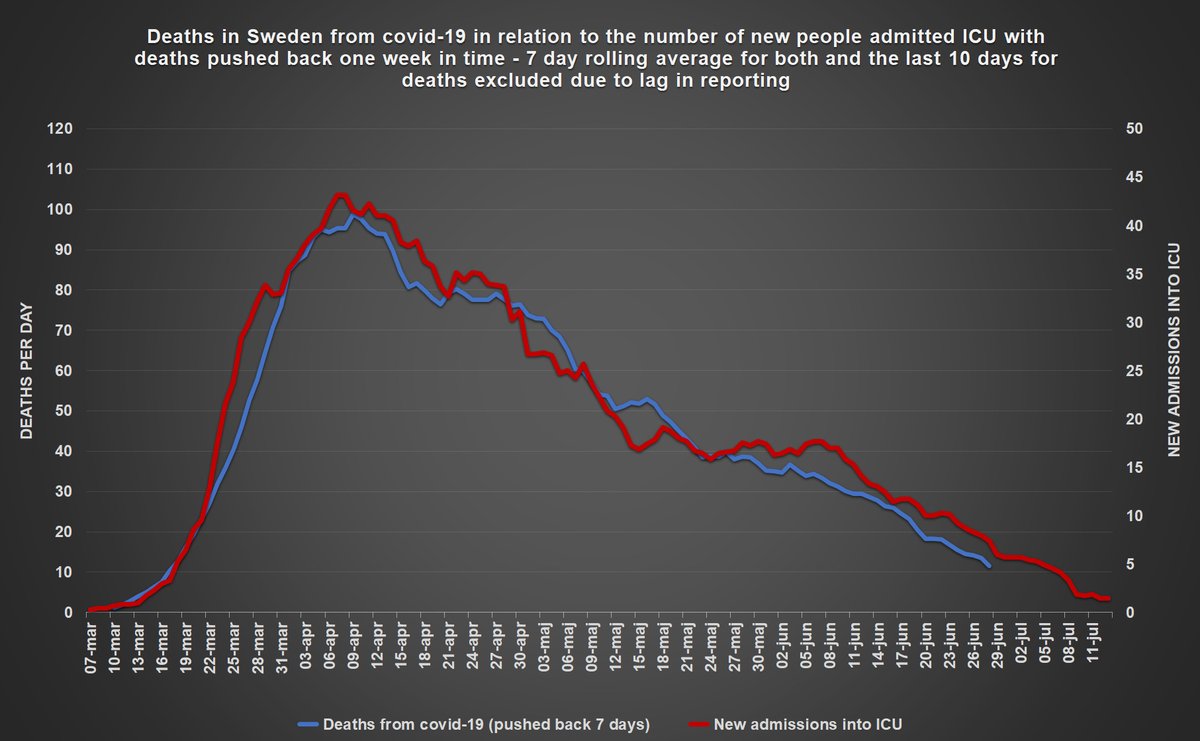
There is in fact a very clear correlation between new admissions into ICU and deaths in Sweden
So the actual number of daily deaths today are likely lower than what gets reported daily and it will likely get even lower during the coming week
So the actual number of daily deaths today are likely lower than what gets reported daily and it will likely get even lower during the coming week
So to summarize the information above:
Once the recommendations changed in Sweden, new hospitalizations, admissions into ICU and deaths followed with the more or less expected delay
Once the recommendations changed in Sweden, new hospitalizations, admissions into ICU and deaths followed with the more or less expected delay
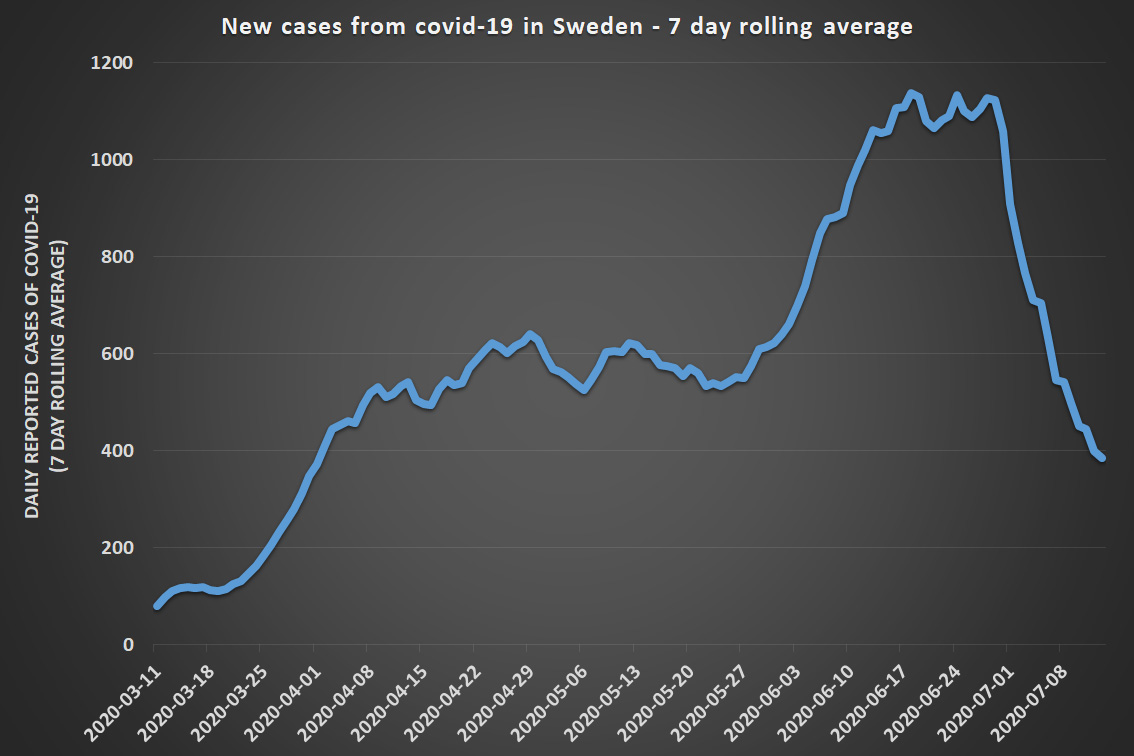
Now, let us look at the changes in new cases of covid-19 in Sweden. This is what the curve looks like
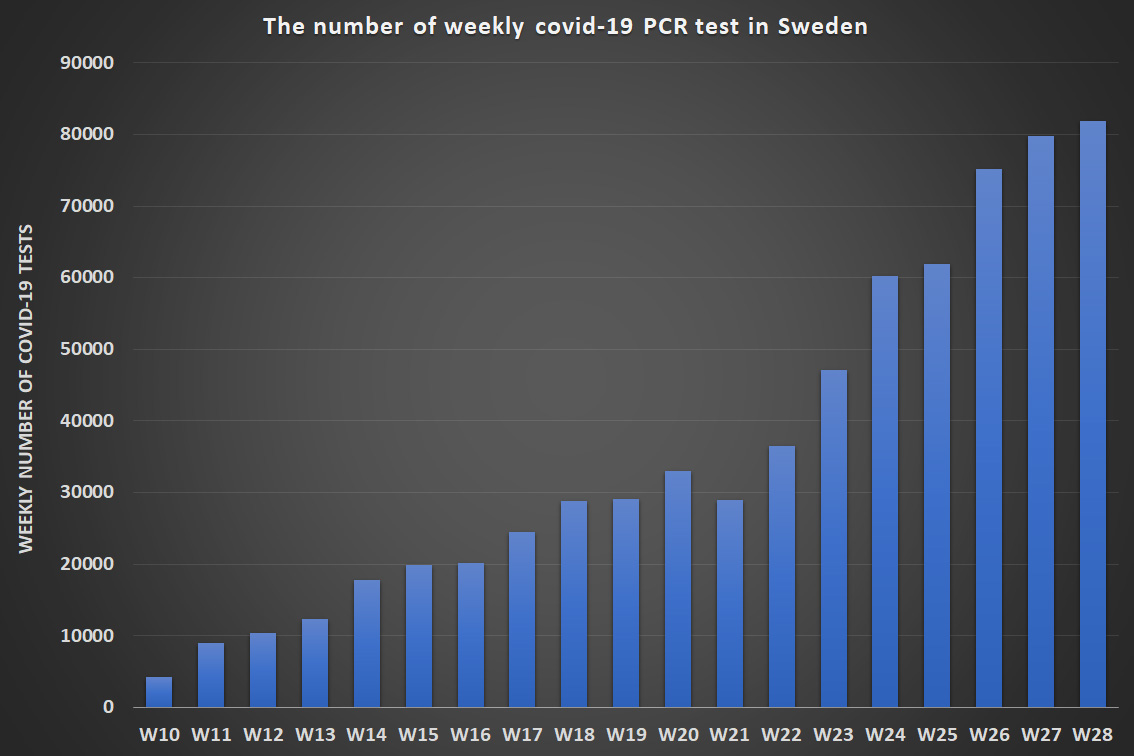
The shape of this curve is entirely due to increases in testing in Sweden
Yes, you read that correctly. It is entirely due to increased testing. Let me explain
The shape of this curve is entirely due to increases in testing in Sweden
Yes, you read that correctly. It is entirely due to increased testing. Let me explain
When the outbreak started in Sweden our testing capacity was low. So more or less only really sick people and people in elderly care were tested
Testing has since increased and new groups of people have been able to get tested
Testing has since increased and new groups of people have been able to get tested
Sweden has categorized people into 4 priority groups:
1. The really sick and people in elderly care
2. Health care workers
3. Other essential workers like police etc
4. Everybody else
The only group consistently getting tested during this entire time is priority group 1
1. The really sick and people in elderly care
2. Health care workers
3. Other essential workers like police etc
4. Everybody else
The only group consistently getting tested during this entire time is priority group 1
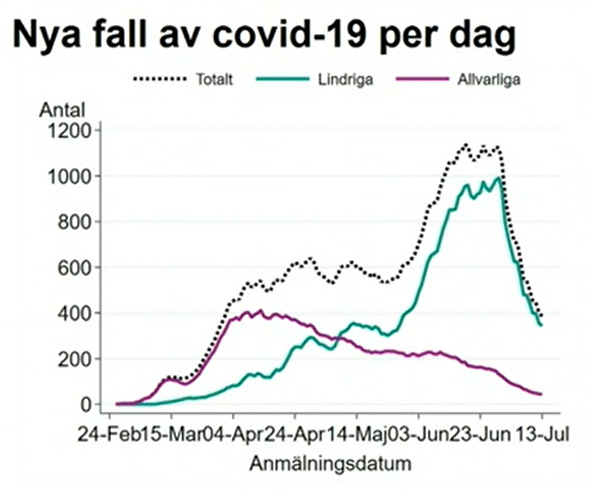
If you isolate the positive cases from priority group 1 from the other cases you get the purple line below.
This is the same shape of the curve as hospitalizations, ICU admissions and deaths
This graph is unfortunately only available in Swedish.
This is the same shape of the curve as hospitalizations, ICU admissions and deaths
This graph is unfortunately only available in Swedish.
So the reason for the Swedish graph for cases looking like it does is that testing has included new groups
Health care workers were able to get tested pretty soon. Their cases added from testing them made the graph flat although the number in infected people was decreasing
Health care workers were able to get tested pretty soon. Their cases added from testing them made the graph flat although the number in infected people was decreasing
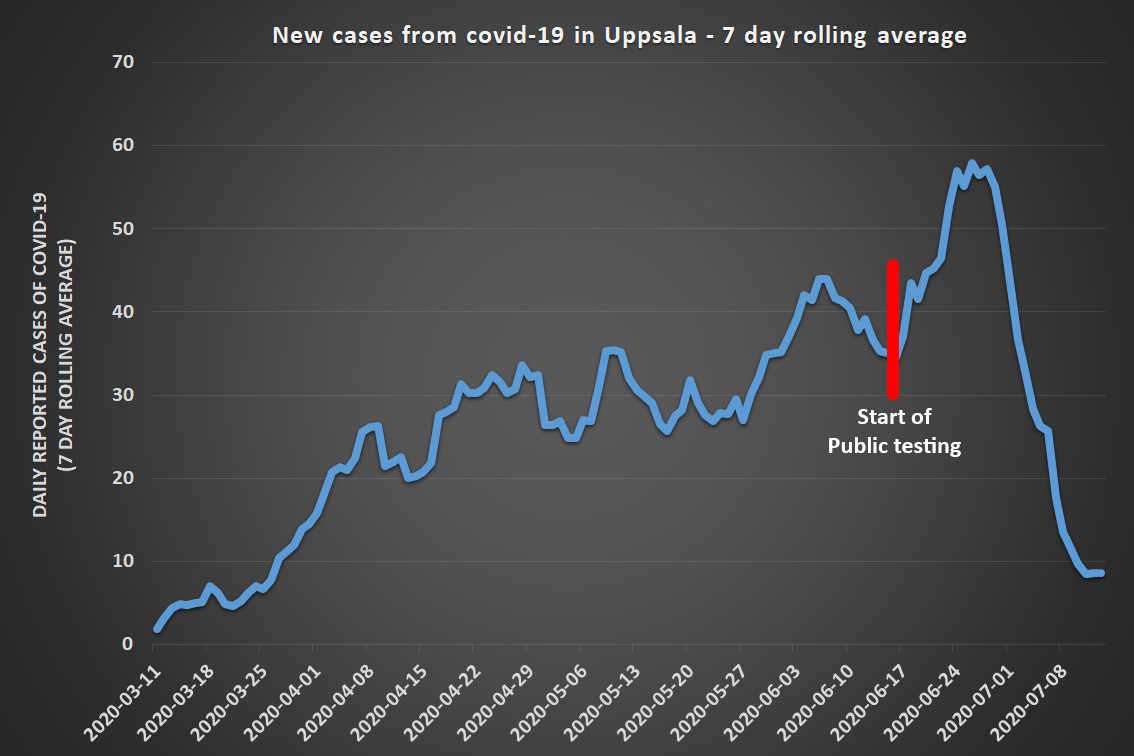
Then came the large increase in the beginning of June. This was when most of the large regions in Sweden opened up testing for everybody
Once this happened we also got an "artificial bump" in the number of cases since it was not only newly infected people getting tested
Once this happened we also got an "artificial bump" in the number of cases since it was not only newly infected people getting tested
We had people who have had symptoms for weeks ordering a test
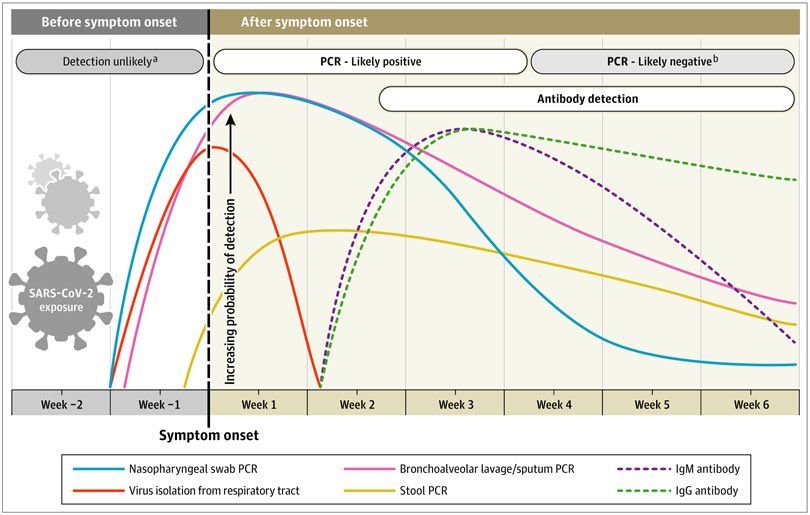
And since you can test positive for quite some time using PCR, we got a large increase in cases representing
1. A new population being tested
2. The size of that group getting inflated due to them being "buffered"
And since you can test positive for quite some time using PCR, we got a large increase in cases representing
1. A new population being tested
2. The size of that group getting inflated due to them being "buffered"
Here are the cases for 4 different regions just to show the effect from public testing starting and the artificial bump in cases
The Swedish curve for cases has led to a lot of confusion about the situation in Sweden in international media and from prominent "covid-19 people" on social media
There has been a lot of false claims about the number of people infected in Sweden increasing
There has been a lot of false claims about the number of people infected in Sweden increasing
Even the WHO didn& #39;t understand what was happening so they published a press release in late June claiming that the number of people infected was increasing  https://abs.twimg.com/emoji/v2/... draggable="false" alt="🤷♂️" title="Achselzuckender Mann" aria-label="Emoji: Achselzuckender Mann">
The WHO did however correct that statement when made aware of the error
The WHO did however correct that statement when made aware of the error
Unfortunately I can& #39;t say the same about the international media or prominent people here on Twitter.
Even after the error being pointed out to them they have continued to promote the false narrative that the number of people infected with covid-19 in Sweden is increasing
Even after the error being pointed out to them they have continued to promote the false narrative that the number of people infected with covid-19 in Sweden is increasing
Now at least you, who have read this, know better  https://abs.twimg.com/emoji/v2/... draggable="false" alt="👍" title="Thumbs up" aria-label="Emoji: Thumbs up">
There are a lot of other things worth writing about when it comes to Sweden and the coronavirus. Especially the comparison between us and our Nordic neighbors.
That comparison as always to simplistic and the conclusions turn out misleading
That comparison as always to simplistic and the conclusions turn out misleading
Hopefully I will find the time to do this later
Here& #39;s a very short version about the major problem with the comparison in English. https://twitter.com/luhugerth/status/1270319261198811136">https://twitter.com/luhugerth...
Here& #39;s a very short version about the major problem with the comparison in English. https://twitter.com/luhugerth/status/1270319261198811136">https://twitter.com/luhugerth...
And of course. The sources to the above information
Most of it is from our health agency, Folkhälsomyndigheten. You can download the cases, deaths and new admissions into ICU here https://www.folkhalsomyndigheten.se/smittskydd-beredskap/utbrott/aktuella-utbrott/covid-19/statistik-och-analyser/bekraftade-fall-i-sverige/">https://www.folkhalsomyndigheten.se/smittskyd...
Most of it is from our health agency, Folkhälsomyndigheten. You can download the cases, deaths and new admissions into ICU here https://www.folkhalsomyndigheten.se/smittskydd-beredskap/utbrott/aktuella-utbrott/covid-19/statistik-och-analyser/bekraftade-fall-i-sverige/">https://www.folkhalsomyndigheten.se/smittskyd...
The swedish graph is a print screen from the latest press conference. There is however a similar graph published every week from our health agency in the weekly report https://www.folkhalsomyndigheten.se/folkhalsorapportering-statistik/statistik-a-o/sjukdomsstatistik/covid-19-veckorapporter/senaste-covidrapporten/">https://www.folkhalsomyndigheten.se/folkhalso...
The new admissions into hospitals is published by The National Board of Health and Welfare and can be found here https://www.socialstyrelsen.se/statistik-och-data/statistik/statistik-om-covid-19/statistik-om-slutenvard-av-patienter-med-covid-19/">https://www.socialstyrelsen.se/statistik...
The graph showing when you usually test positive with different test can be found here https://jamanetwork.com/journals/jama/fullarticle/2765837">https://jamanetwork.com/journals/...

 Read on Twitter
 " title="Thread explaining the current situation with the coronavirus (covid-19) in SwedenIf you want to know about the trend in new infections and deaths in Sweden. This is for youhttps://abs.twimg.com/emoji/v2/... draggable="false" alt="👇" title="Rückhand Zeigefinger nach unten" aria-label="Emoji: Rückhand Zeigefinger nach unten">" class="img-responsive" style="max-width:100%;"/>




 " title="Now at least you, who have read this, know better https://abs.twimg.com/emoji/v2/... draggable="false" alt="👍" title="Thumbs up" aria-label="Emoji: Thumbs up">" class="img-responsive" style="max-width:100%;"/>


