***Distributed Gas Generation Thread***
16/06/2020 – v high gas generation connected to elec transmission (~70%).
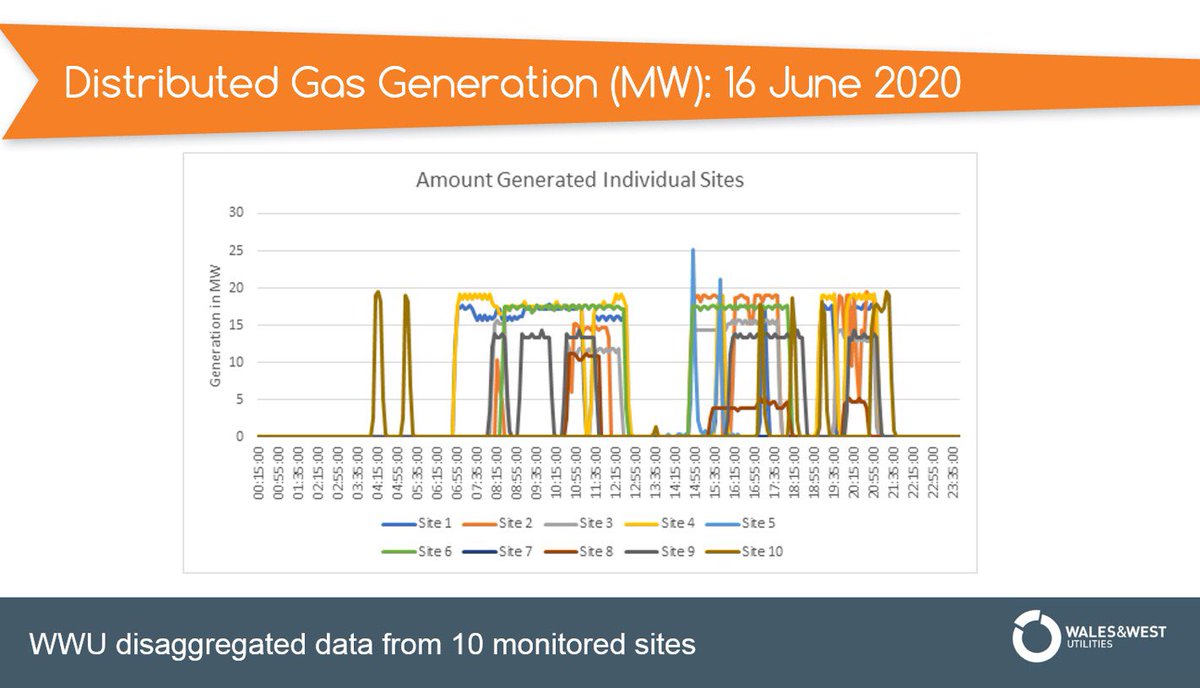
Disaggregated data from 10 monitored flexible power generation stations connected to our @WWUtilities network only using 65% of their connected capacity at peak.
16/06/2020 – v high gas generation connected to elec transmission (~70%).
Disaggregated data from 10 monitored flexible power generation stations connected to our @WWUtilities network only using 65% of their connected capacity at peak.
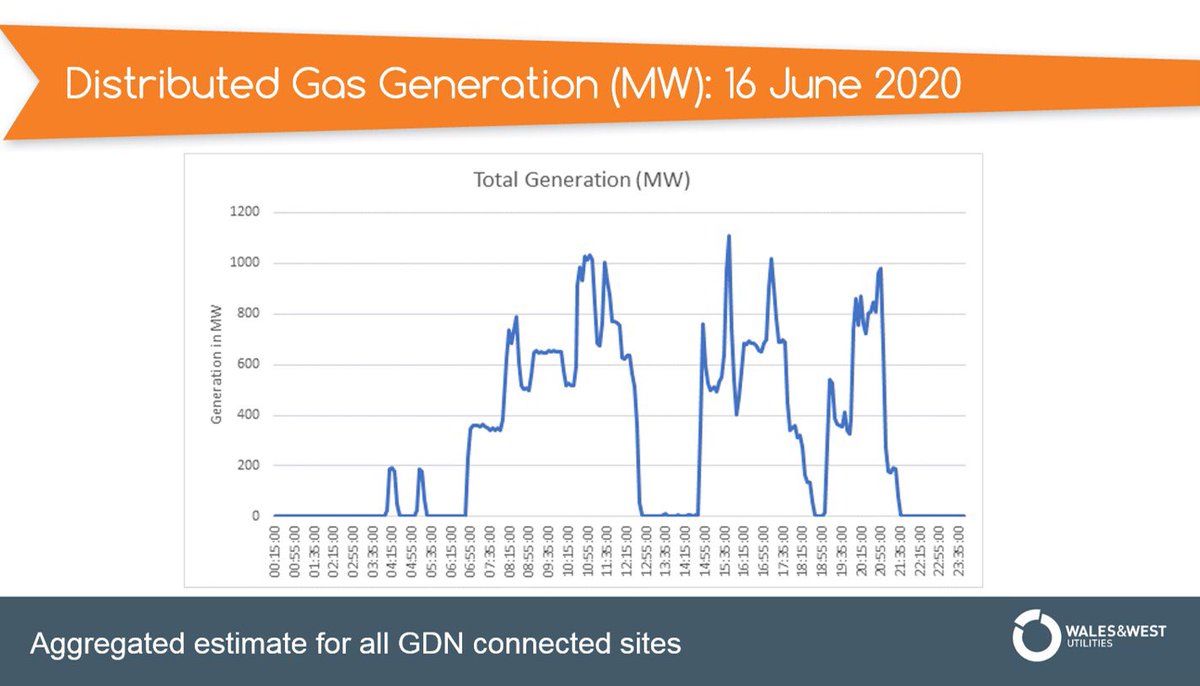
Estimate of distributed flexible gas generation across GB, based on prorated aggregation of monitored generation against all connected capacity.
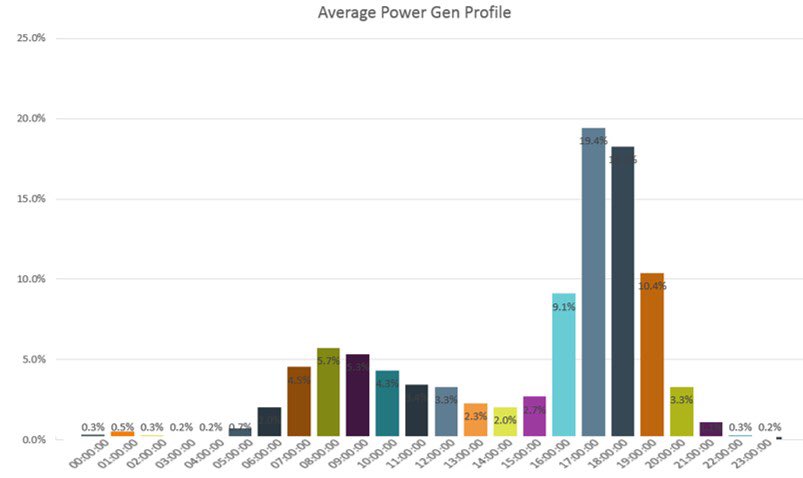
Average power generation profile over a day as a % share of daily generation from these flexible plants. The fleet responds to the typical demand profile, but also to low renewable generation.
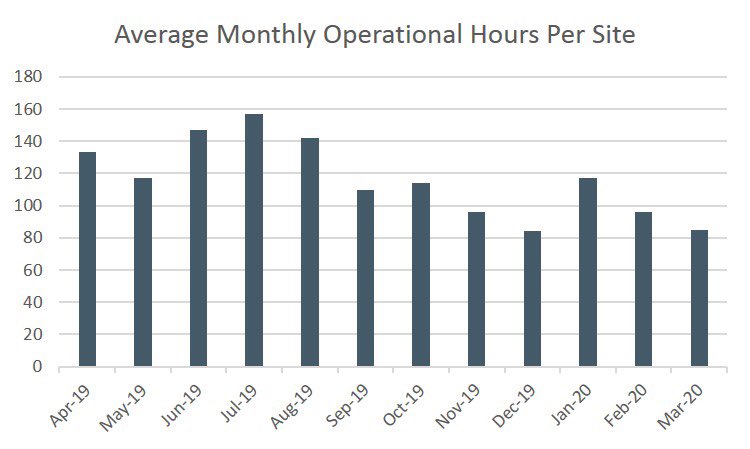
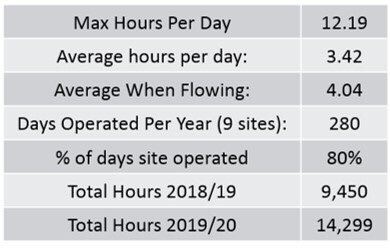
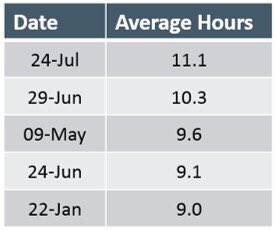
Average monthly power generation profile over a year (hours per flexible distributed gas generation site). Note they are used more in summer than in winter.

 Read on Twitter