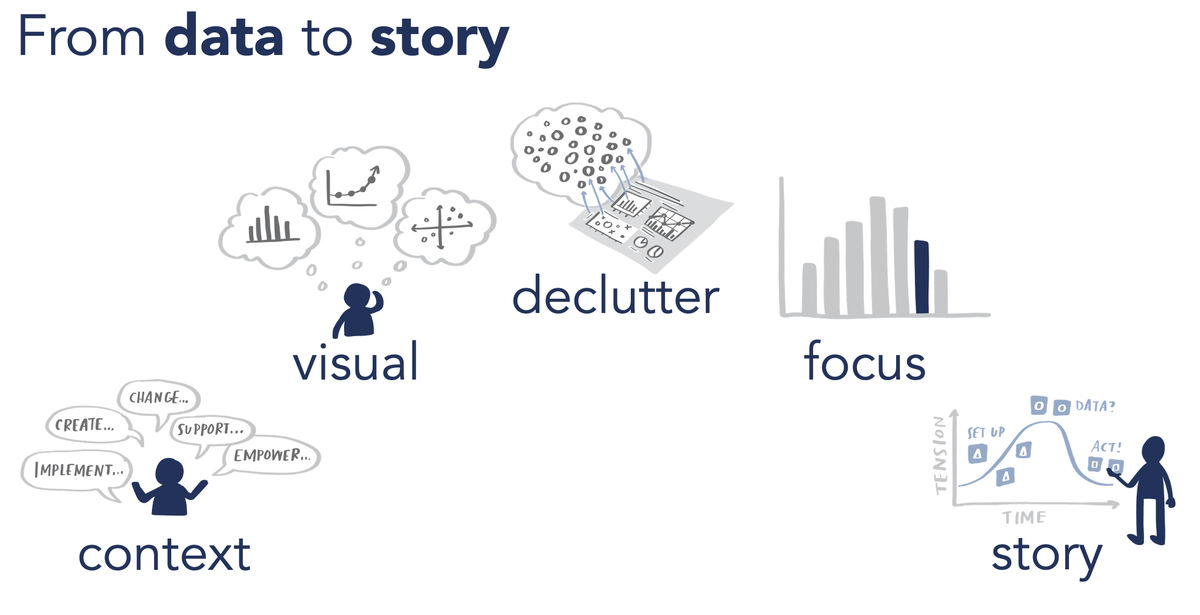
5 lessons for becoming a more effective data storyteller
Join me & SWD team September 15th for a hands-on virtual workshop where you& #39;ll learn & practice moving from data to story in an engaging & interactive session: http://www.storytellingwithdata.com/public-workshops">https://www.storytellingwithdata.com/public-wo...
Join me & SWD team September 15th for a hands-on virtual workshop where you& #39;ll learn & practice moving from data to story in an engaging & interactive session: http://www.storytellingwithdata.com/public-workshops">https://www.storytellingwithdata.com/public-wo...
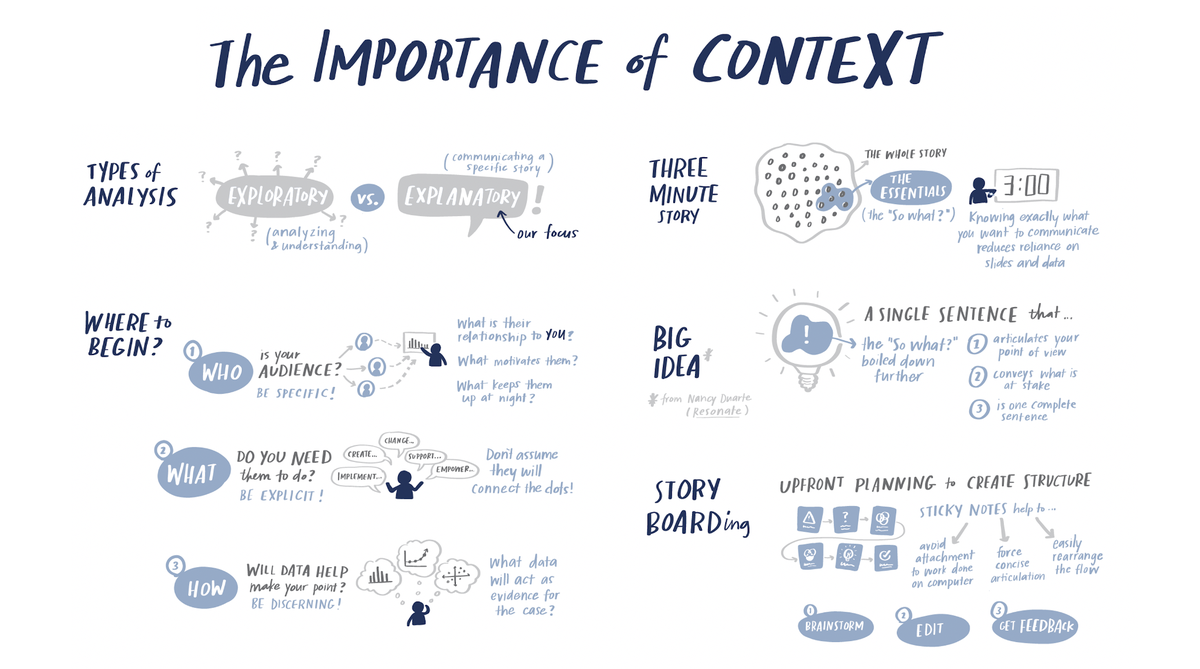
LESSON 1: build a robust understanding of the context
Before you create explanatory #dataviz, step back & consider your audience, what you need them to know & role of data. Craft your Big Idea; storyboard to plan content. Get feedback at this early step!
(artwork by @catmule)
Before you create explanatory #dataviz, step back & consider your audience, what you need them to know & role of data. Craft your Big Idea; storyboard to plan content. Get feedback at this early step!
(artwork by @catmule)
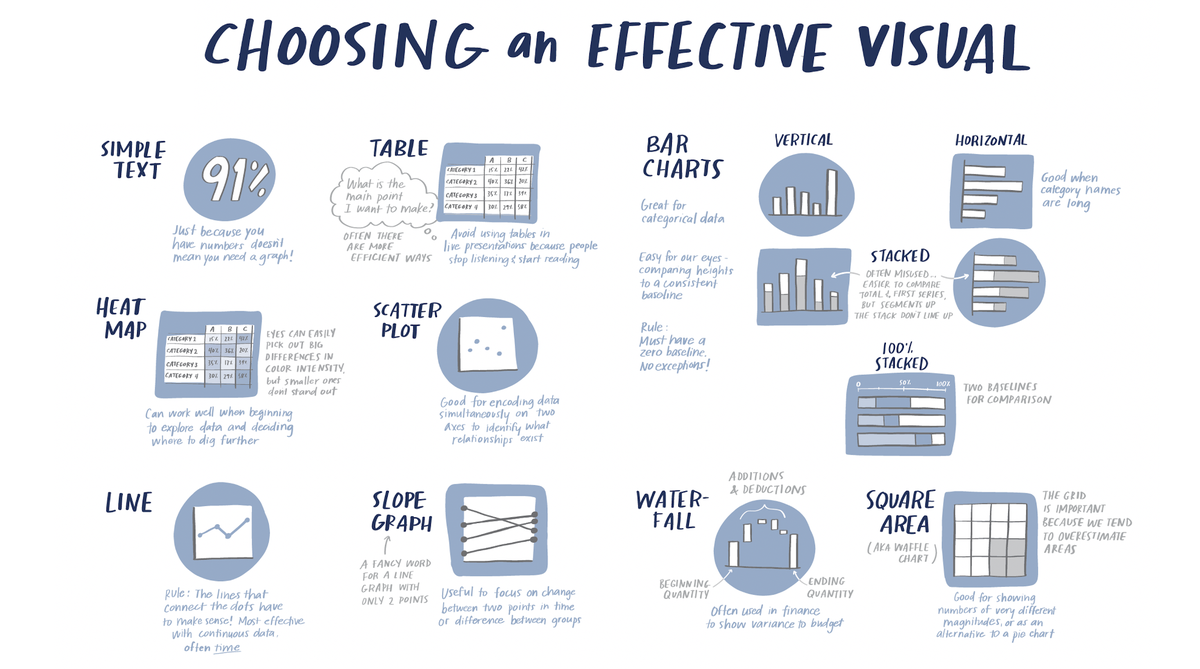
LESSON 2: choose an effective visual
There is no single "right" way to show data. In the 9/15 virtual workshop, we& #39;ll discuss common #dataviz in a business setting + pros/cons of each so you& #39;ll feel well-equipped to choose your next graph. http://www.storytellingwithdata.com/public-workshops">https://www.storytellingwithdata.com/public-wo...
There is no single "right" way to show data. In the 9/15 virtual workshop, we& #39;ll discuss common #dataviz in a business setting + pros/cons of each so you& #39;ll feel well-equipped to choose your next graph. http://www.storytellingwithdata.com/public-workshops">https://www.storytellingwithdata.com/public-wo...
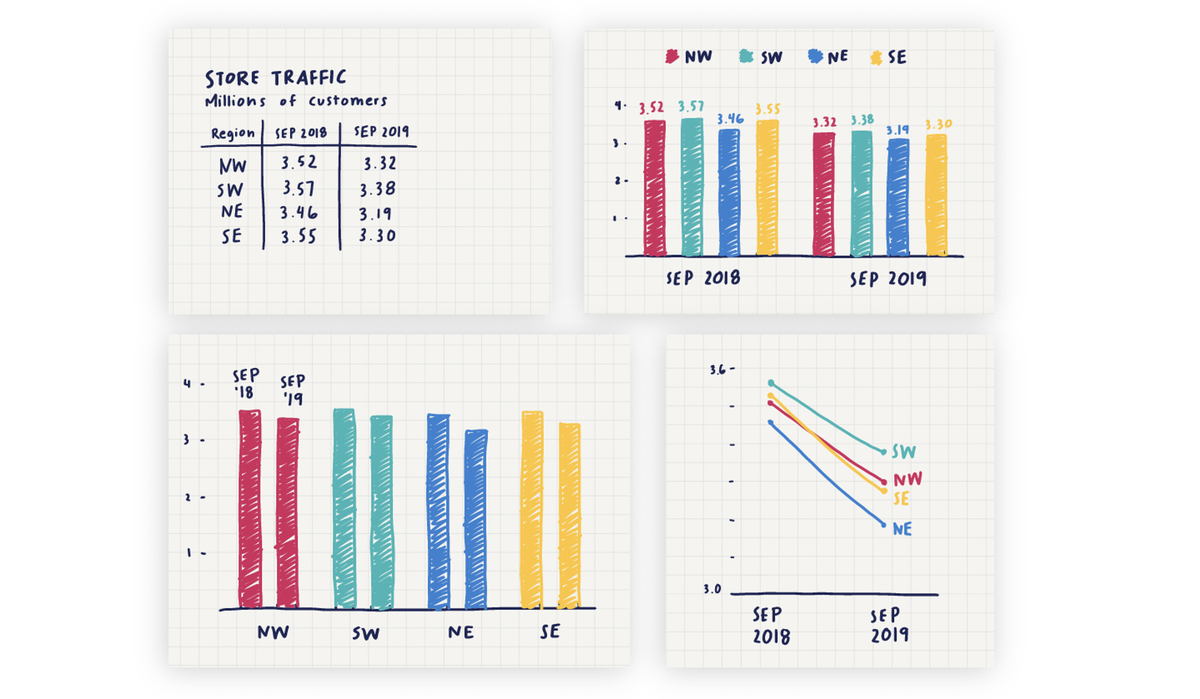
We don& #39;t always land on an ideal #dataviz on our first try. Drawing different views can be useful to quickly iterate & assess what might work.
We& #39;ll practice sketching data on 9/15 in one of our hands-on workshop exercises. You can take part! http://www.storytellingwithdata.com/public-workshops">https://www.storytellingwithdata.com/public-wo...
We& #39;ll practice sketching data on 9/15 in one of our hands-on workshop exercises. You can take part! http://www.storytellingwithdata.com/public-workshops">https://www.storytellingwithdata.com/public-wo...
LESSON 3: declutter
A simple yet powerful action: eliminate the visual elements in your communications that don& #39;t need to be there. De-emphasize necessary but non-message-impacting items.
We& #39;ll get comfortable decluttering our #dataviz on 9/15: http://www.storytellingwithdata.com/public-workshops">https://www.storytellingwithdata.com/public-wo...
LESSON 4: focus attention
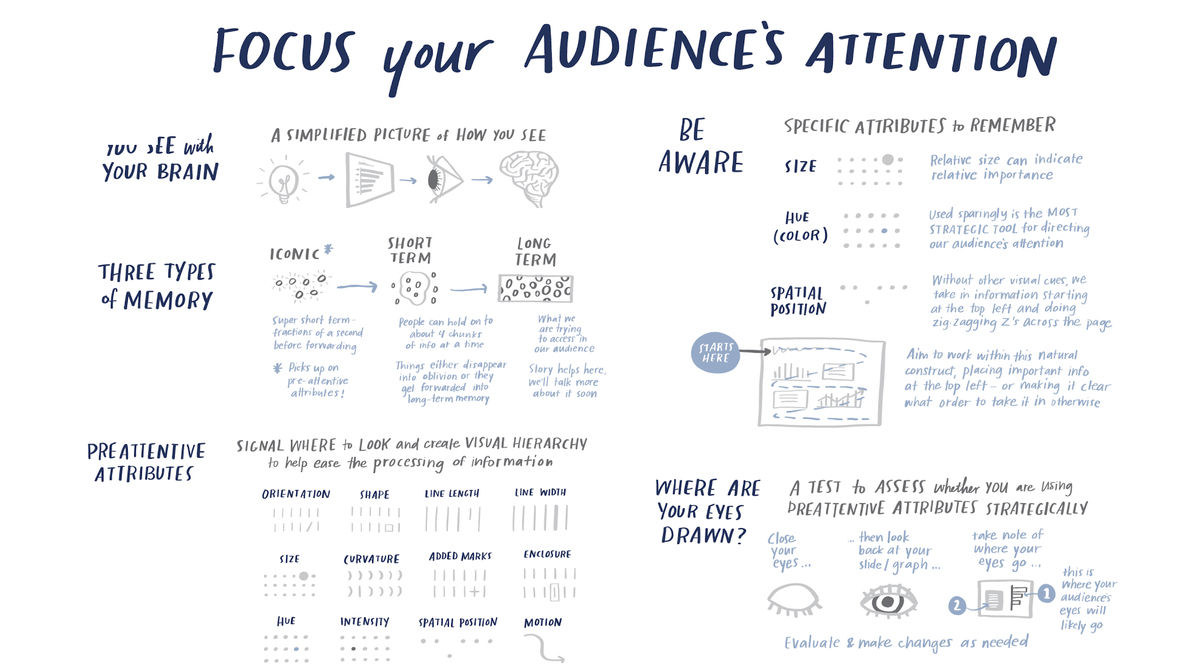
You know where to look in your #dataviz because you created it. To make it clear to others, take explicit steps. Thoughtful use of color, size, position can direct eyes, create visual hierarchy & make visuals easier to process.
You know where to look in your #dataviz because you created it. To make it clear to others, take explicit steps. Thoughtful use of color, size, position can direct eyes, create visual hierarchy & make visuals easier to process.
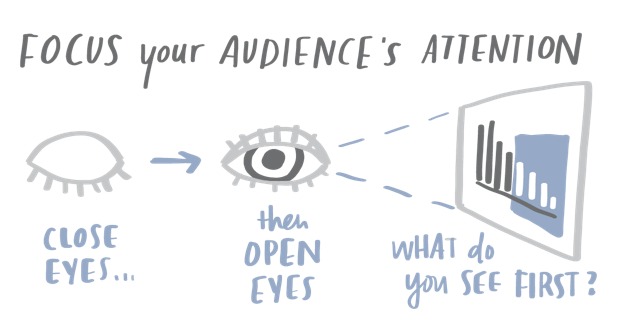
Where are your eyes drawn?
This is a simple test you can do with your own #dataviz and slides: close your eyes, then open and see where they land first. Is it where you want your audience to look? If not, adjust!
This is a simple test you can do with your own #dataviz and slides: close your eyes, then open and see where they land first. Is it where you want your audience to look? If not, adjust!
LESSON 5: tell a story
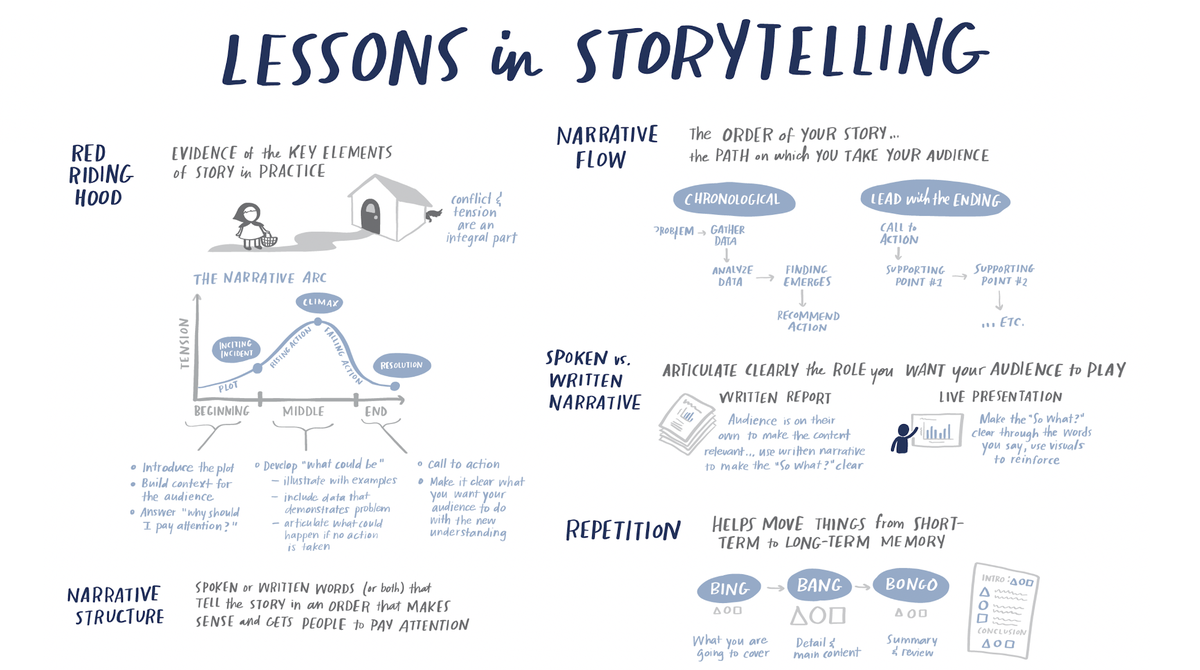
We can be strategic and nuanced in how we incorporate elements of story into #dataviz. Doesn& #39;t have to start with "Once upon a time..." DOES need to identify tension, bring it to light & take audience along a path that motivates them to understand & act.
We can be strategic and nuanced in how we incorporate elements of story into #dataviz. Doesn& #39;t have to start with "Once upon a time..." DOES need to identify tension, bring it to light & take audience along a path that motivates them to understand & act.
Learn & practice: see each *storytelling with data* lesson illustrated through numerous examples & hone skills directly via targeted hands-on exercises. http://www.storytellingwithdata.com/public-workshops
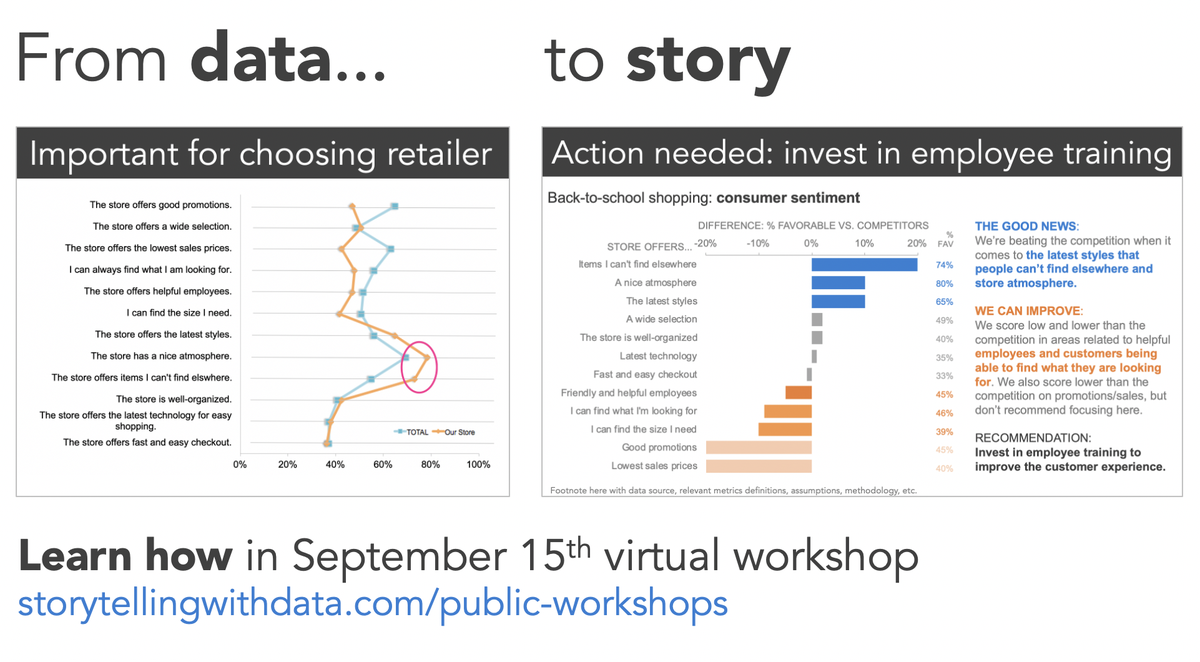
Don& #39;t">https://www.storytellingwithdata.com/public-wo... simply show data—tell a story that affords understanding & inspires action!
(End of thread.)
Don& #39;t">https://www.storytellingwithdata.com/public-wo... simply show data—tell a story that affords understanding & inspires action!
(End of thread.)

 Read on Twitter