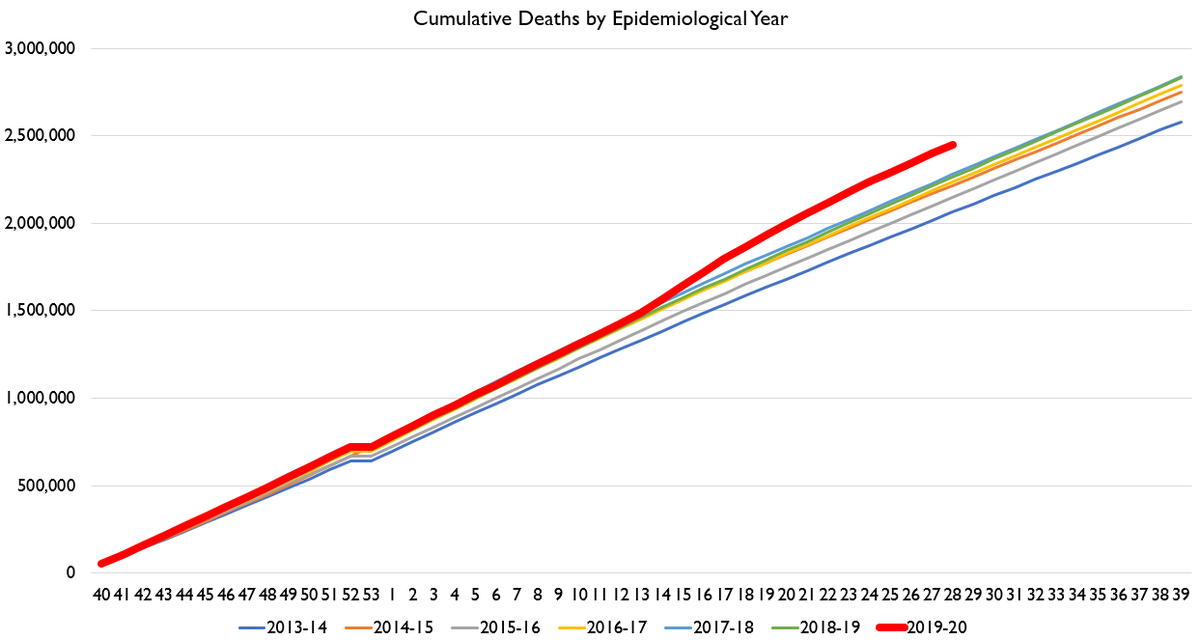
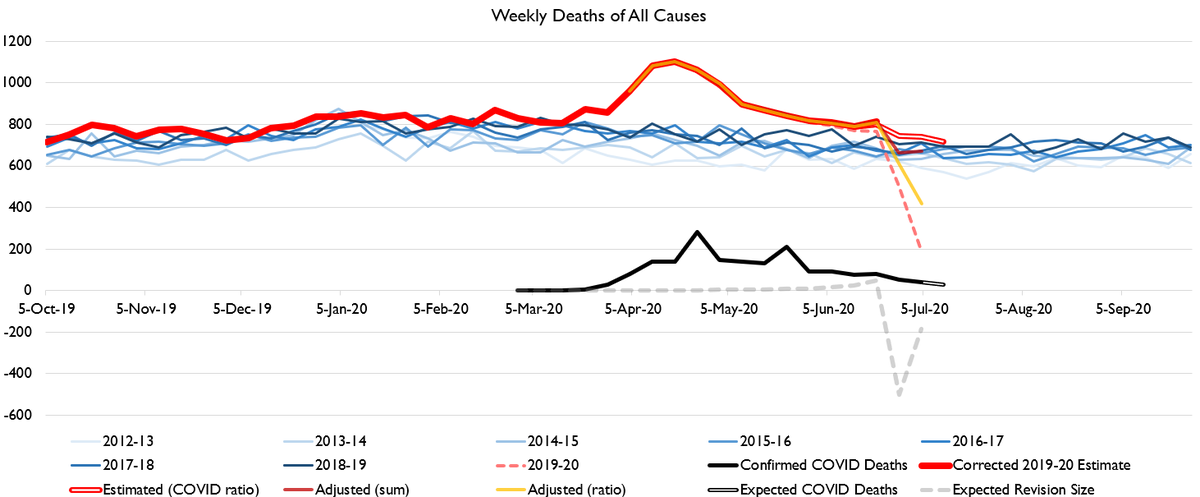
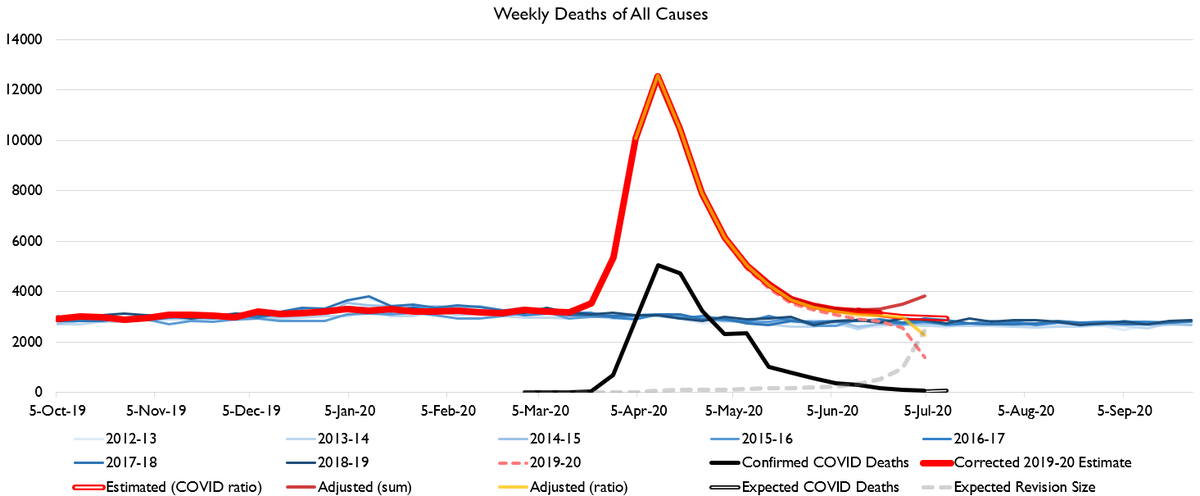
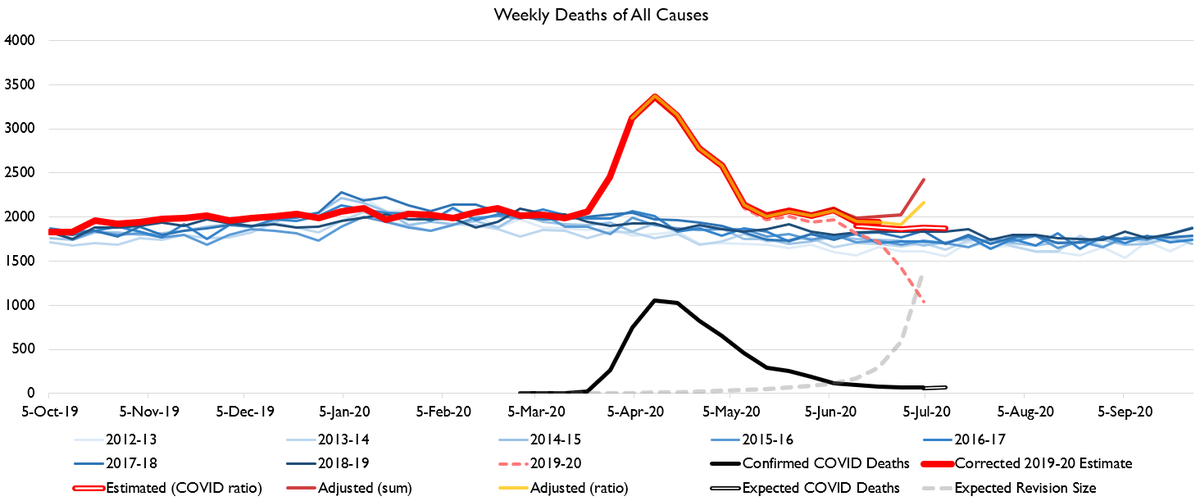
High end of normal, of course. But in the universe of normal.
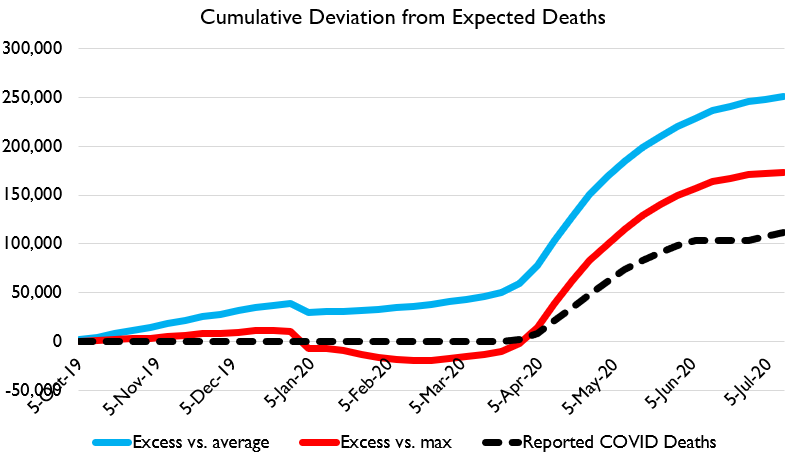
However, cumulative excess deaths remain very high, at around 170-250k.
However, cumulative excess deaths remain very high, at around 170-250k.
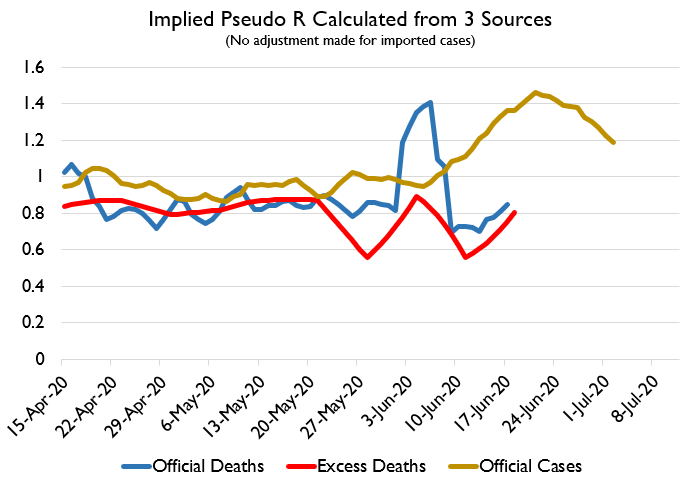
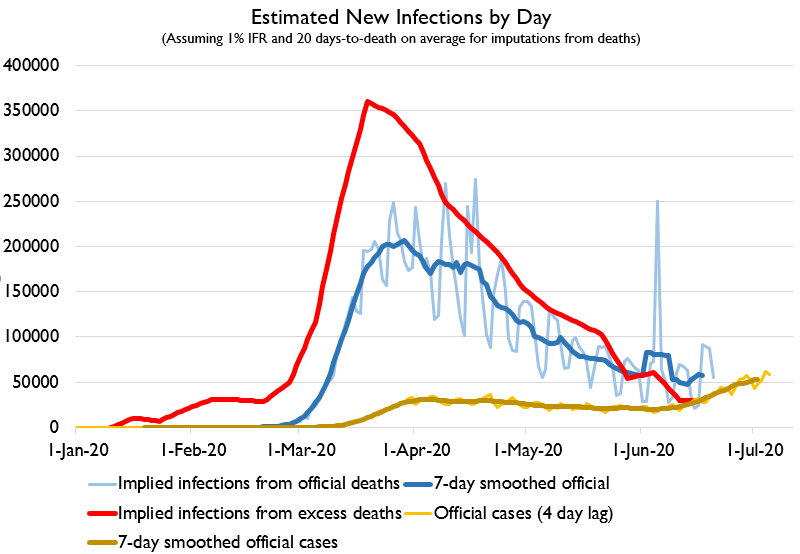
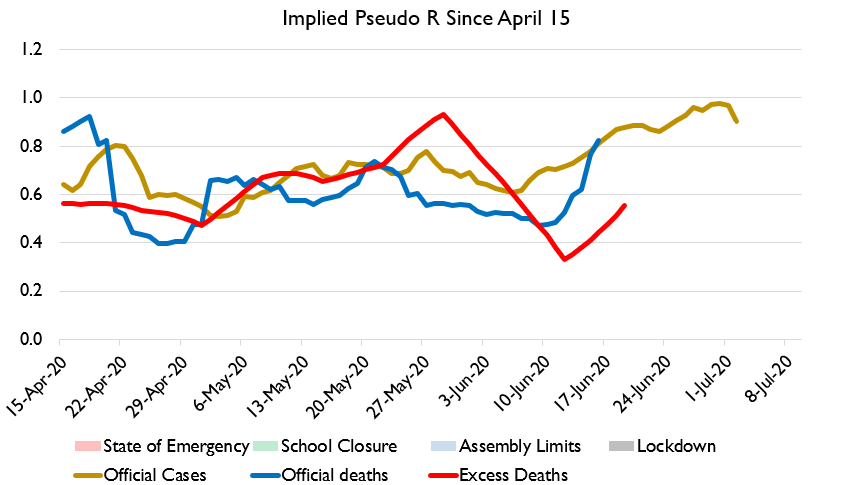
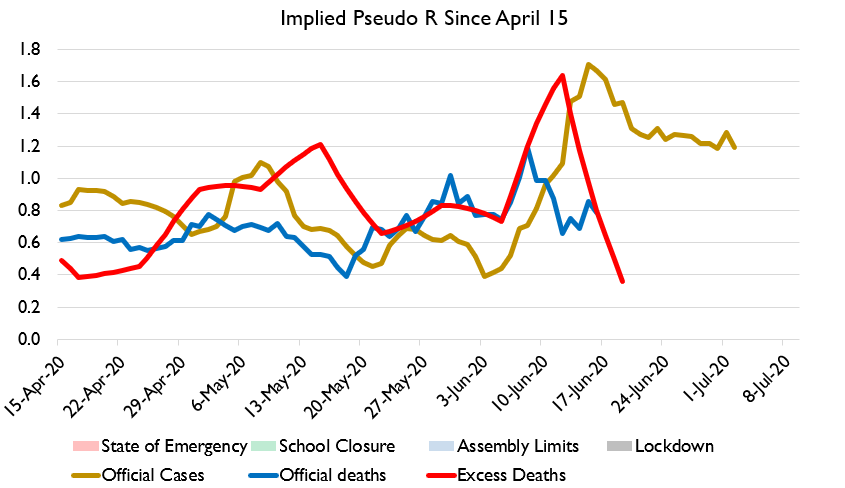
It& #39;s still a BIT early to say whether the current spike in cases will drive a big spike in deaths nationally. But cases are definitely rising! However, official-case-measured R value is already coming down. Good job everybody!
So @arpitrage asks about age group. I can do age group! And it reveals a pretty astonishing trend!
Excess deaths have been about the same for 18-64 year olds as 65+.
But they are WAY down for those under 18!
Excess deaths have been about the same for 18-64 year olds as 65+.
But they are WAY down for those under 18!
Why are fewer kids dying? Well, COVID is less severe in kids so there& #39;s nor eason to expect a huge spike. But that doesn& #39;t explain the decline.
One way to figure this out is to ask: how do kids USUALLY die? (dark thread y& #39;all)
One way to figure this out is to ask: how do kids USUALLY die? (dark thread y& #39;all)
The main cause of death for <18 year olds is an assortment of infant-mortality related causes. Spoiler: births in 2020 are lower than in 2019. The next biggest cause of death for this group is SIDS, negligence, "unattended," etc.
There& #39;s gonna be less "unattended death" during COVID because kids are more closely attended.
Other infancy-related conditions are common at the high rungs. But number 3 cause is "Other accidents" and number 4 is "Transport accidents."
Other infancy-related conditions are common at the high rungs. But number 3 cause is "Other accidents" and number 4 is "Transport accidents."
Child deaths are down 15%. Car crashes make up about 7% of under 18 deaths. I& #39;m sure those deaths are way down. But y& #39;all it ain& #39;t JUST car crashes! And car crashes didn& #39;t fall to ZERO!
But yeah car crashes are a huge source here.
But school/childcare/playdate cancellations probably MASSIVELY reduced the burden of infectious disease for kids too.
But school/childcare/playdate cancellations probably MASSIVELY reduced the burden of infectious disease for kids too.
And ***simply having parents at home*** probably reduced deaths from inattention by some amount.
But we won& #39;t really know by cause for quite a while.
But we won& #39;t really know by cause for quite a while.
But suffice to say, the life you and your family are living right now is probably MUCH physically healthier for your kid than their normal life (emotional/mental is another question of course!).
It should shock absolutely nobody, especially conservatives, that having kids at home more, with their parents more, and spending less time in (mostly public) schools might lead to fewer dead kids. That& #39;s.... like our whole schtick!
Now, the much more shocking thing is that deaths in the 18-64 range have risen by about the same amount as 65+. That& #39;s.... quite surprising.
Note that I believe deaths WILL rise soon. It seems VERY implausible that the rise in cases won& #39;t be followed by a rise in deaths.
By the way, the decline in child deaths amounts to about 2,200 fewer child deaths from Feb 1-July 4 in 2020 than in 2019.
Okay, now I& #39;m gonna do some states.
But not states-by-age. Because that& #39;s a lot of work and I& #39;m not being paid.
However if someone would like to pay me for this public service I have been performing for several months now I would welcome it. It takes a ton of time and I do actually have other stuff to do.
However if someone would like to pay me for this public service I have been performing for several months now I would welcome it. It takes a ton of time and I do actually have other stuff to do.
CDC only produces provisional data by the 3 age groups I showed, alas. https://twitter.com/nbeaudrot/status/1281643725915971589">https://twitter.com/nbeaudrot...
So @ariarmstrong asks for Colorado and while I probably won& #39;t take many requests today because it& #39;s exhausting, Colorado is a very wonderful place, so here& #39;s Colorado, where the COVID situation is.... okayish?
Note that the death chart is now VERY complicated in recent weeks.
Basically, the longer I do this, the more I& #39;m seeing just how often state-level reporting patterns get screwed up by changes in guidelines, holidays, somebody out sick, etc.
Basically, the longer I do this, the more I& #39;m seeing just how often state-level reporting patterns get screwed up by changes in guidelines, holidays, somebody out sick, etc.
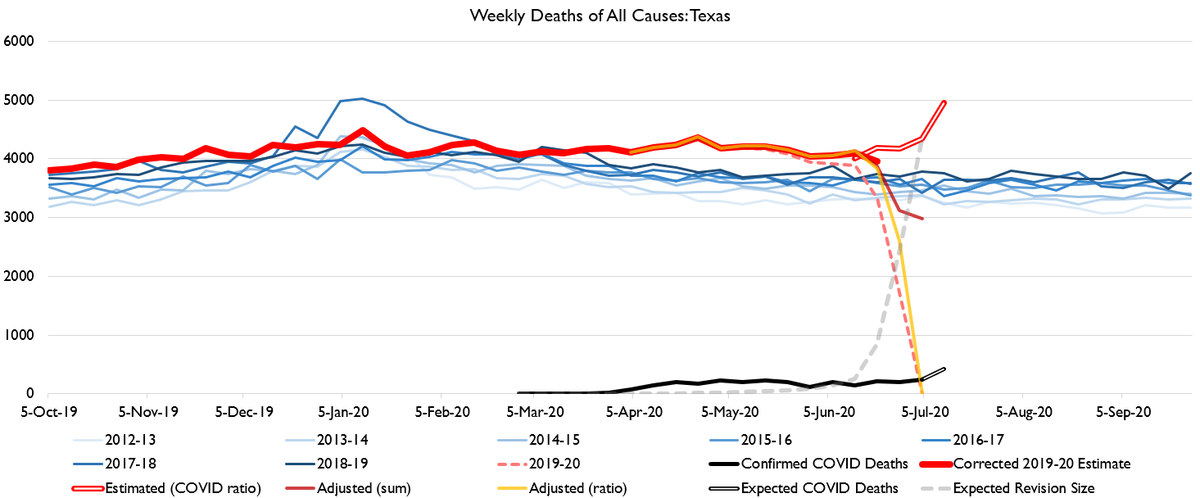
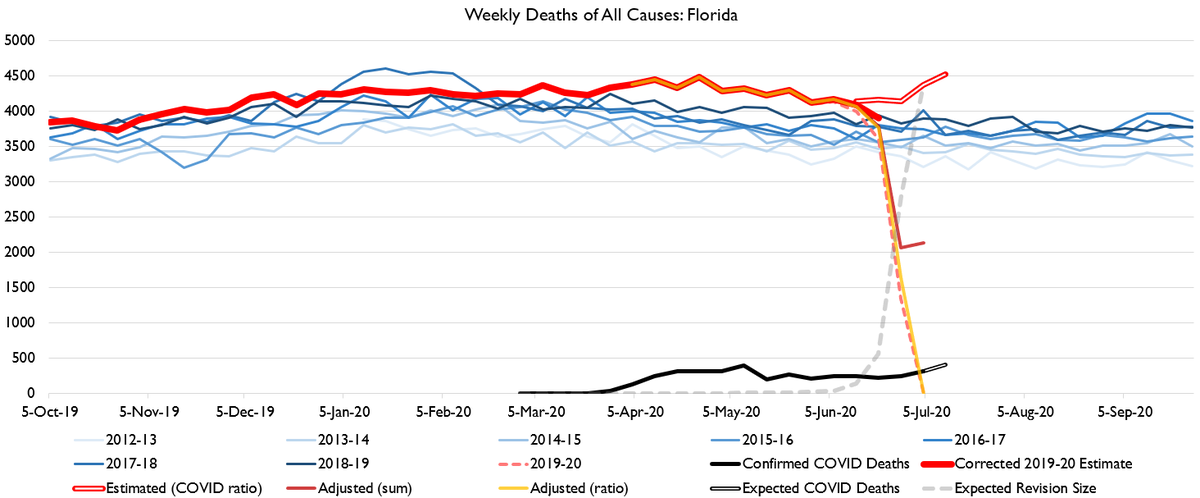
So I& #39;m letting you look "under the hoot." The pink dashed line is the raw data from a state. The yellow line is if I adjust it using the typical revision *ratio*. The dark red line adjusts using the typical revision *sum*.
And the hollow red line just adds a ratio of COVID deaths to expected "normal" deaths, the ratio calculated by the prior state-level ratio of COVID deaths to excess deaths.
In the most recent week or 3, the hollow red line is *probably* most accurate. But in states like Colorado where the lines all disagree, we need to have some epistemic humility and admit we don& #39;t really know.
The question is: can we guess at life-years lost?
We can guess very broadly. Suppose each child life saved will live 55 more years than they would have, each 18-64 life lost would have lived 10 more years, and each 65+ would have lived 2 more years. https://twitter.com/DrNeemaSalimi/status/1281646665754120192">https://twitter.com/DrNeemaSa...
We can guess very broadly. Suppose each child life saved will live 55 more years than they would have, each 18-64 life lost would have lived 10 more years, and each 65+ would have lived 2 more years. https://twitter.com/DrNeemaSalimi/status/1281646665754120192">https://twitter.com/DrNeemaSa...
282,000 life-years are lost among the 65+ crowd. 371,000 among the 18-64. And 120,000 life years are *gained* among the under-18s. So a net loss of 532,000 life years in the course of 5 months.
Now to put my pro-natalist hat on, I& #39;ll note that& #39;s about 7,000 complete lifespans. Every time we reduce births by 5,000-10,000, we reduce society-wide life-years by a comparable amount as COVID-19 has done, on net.
I& #39;m in Michigan right now so am very interested in what& #39;s happening and what& #39;s happening is deaths are still elevated and MAYBE spiking again.
Here& #39;s Florida, Texas, and California. Just deaths here, not cases.

 Read on Twitter
