What max group size is needed to stop superspreading events (SSEs) & control COVID19?
It& #39;s now well known that SSEs play key role in #COVID19. Big Q: how do interventions reduce size of these events and how effective would they be?
Statsy/mathy thread. https://www.sciencemag.org/news/2020/05/why-do-some-covid-19-patients-infect-many-others-whereas-most-don-t-spread-virus-all">https://www.sciencemag.org/news/2020...
Background: The # of cases that each case gives rise to is the reproductive number R. The *average* number for #COVID19 is estim to be b/w 2&3 (but higher and lower estimates have been reported).
But the average is deceiving. Majority of cases infect no one; a few infect many!
But the average is deceiving. Majority of cases infect no one; a few infect many!
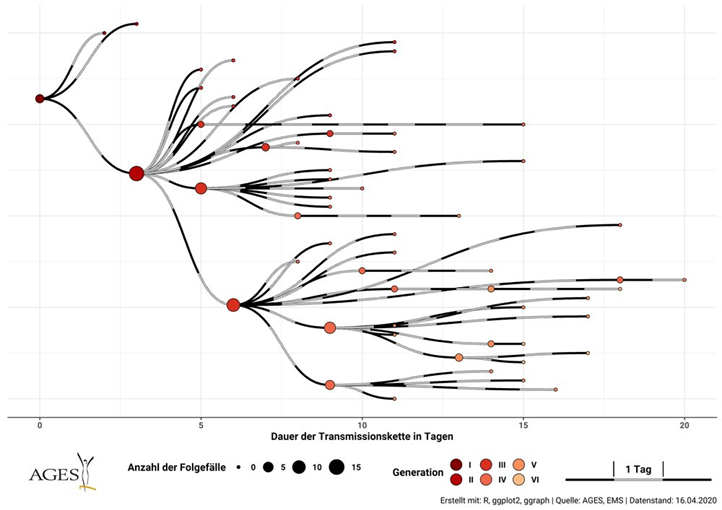
Here& #39;s a very nice illustration of this from Austrian outbreak ( https://twitter.com/kakape/status/1262869552163160067)
Each">https://twitter.com/kakape/st... infected person is a circle; red if they transmit to anyone, blue if they don& #39;t.
57 infections:
41 or 72%! of individ R=0 dead-ends (blue):
16 red R=1-10 (10 twice!)
Each">https://twitter.com/kakape/st... infected person is a circle; red if they transmit to anyone, blue if they don& #39;t.
57 infections:
41 or 72%! of individ R=0 dead-ends (blue):
16 red R=1-10 (10 twice!)
We often describe this distribution of R values using a negative binomial distribution with mean value R=2-3 for COVID19 & "dispersion" parameter k (the lower the wider the dispersion or the higher the variance). Early estimate k=0.16 - highly variable! https://wellcomeopenresearch.org/articles/5-67 ">https://wellcomeopenresearch.org/articles/...
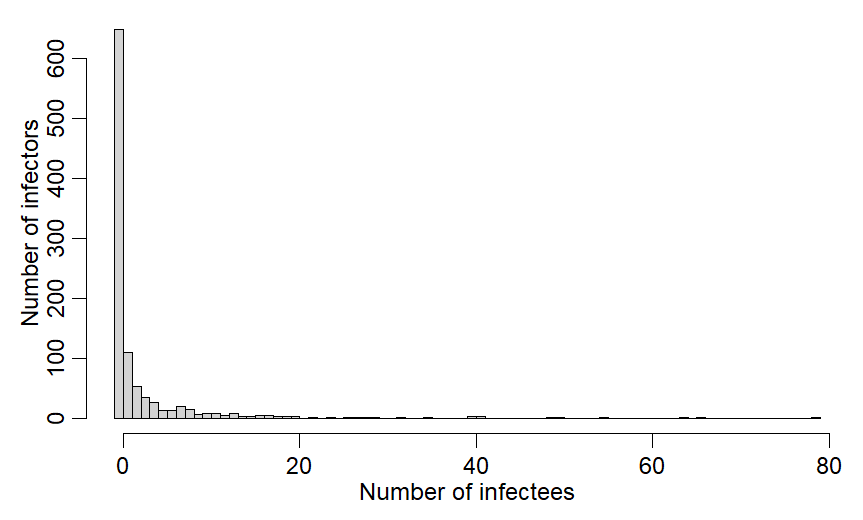
If we draw from NB distribution w/ mean 2.5 & k=0.16 we get fig:
64% of infectors spread to 0 infectees
9.5% to 1, 5.2% to 2 & so on
R code for fracs: dnbinom(0:3,mu=2.5,size=0.16)
In this draw 1 spreads to 80!!!
Clearly we& #39;d like to stop the 80!
64% of infectors spread to 0 infectees
9.5% to 1, 5.2% to 2 & so on
R code for fracs: dnbinom(0:3,mu=2.5,size=0.16)
In this draw 1 spreads to 80!!!
Clearly we& #39;d like to stop the 80!
Code for fig:
x=rnbinom(1000,mu=R0v,size=0.16)
hist(x,breaks=-1:(max(x)),main="",xlab="Number of infectees",ylab="Number of infectors")
x=rnbinom(1000,mu=R0v,size=0.16)
hist(x,breaks=-1:(max(x)),main="",xlab="Number of infectees",ylab="Number of infectors")
The question is how?
One thing many states & countries have done is cap # of people at events/gatherings. US used caps of 50,100. Childcare in CA now uses b/w 10-15. What effect would capped group sizes have on transmission/R?
Answer is a little more complicated than you think
One thing many states & countries have done is cap # of people at events/gatherings. US used caps of 50,100. Childcare in CA now uses b/w 10-15. What effect would capped group sizes have on transmission/R?
Answer is a little more complicated than you think
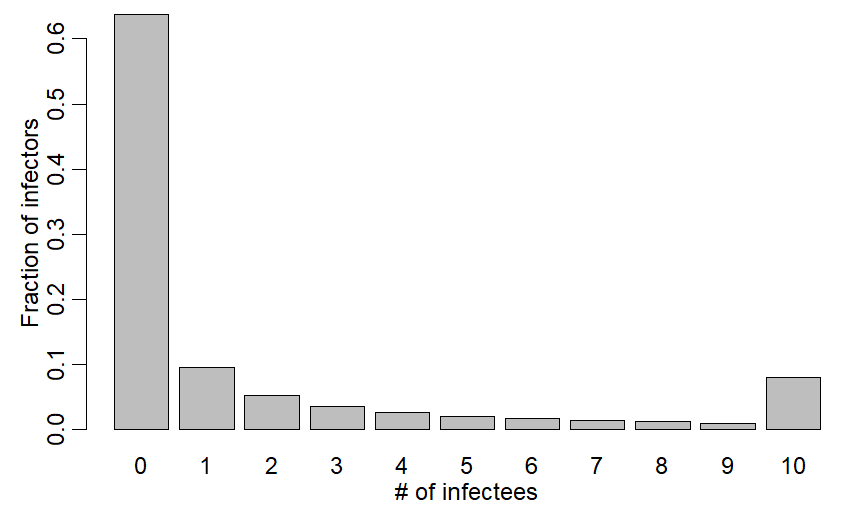
I thought that capping group size would lead to a bunch of Rs at max group size and same fraction as untruncated distribution at other values. That distribution w/ max group size=10 looks like fig w/ lump at 10:
R code for last tweet:
xv=c(dnbinom(0:9,mu=2.5,size=0.16),1-pnbinom(9,mu=2.5,size=0.16))
barplot((xv),xlab="# of infectees",ylab="Fraction of infectors",names.arg=0:10)
xv=c(dnbinom(0:9,mu=2.5,size=0.16),1-pnbinom(9,mu=2.5,size=0.16))
barplot((xv),xlab="# of infectees",ylab="Fraction of infectors",names.arg=0:10)
But two preprints have now been posted that examine this strategy, which has been called "chopping/cutting the tail", by @MPKain @morde @joel_c_miller @BMAlthouse @svscarpino
Both model things a different way.
https://www.medrxiv.org/content/10.1101/2020.06.30.20143115v1.full.pdf
https://www.medrxiv.org/content/1... href=" https://arxiv.org/abs/2005.13689 ">https://arxiv.org/abs/2005....
Both model things a different way.
https://www.medrxiv.org/content/10.1101/2020.06.30.20143115v1.full.pdf
In both papers, instead of my method of assuming all values of R >max group size = max group size, they draw from a distribution of R values that EXCLUDES values bigger than max group size. In other words rather than values of 14 becoming 10 (me), they redraw R until R is <=10.
R code for resampling method from @BMAlthouse
https://arxiv.org/abs/2005.13689
(revised">https://arxiv.org/abs/2005.... to use Ravg=2.5)
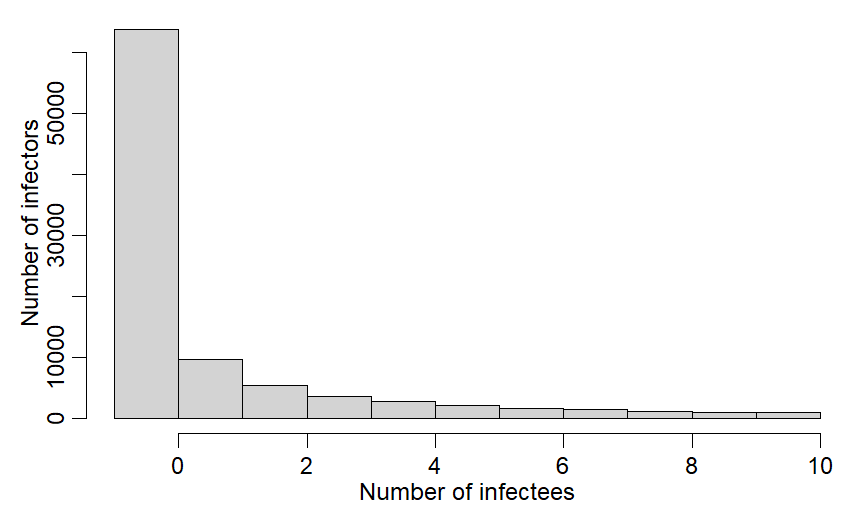
ss=100000
R0dist = rnbinom(ss, mu=2.5, size=0.16)
R0dist = R0dist[R0dist <=10]
sum(R0dist <=10)/ss
~8.5% of R vals are >10 & get excluded
https://arxiv.org/abs/2005.13689
(revised">https://arxiv.org/abs/2005.... to use Ravg=2.5)
ss=100000
R0dist = rnbinom(ss, mu=2.5, size=0.16)
R0dist = R0dist[R0dist <=10]
sum(R0dist <=10)/ss
~8.5% of R vals are >10 & get excluded
(If you& #39;ve made it congrats! Math,stats&R are fun!)
Why does it matter?
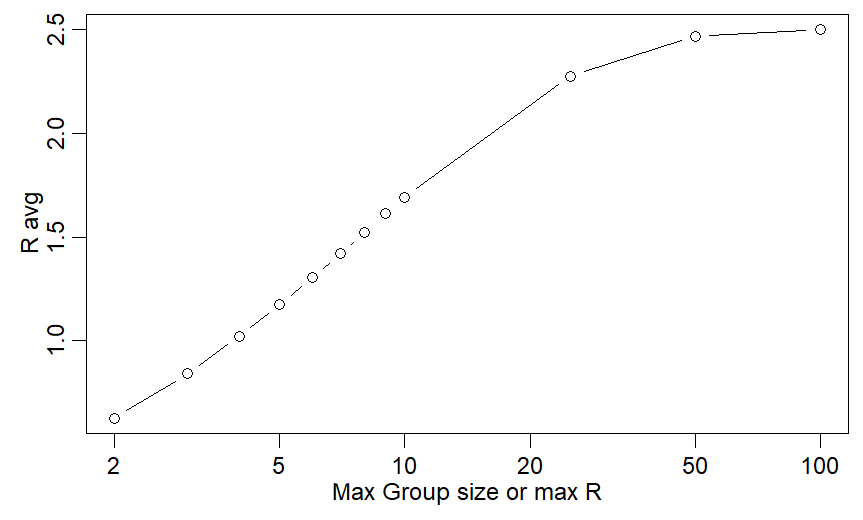
Because the average of all the individual Rs for the two methods are actually VERY different!
For max R=10:
My method gives Ravg=1.87
Theirs: 1.05
I need max R=4 to get Ravg close to 1.05 (fig)
Why does it matter?
Because the average of all the individual Rs for the two methods are actually VERY different!
For max R=10:
My method gives Ravg=1.87
Theirs: 1.05
I need max R=4 to get Ravg close to 1.05 (fig)
Translation: if I& #39;m right, max group size of 10 doesn& #39;t control COVID19! Ravg is still almost 2 and infections ~double every 4-6d.
If they are right, w/ Rmax=10, Ravg is just barely above 1 and cases are mostly stable - 5% growth/5d.
If they are right, w/ Rmax=10, Ravg is just barely above 1 and cases are mostly stable - 5% growth/5d.
Which is correct? Depends on how transmission works & how much variation there is in susceptibility. Work by @mgmgomes1 @mlipsitch et al say huge variation! If correct, then in a group of 10 it& #39;d be unlikely that 10 get infected so R=10 rare. I& #39;d be wrong. http://doi.org/10.1101/2020.04.27.20081893">https://doi.org/10.1101/2...
But if variation is less then if one person at a party w 10 people is v infectious they will infect all 10 (& would infect 20 if 20 were there!). If so, then I& #39;d be more right and much smaller max group sizes would be needed to keep transmission under control (Ravg<1).
One other key aspect missing so far is that the individual values of R are over the whole infectious period, so group size limitations wouldn& #39;t actually limit individ R to <max group size. Best example is S korea nightclubs where infected individs went to multiple nightclubs.
How would this aspect influence max group size measures? Depends on variation in daily infectiousness for each case. If people are especially infectious on only 1-2 days then max group sizes might approx cap individ Rs. If not, then individ Rs could be larger than max group size.
Many schools this fall are going to try "cohorting" where a single group of students and a teacher (or a few) stick together. If there is transmission this should produce some data that could be used to address this question.
Let& #39;s hope I& #39;m wrong and reasonable group sizes are sufficient to keep Ravg<1. If not, then there will be little room for multiple household close gatherings.
Thx to @BMAlthouse for email exchange (that I decided to share here after reading 2nd paper on this topic)
Thx to @BMAlthouse for email exchange (that I decided to share here after reading 2nd paper on this topic)
Thx also to @jlloydsmith whose great early work on this is unfortunately so relevant:
doi:10.1038/nature04153
doi:10.1038/nature04153

 Read on Twitter