1/n I& #39;ve been asked a few times about the math in this recent Science paper, so here& #39;s a thread to help unpack it: A mathematical model reveals the influence of population heterogeneity on herd immunity to SARS-CoV-2 https://science.sciencemag.org/content/early/2020/06/22/science.abc6810">https://science.sciencemag.org/content/e...
2/n Background: the reproduction number R0 for a disease is how many individuals are infected, on average, by an infected individual, in a fully susceptible population without mitigation measures.
3/n To keep the disease from spreading in a population, the fraction of susceptible individuals has to be reduced by a factor 1/R0 to exactly balance out the new infections. That means that if a fraction 1-1/R0 were immune (vaccinated or recovered), the disease would peter out.
4/n This is the "herd immunity" concept. For COVID-19 with R0~2.5 & no vaccine, herd immunity requires many cases & deaths before the disease would run its course: 60% need to be immune before reaching herd immunity (& roughly ~30% more are infected as the disease peters out).
5/n But this assumes that all are equally at risk. If some individuals have more contacts and are more interactive, due to work, family obligations or personality, they& #39;re more central to disease spread than individuals who are less out and about.
6/n The Britton et al. paper explores the impact of this heterogeneity in contact rates on the total number of cases needed to stop the disease. Let& #39;s simplify to help understand.
7/n The biggest effect occurs if some individuals move a lot and others not at all. If we could vaccinate those most active first, then we would only need a fraction 1-1/R0 of these active people to be immune to stop the disease. That is a lot fewer cases: freq(active)*(1-1/R0).
8/n Vaccination programs that aim first to immunize those with lots of contacts and risks – healthcare & essential service workers – follow this principle. They help protect them & us.
9/n Let& #39;s call this "influencer immunity" rather than "herd immunity". The key point of Britton et al is that mitigation measures that still allow the disease to spread disproportionately lead to immunity amongst the most active community members, providing influencer immunity.
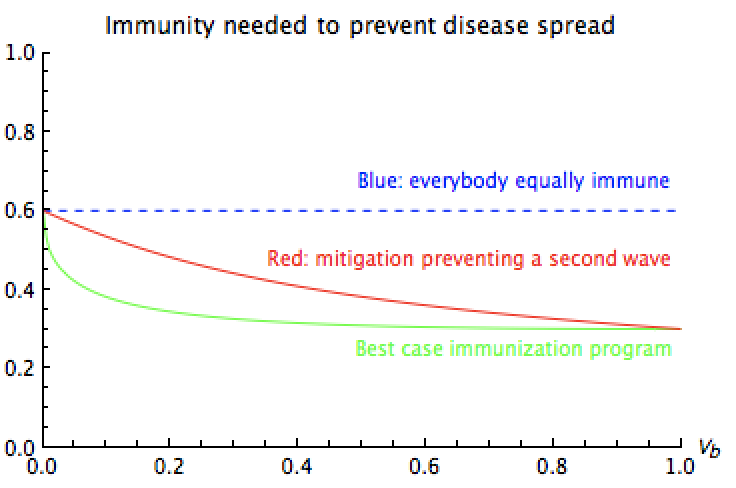
10/n Here& #39;s an illustration of the fraction of immunity needed to cause the disease to die out, assuming 50% more active & 50% less active people. x-axis describes the variance btwn the groups& #39; activity levels. Blue curve shows standard herd immunity (everybody equally immune).
11/n Red shows influencer immunity following mitigation that just prevents a second wave (influencers are more likely to have been sick). Green: best case if we could immunize influencers first. Here& #39;s a link describing the math for this two-category model https://www.zoology.ubc.ca/~otto/Research/Britton/">https://www.zoology.ubc.ca/~otto/Res...
12/n Some interesting points: The mitigation level needed to just avoid a second wave seems pretty insensitive to heterogeneity in activity (good - because this is often poorly known). More realistic cases with a range of activity levels (not just two) make less of a difference.
13/n Heterogeneity in activity helps for two reasons: it reduces the immunity needed to stop the disease from spreading, and it reduces the number of cases that happen after this point (because the most active people are often already affected).
14/14 Flattening the curve helps for several reasons too: fewer individuals get sick, we get closer to influencer immunity rather than herd immunity, and we buy time for vaccines to take us the rest of the way past this devastating disease.

 Read on Twitter


