Here& #39;s a thread about SQ802.
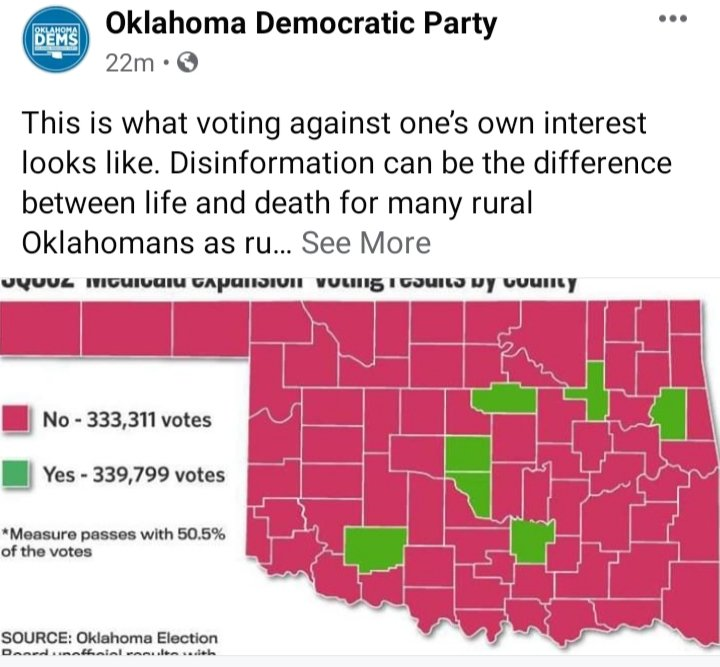
This all started when @OkDemocrats pissed me off with this childish interpretation of the vote. Petty even in victory, these bozos are.
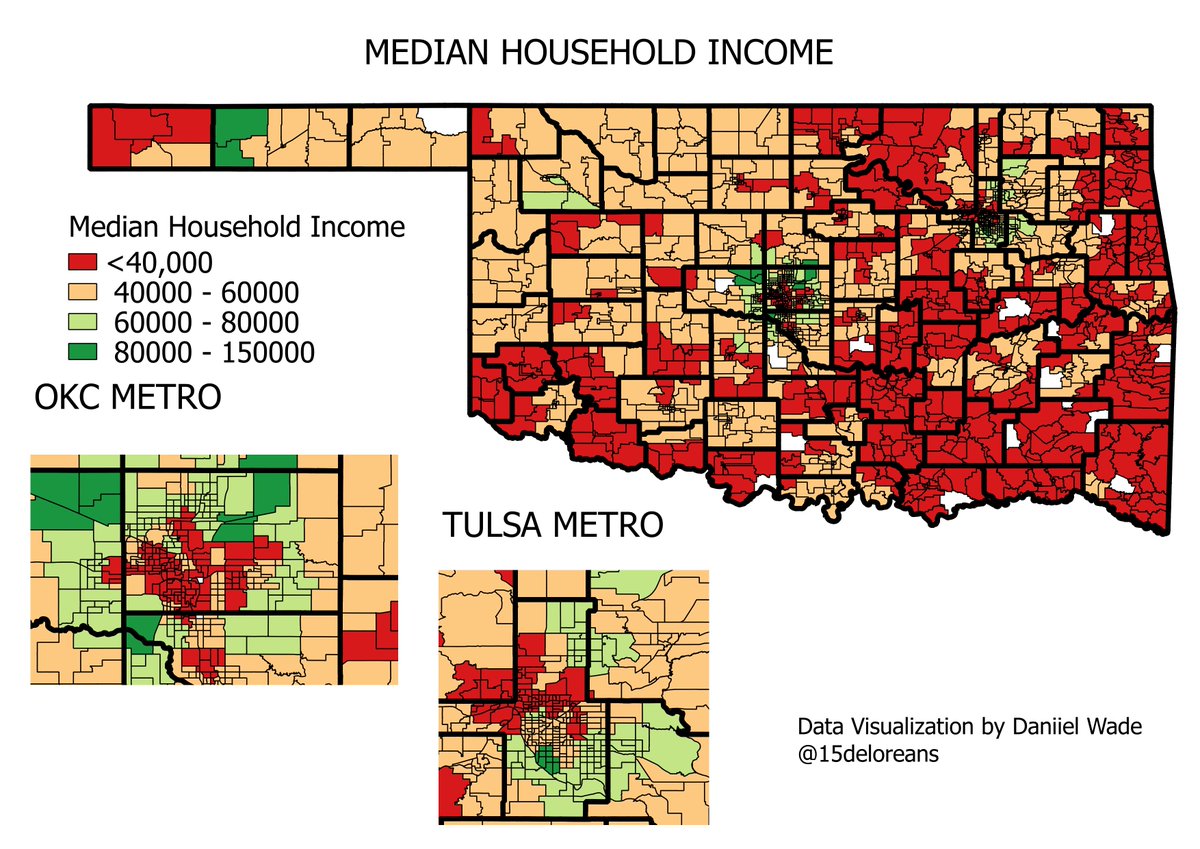
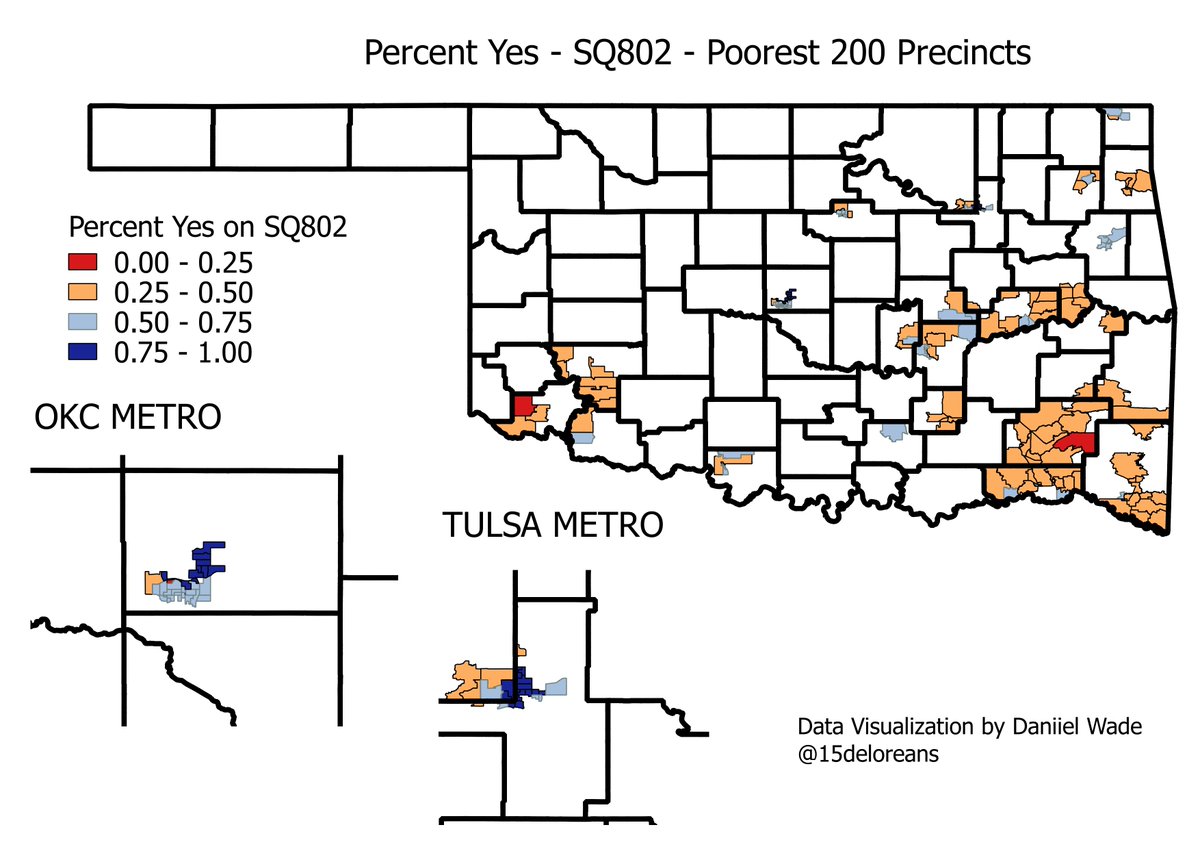
I started with income data from the census. From this, I used a closest-centroid method and came up with median household income for each precinct. Not perfect, but pretty good. There are about 10 precincts with gaps in the data (showing as white). Deal with it.
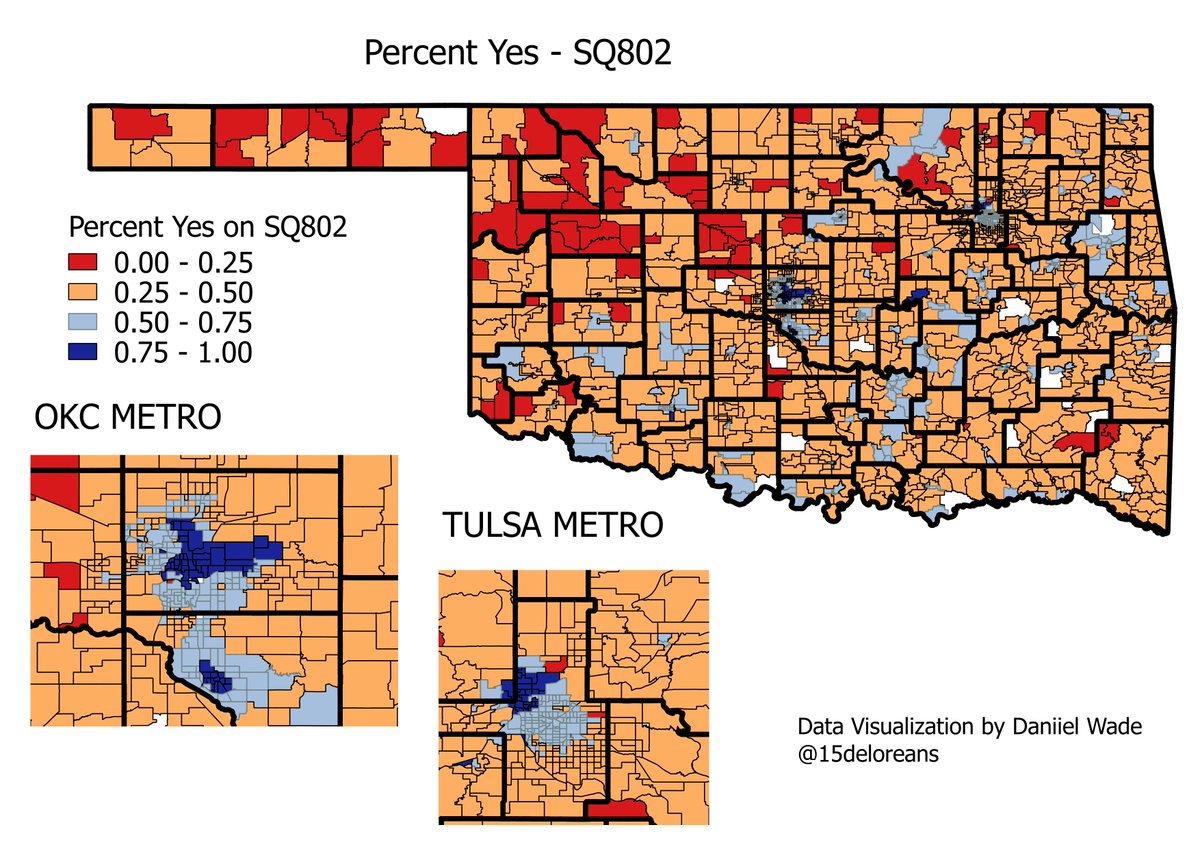
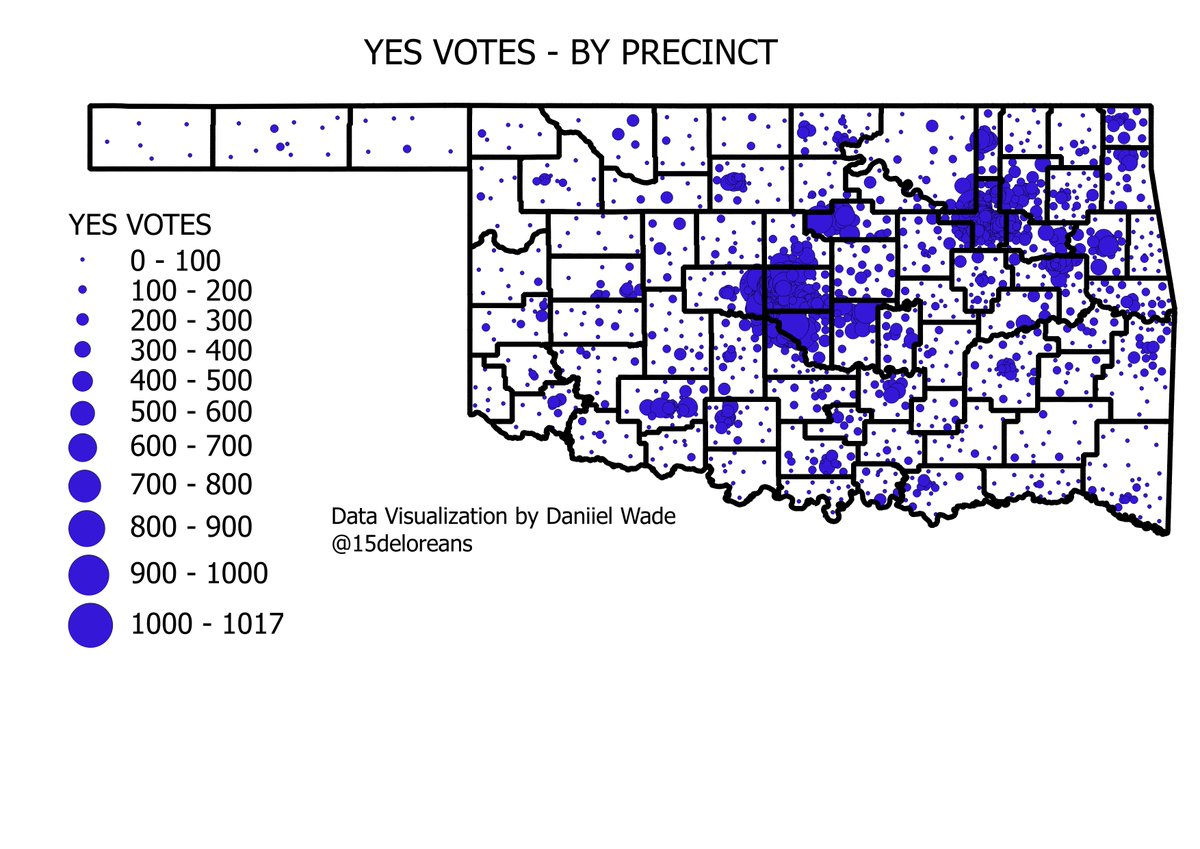
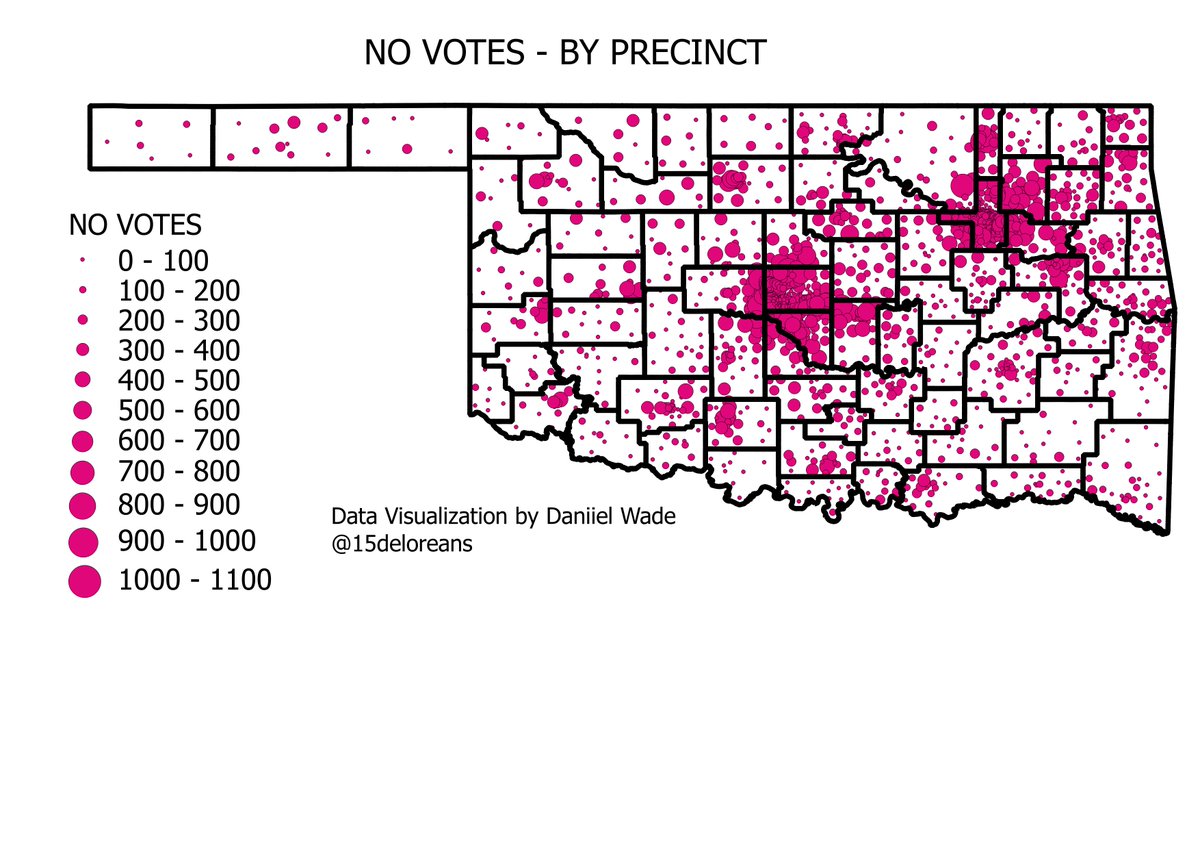
Next, I looked at precinct-level data for SQ 802. Again with the missing precincts, but I& #39;m too busy to debug.
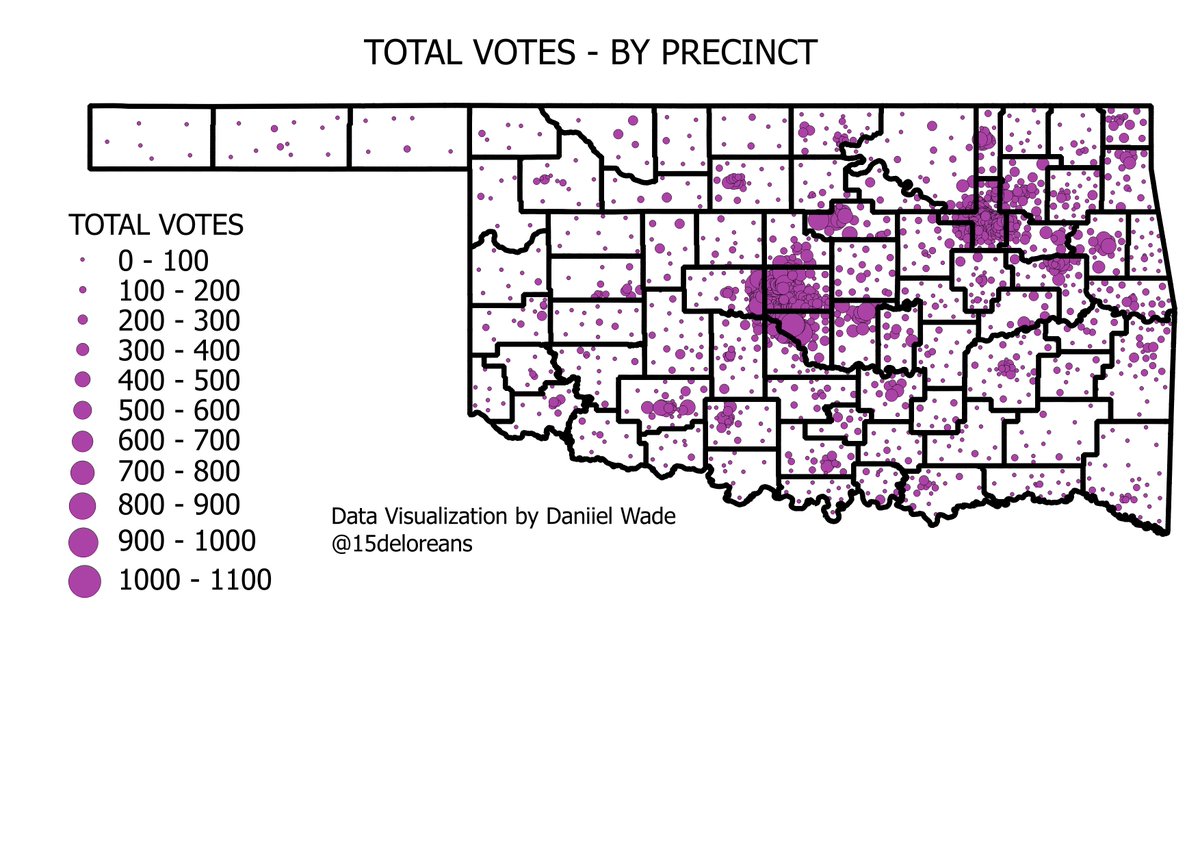
Dirt don& #39;t vote, as they say. So here is total number of voters who showed up at each precinct:
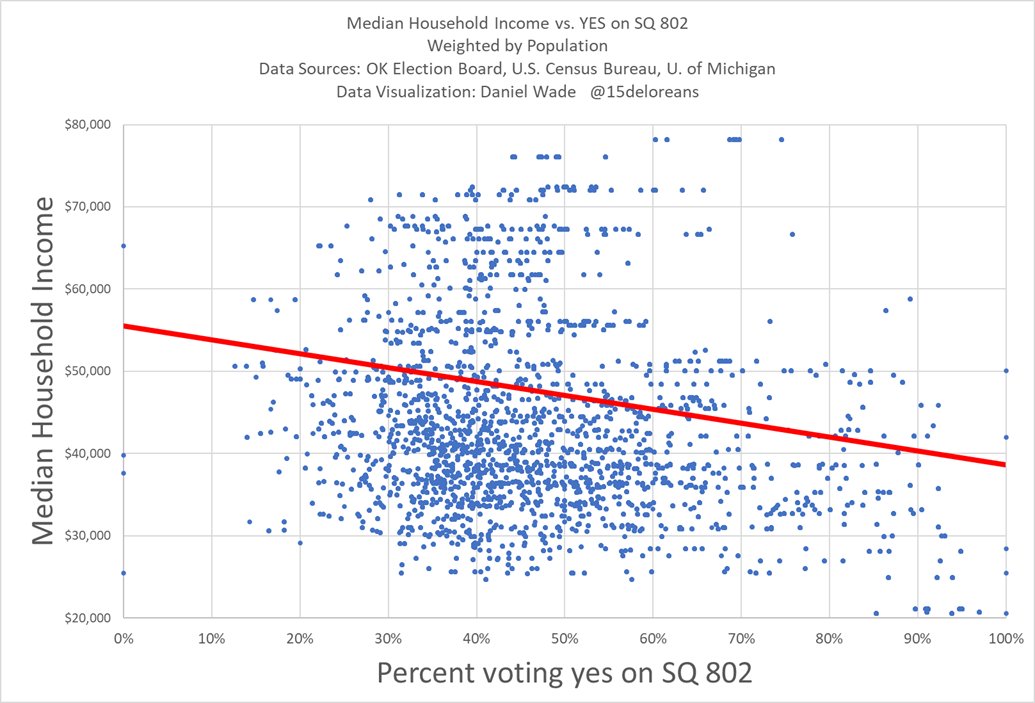
Finally, I made a trend line comparing % yes and Median Household Income. I weighted this graph by turnout - large precincts skewed heavier. As the red trend line indicates, there is a strong correlation between high income and voting NO.
In short, there are TONS of no voters in the metro - and there are enough yes voters in the country to push this state question over 50%. And portraying this as "dumb hicks voting against their own interest" is a message that @OkDemocrats needs to stop ASAP.
PS - check out my Randy Newman podcast ---- @WheelOfRandy

 Read on Twitter