As I tweeted 2 days ago, this week I& #39;ve collated local statistics, including by Constituency, Local Authority & Region. Included is:
Pop. density, health, deprivation, age, gender, ethnicity, deaths due to COVID & more.
THREAD (sheet in final tweet) https://twitter.com/0liver_03/status/1278429486611136513?s=20">https://twitter.com/0liver_03...
Pop. density, health, deprivation, age, gender, ethnicity, deaths due to COVID & more.
THREAD (sheet in final tweet) https://twitter.com/0liver_03/status/1278429486611136513?s=20">https://twitter.com/0liver_03...
I did say that I would be posting charts with the data, but I& #39;ve decided to only post a few (although there are some others included in the spreadsheet). I& #39;d rather people create their own charts based on the data to suit their own interests/needs.
2/
2/
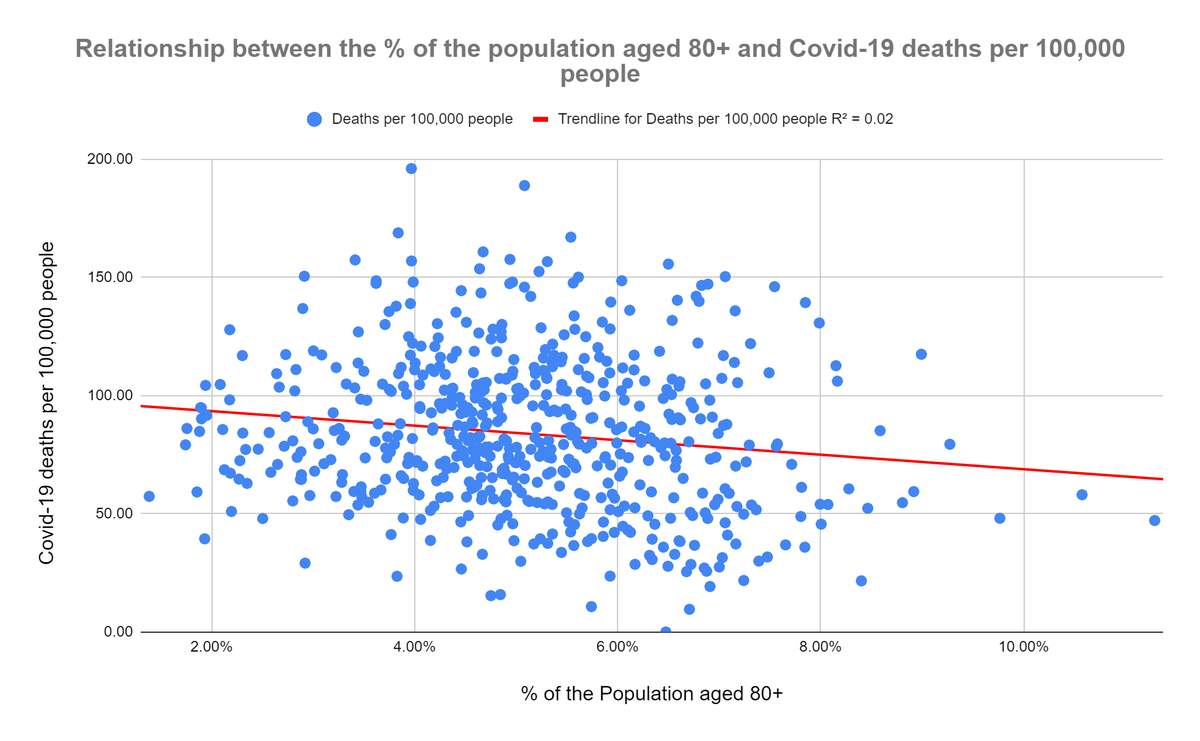
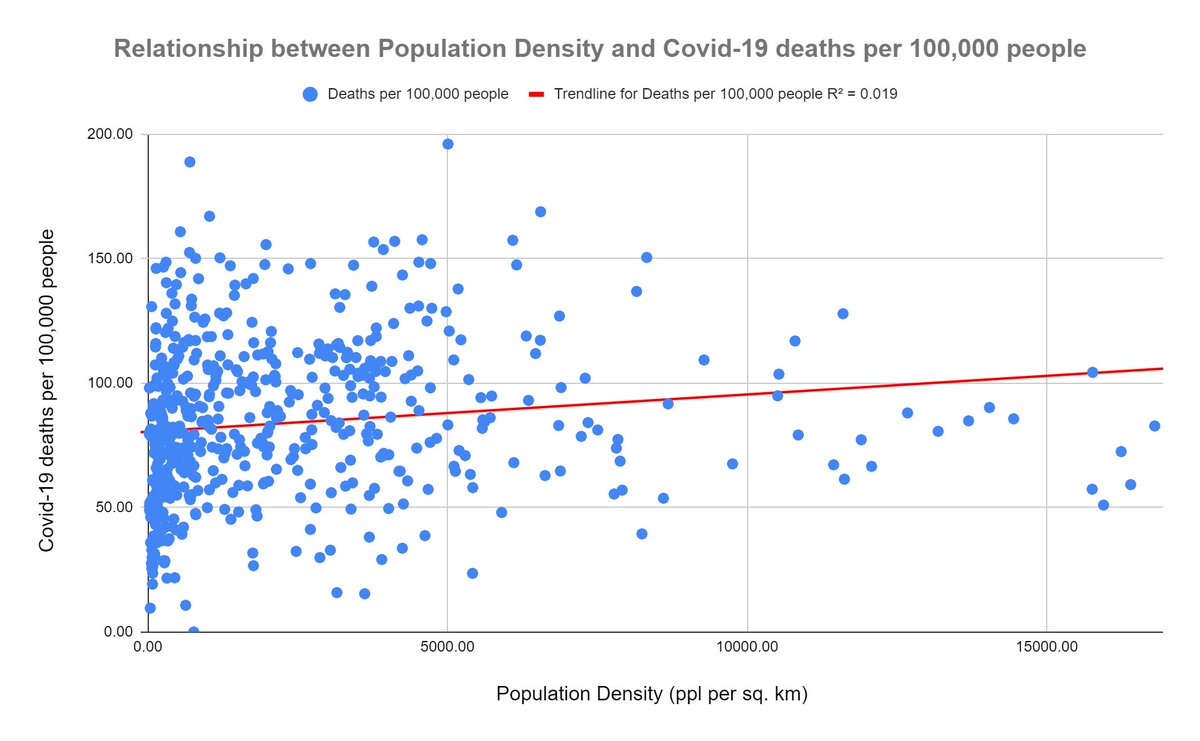
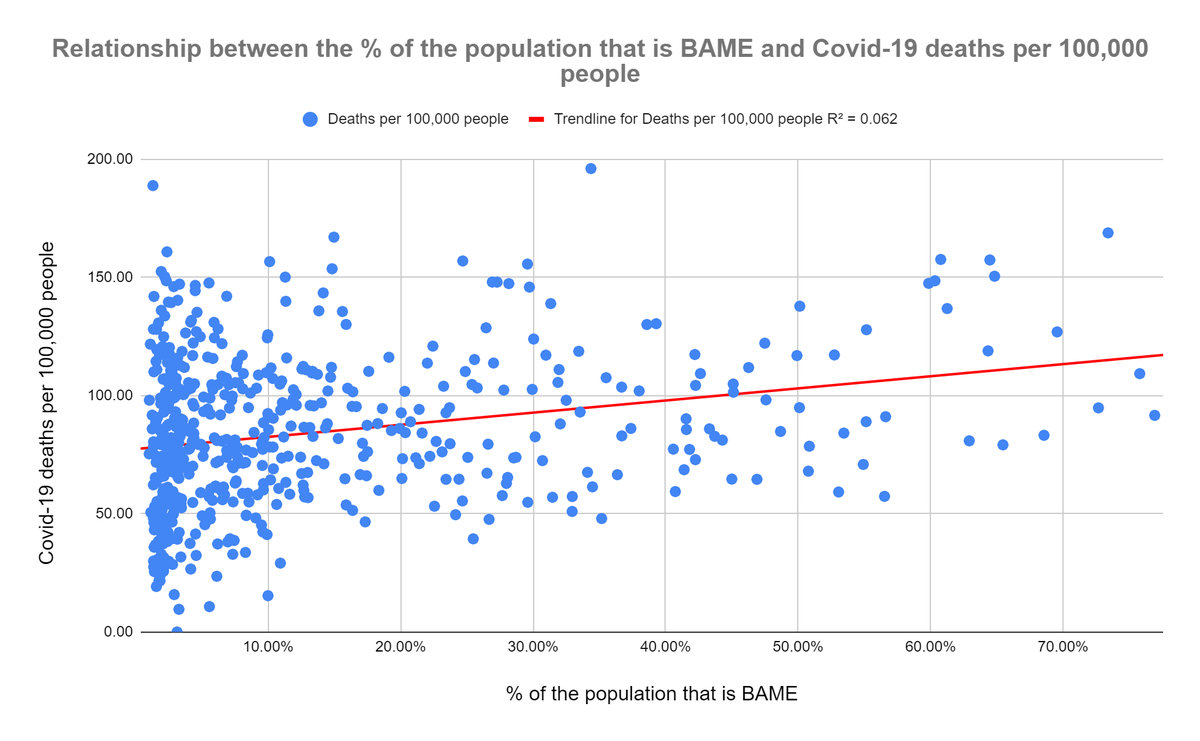
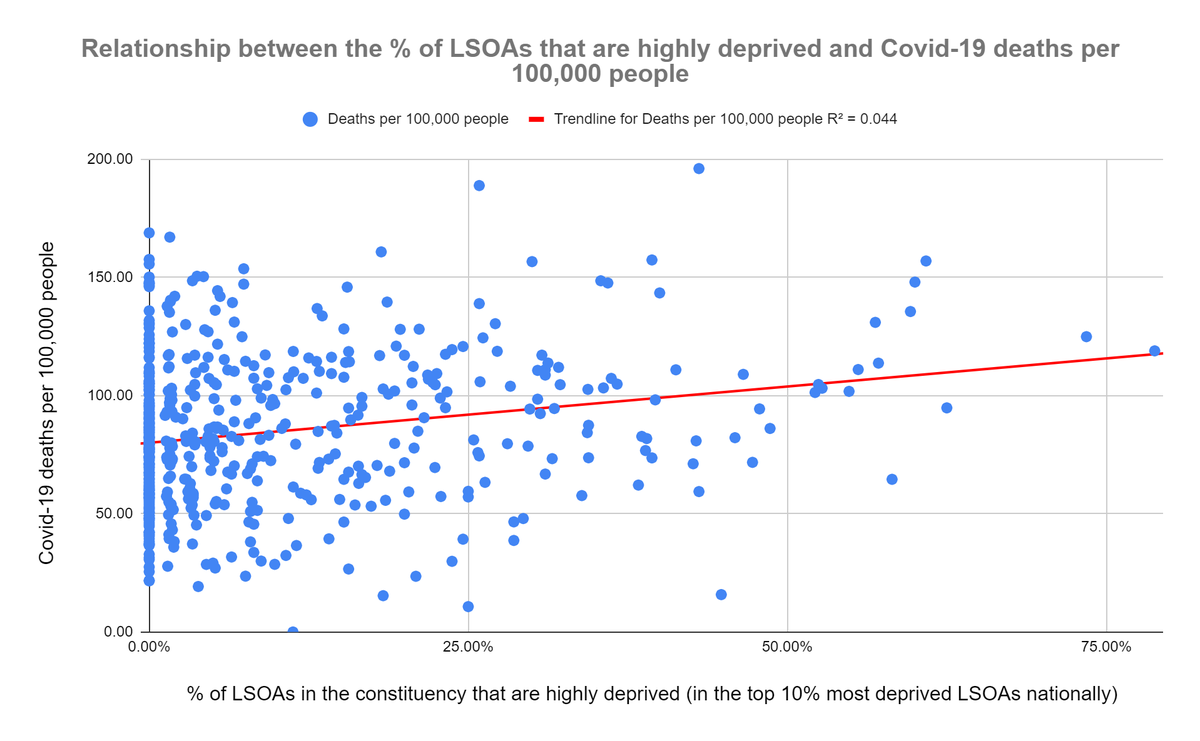
One of the most interesting things that I found with the data is that there doesn& #39;t seem to be one single large risk factor that determines whether an area is hit hard by Covid or not. In fact, many of the correlations are very weak, and some are surprising.
3/
3/
For example, while the correlations are *extremely* weak, the data suggests that Covid-19 deaths may be lower in areas with older populations. This could be due to ppl in these areas successfully shielding, or it could be because the areas share something else in common.
4/
4/
Additionally, as the saying goes correlation does not mean causation, so it could be a complete coincidence. What I think the data does suggest, though, is that almost every area has the potential to be hit a lot harder than it has, so caution is still very much necessary.
5/
5/
Why do I say that?
The Constituency with the highest number of C-19 deaths is Brent North w/ 230. Brent North has a pop. of 136k. Assuming that 23k have already been infected, the threshold for herd immunity is 60% & the IFR is 1%, there& #39;s the potential for 586 more deaths.
6/
The Constituency with the highest number of C-19 deaths is Brent North w/ 230. Brent North has a pop. of 136k. Assuming that 23k have already been infected, the threshold for herd immunity is 60% & the IFR is 1%, there& #39;s the potential for 586 more deaths.
6/
Obviously, in reality, it& #39;s not as simple as that, but it& #39;s fairly obvious (to me at least), that this disease could hit us a lot harder in the future, so we need to keep being sensible and do everything possible to ensure that we don& #39;t let the virus have a resurgence.
7/
7/
So moving back, the data suggests to me (of course others may very well come to different conclusions, after all, I& #39;m not a data scientist) that how hard an area is hit is determined by a combination of factors, not just one.
8/
8/
Like I said earlier, there are some weak correlations between individual factors & deaths, but nothing that jumps out. Instead, it could be that if an area has a high pop. density, has a large BAME population & is deprived, they have more chance of being hit hard.
9/
9/
These correlations are *very* weak indeed and therefore, you can& #39;t say anywhere near conclusively that they affect the number of Covid-19 deaths in an area. However, do these factors combine? Maybe. I& #39;m releasing all the data so people can form their own ideas.
10/
10/
For those that may not have the time to look at the spreadsheet in any great detail, please feel free to request any charts and I can either DM them to you or reply to a comment on this thread. Likewise if you& #39;d like to know the statistics for your area, let me know.
11/
11/
Here is the spreadsheet: https://docs.google.com/spreadsheets/d/1JHWlZzEl-6poLC_qecRmcSTxjO9Y-Nk8HK0s1K7EADk/edit?usp=sharing
If">https://docs.google.com/spreadshe... you have any questions, requests, or suggestions, pls either reply or DM.
Also, if you find anything interesting, pls also let me know. I& #39;m not a data scientist, so I may have things wrong. Lmk if so!
ENDS.
If">https://docs.google.com/spreadshe... you have any questions, requests, or suggestions, pls either reply or DM.
Also, if you find anything interesting, pls also let me know. I& #39;m not a data scientist, so I may have things wrong. Lmk if so!
ENDS.

 Read on Twitter


