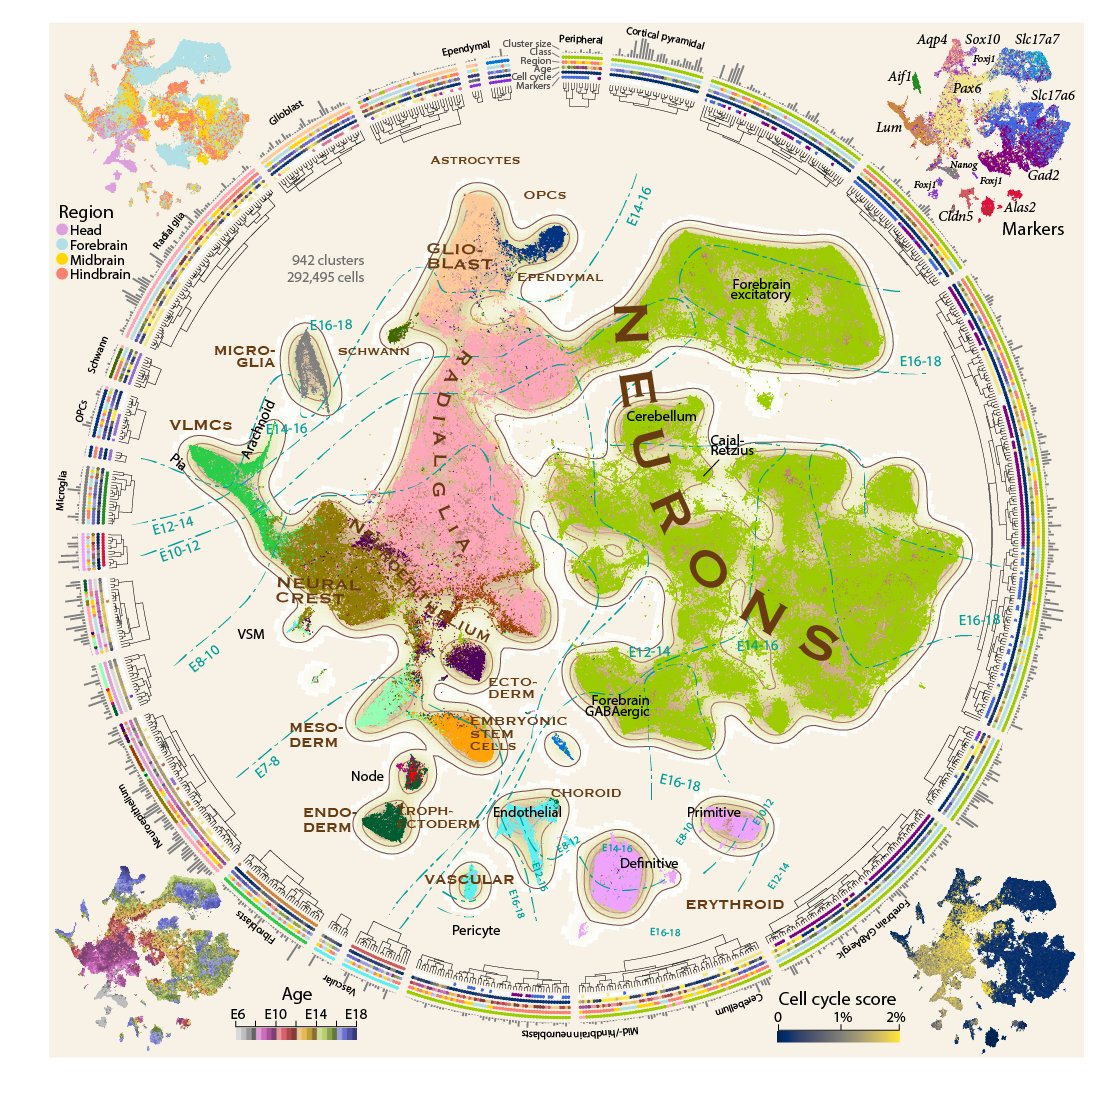
Proud to present a comprehensive single-cell atlas of the developing mouse brain from E7 to E18, a total of 292,495 single-cell transcriptomes and 942 distinct clusters. A heroic effort led by @GioeleLaManno and @kimsiletti with Alessandro Furlan 1/n
Our work is nicely complementary to a paper on cortical development by @macosko Aviv Regev and @ArlottaLab, led by @DanielaJDiBella and @ehshabibi also out today https://www.biorxiv.org/content/10.1101/2020.07.02.185439v1">https://www.biorxiv.org/content/1... 2/n
Development is complex, so we faced a tough challenge: how do you simultaneously visualize discrete clusters and their relationships, gestational time, differentation trajectories, spatial location, proliferation status and marker gene expression? 3/n
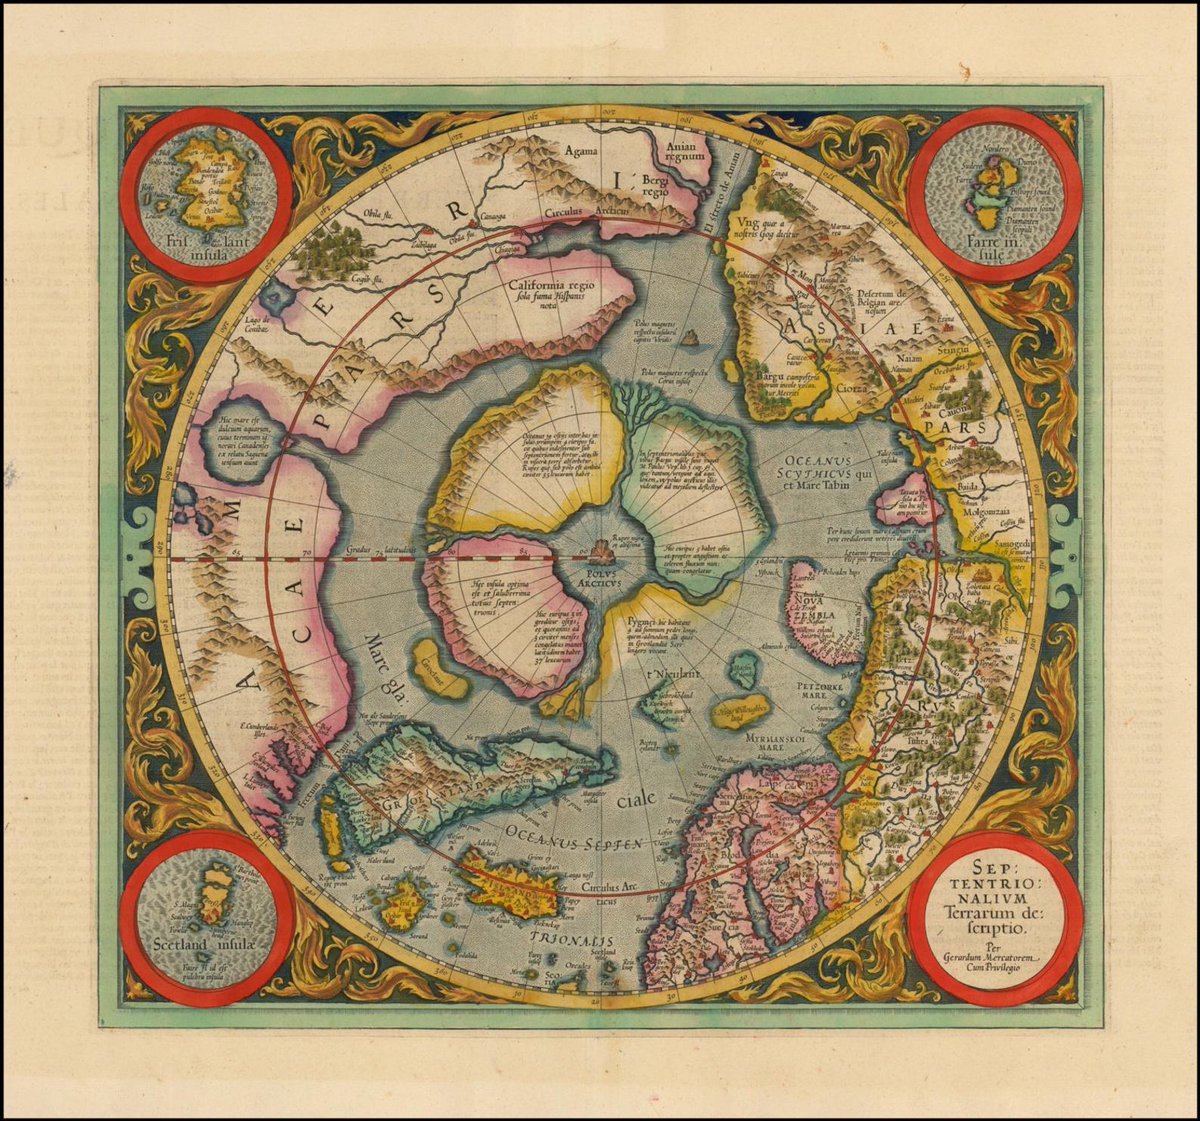
Inspired by old maps of the earth, we made a figure in the style of an actual atlas, with isocurves for gestational time. We used the circumference to show a dendrogram of all clusters, and the corners to show additional information. 4/n.
Peter Lönnerberg made an interactive version of the figure at http://mousebrain.org"> http://mousebrain.org (very soon!), where you can simultaneously explore the cluster dendrogram and the tSNE of all cells, and browse gene expression, auto-annotation and other metadata. 5/n
Our paper begins where the beautiful single-cell atlas of mouse gastrulation by @BPijuanSala, @MarioniLab and Berthold Göttgens ( https://www.nature.com/articles/s41586-019-0933-9)">https://www.nature.com/articles/... ended, just as neurulation starts at E7 with the early spatial patterning of the neural tube. 6/n
From that point on, coordinated waves of specialized cell types - neuroepithelial cells, neural crest, radial glia, neuroblasts, neurons, glioblasts, OPCs, fibroblasts and vascular cells - build the brain. 7/n
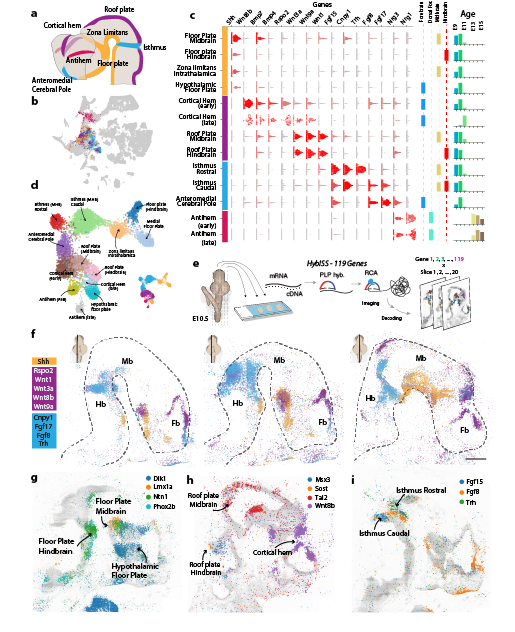
Around E9-E11, secondary organizers induce the architecture of the brain. Elin Vinsland, Irina Khven and the excellent team from @MatsNilssonLab @dgyllborg Christoffer Mattsson Langseth mapped secondary organizers spatially using HybISS. 8/n
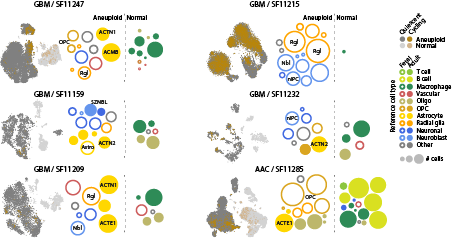
Atlases like these provide invaluable reference data for understanding human disease. We combined our developmental and adult ( https://www.cell.com/cell/fulltext/S0092-8674(18)30789-X)">https://www.cell.com/cell/full... atlases, and show that human glioblastoma acquires an embryonic transcriptional state resembling fetal glioblasts 9/n
All that and more, in the preprint at https://www.biorxiv.org/content/10.1101/2020.07.02.184051v1">https://www.biorxiv.org/content/1... Huge thanks to all co-authors! And special thanks to our funders @KAWStiftelsen, @strategiskaSSF, Erling-Persson Family Foundation, @ChanZuckerberg and @snsf_ch! 10/10

 Read on Twitter


