I want to talk about a toy model for reasoning about what viral genomics can and cannot tell us about #SARSCoV2 transmission.
Suppose viral isolates from two people have *identical* genotypes. How many transmission events separate them?
1/13
Suppose viral isolates from two people have *identical* genotypes. How many transmission events separate them?
1/13
The answer can vary widely by on chance (mutation is a random process after all).
But, more surprisingly, the range of variation depends a lot on the phase of the outbreak, in a way we can quantify.
2/13
But, more surprisingly, the range of variation depends a lot on the phase of the outbreak, in a way we can quantify.
2/13
First, the converse. If A directly infects B, then the probability that A and B have the same viral genotype is about p ≈ 0.7. This comes from the transmission rate (or generation time), which has mean 5.5 days, outracing the mutation rate, which has mean 12 days. 3/13
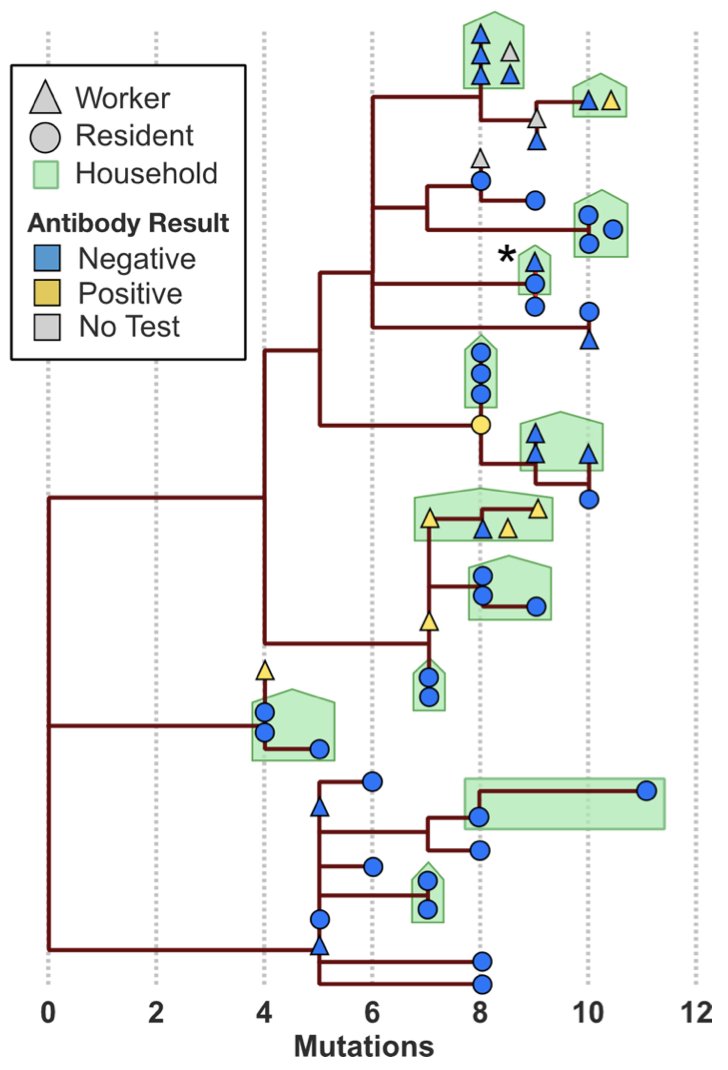
This estimate is borne out by household data. In the Mission study, for example, we found identical genotypes among infections of the same household in 11/17 = 65% of cases. 4/13
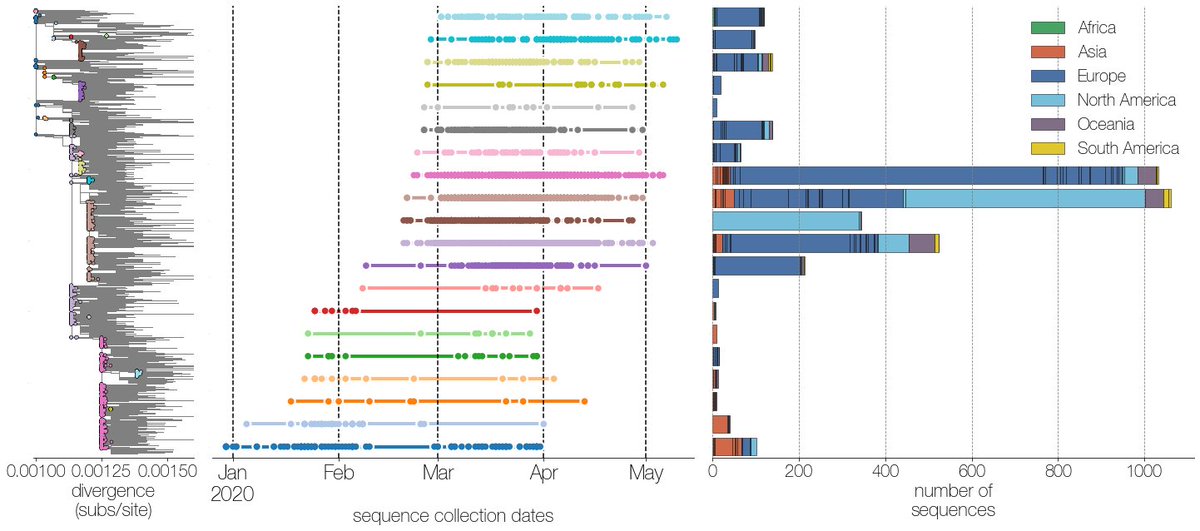
In contrast, those of us staring at @nextstrain trees of the global sequence data on @gisaid have noticed cases of single genotypes present in dozens of countries. For example, I found this when looking for potential introductions to Bangladesh 5/13 https://twitter.com/thebasepoint/status/1265120791709929472?s=20">https://twitter.com/thebasepo...
The original Wuhan-Hu-1 genotype has been seen in CA and Singapore as late as March, and this isn’t just reference bias. @evogytis identified at least 10 of these “giant genotypes”, which are present on multiple continents, in many countries, and persist for months. 6/13
The presence of giant genotypes can make geographical and transmission inference impossible. If a genotype is present in dozens of countries, and a descendent shows up in your city, you don’t have a clue where it came from. 7/13
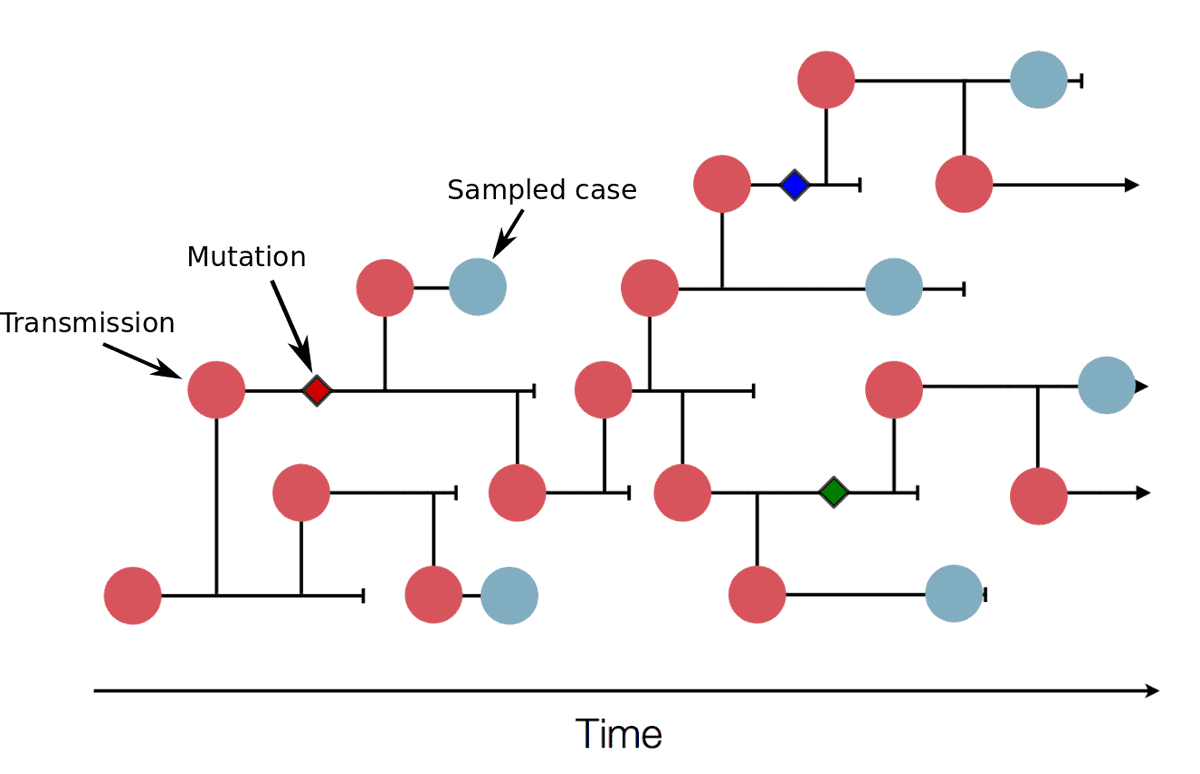
To understand why these giant genotypes occur, it helps to view the #COVID19 epidemic as a series of micro-outbreaks, one for each genotype. The reproductive number of each micro-outbreak is R*p, where p=0.7 is the probability of a transmission occurring before a mutation. 8/13
While R*p > 1, each genotype alone has pandemic potential; it can exhibit exponential growth, spreading around a city, country, or the whole world. With the additional layer of stochasticity created by superspreading, we find single genotypes infecting thousands of people. 9/13
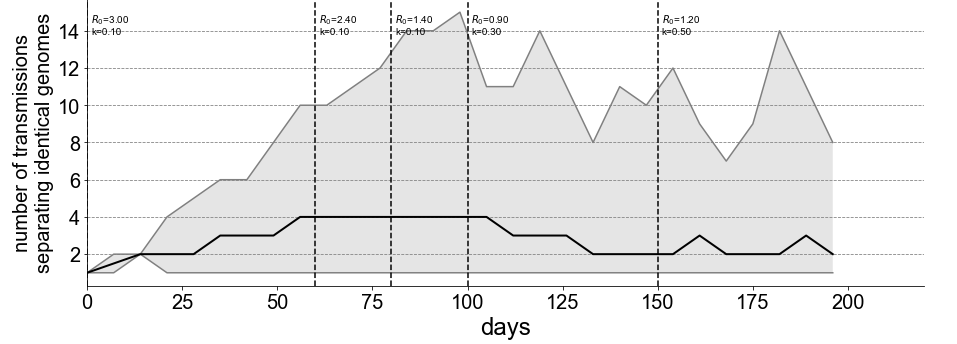
Once the epidemic cools off a bit to R < 1/p = 1.4, as happened when shelter-in-place, business closures, and mask usage were implemented, then each genotype will eventually die off. 10/13
We ran a simulation meant to show the effect of varying R on the informativeness of genomic data. As the epidemic cools, the median number of transmissions separating two samples with identical genotypes decreases from 4 to 2. 11/13
This is good news for molecular epidemiology. https://twitter.com/evogytis/status/1278024098258595842?s=20">https://twitter.com/evogytis/...
If you’re working on #SARSCoV2 genomic epi and have made similar observations or have questions or ideas about this or further analyses, we’d be very curious to hear!
13/13
13/13
PS: this also shows roughly why genomics helps estimate R, k, and other epi parameters. By breaking out cases into micro-outbreaks of individual genotypes, we turn one outbreak into many independent trials, a statistician& #39;s favorite thing.
Curious for thoughts from @XavierDidelot, @CarolineColijn, and others who have done proper Bayesian estimation for inferring transmissions from phylogenies. Do those frameworks work well in the presence of such massive polytomy?
Also worth saying that for me, seeing giant genotypes emerge as more sequencing was done really drove home the points made by @Chjulian, @BillHanage, & @DamienTully ( https://rdcu.be/b46ma )">https://rdcu.be/b46ma&quo... on the difficulty of doing phylogenetic inference during outbreaks.

 Read on Twitter


