1/ A few DCR charts:
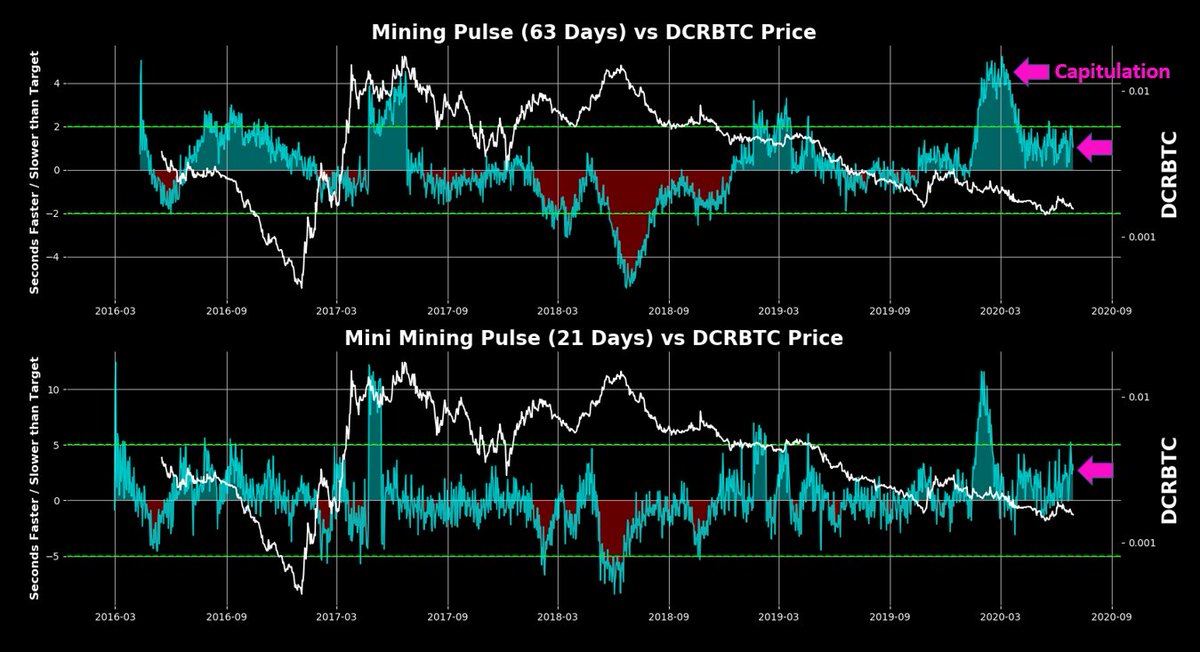
Mining Pulse was a tool made to track block time trends, reflecting the adjusted cost of mining
Color changes in the 63 day MP = historical trend reversals
Miners are large natural sellers, especially in smaller networks
MP 63 hasn& #39;t recovered yet
Mining Pulse was a tool made to track block time trends, reflecting the adjusted cost of mining
Color changes in the 63 day MP = historical trend reversals
Miners are large natural sellers, especially in smaller networks
MP 63 hasn& #39;t recovered yet
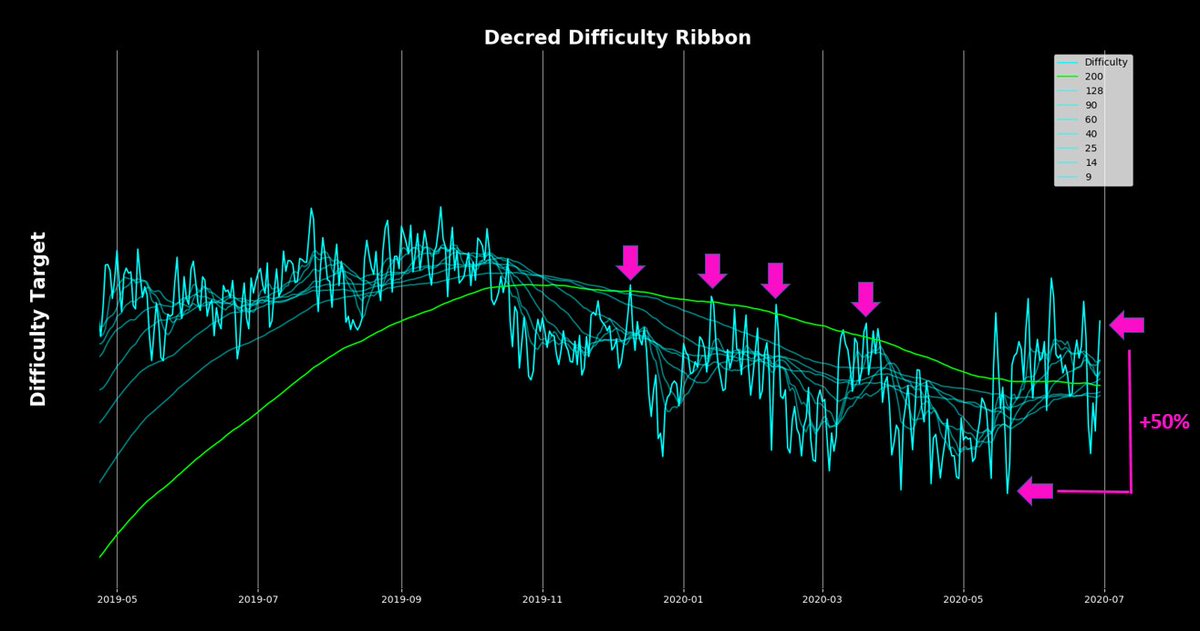
2/ Now for a zoomed in look at mining - the Difficulty Ribbons
DRs show the longer term trend for mining, providing rare but higher signal means to gauge mining capitulations
Difficulty is up 50% from the lows, which is a decent start - now want to see block times speed up
DRs show the longer term trend for mining, providing rare but higher signal means to gauge mining capitulations
Difficulty is up 50% from the lows, which is a decent start - now want to see block times speed up
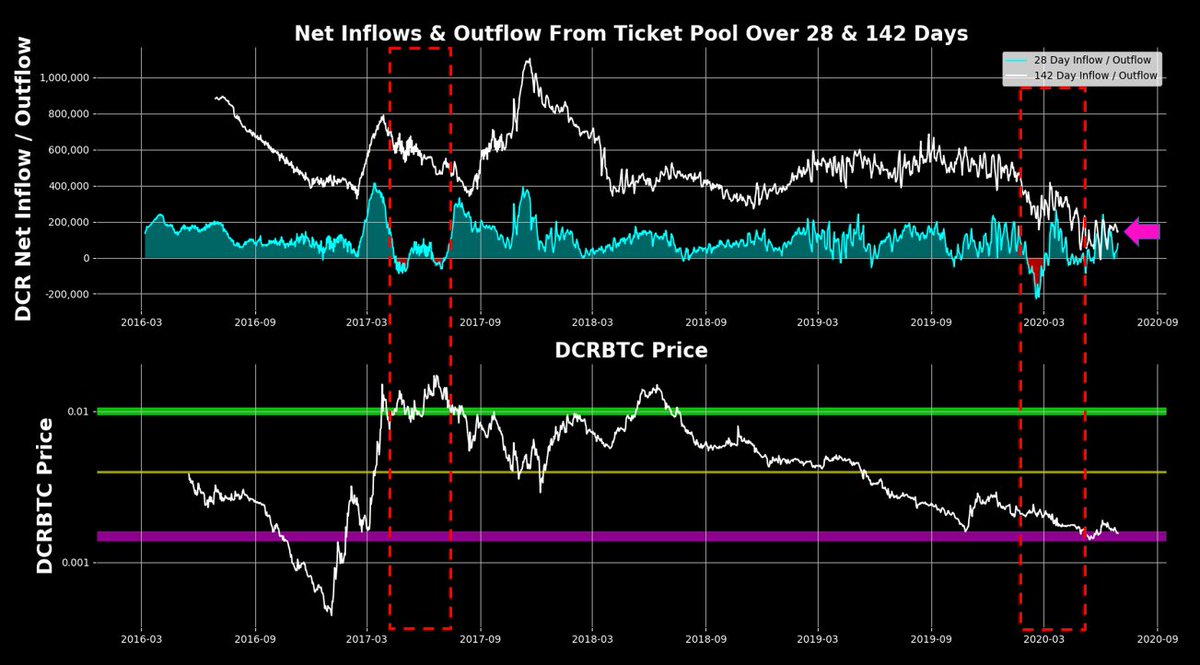
3/ 142 Day ticket pool DCR inflows have settled around 200k DCR, still supporting the notion that HODLers have settled back into tickets
Note the two red boxes, showing periods where large amounts of DCR exited tickets - DCRBTC bull market top, and early 2020
Note the two red boxes, showing periods where large amounts of DCR exited tickets - DCRBTC bull market top, and early 2020
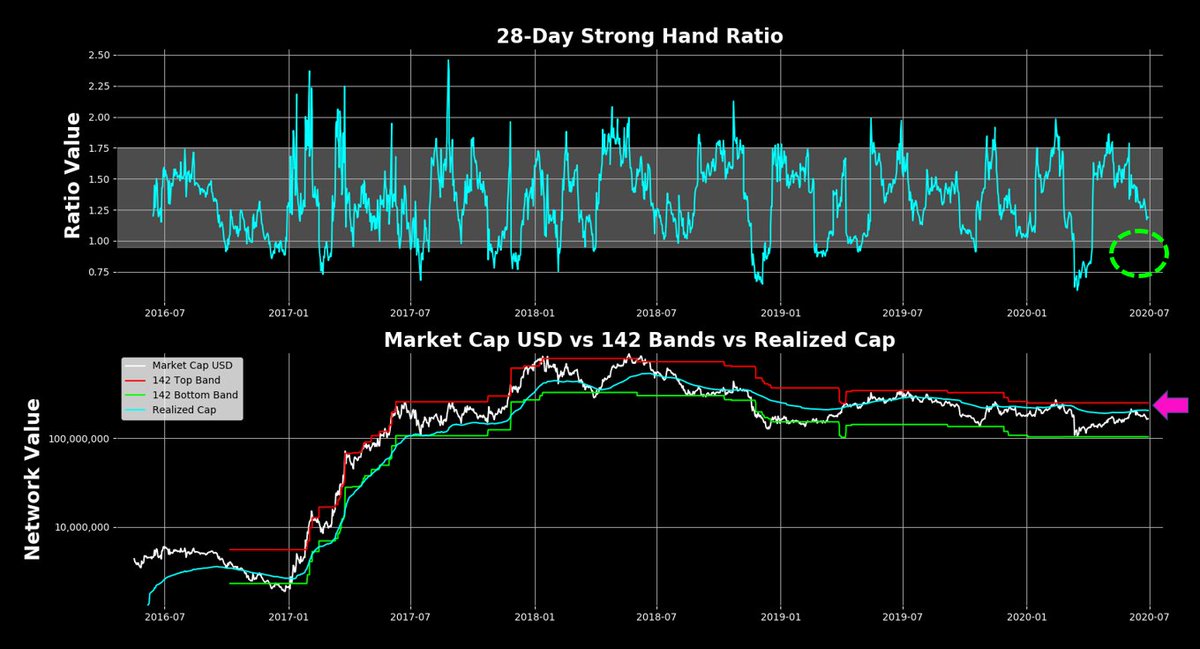
4/ Strong Hand toolset in simple terms shows us short / medium term appetite for DCR staking + provides an implied network value
28 day ratio is dribbling down to buy zone - which can only happen with price https://abs.twimg.com/emoji/v2/... draggable="false" alt="⬇️" title="Pfeil nach unten" aria-label="Emoji: Pfeil nach unten"> or ticket buying
  https://abs.twimg.com/emoji/v2/... draggable="false" alt="⬆️" title="Pfeil nach oben" aria-label="Emoji: Pfeil nach oben">
142 day strong hand implies overhead resistance
28 day ratio is dribbling down to buy zone - which can only happen with price
142 day strong hand implies overhead resistance
5/ In this thread we just analyzed the natural buyers of DCR (stakers) and natural sellers of DCR (miners)
Ideal on-chain conditions for explosive price moves would have mining data + staking data in harmony, mixing the perfect combination of little selling + heavy buying
Ideal on-chain conditions for explosive price moves would have mining data + staking data in harmony, mixing the perfect combination of little selling + heavy buying

 Read on Twitter


 or ticket buying https://abs.twimg.com/emoji/v2/... draggable="false" alt="⬆️" title="Pfeil nach oben" aria-label="Emoji: Pfeil nach oben">142 day strong hand implies overhead resistance" title="4/ Strong Hand toolset in simple terms shows us short / medium term appetite for DCR staking + provides an implied network value28 day ratio is dribbling down to buy zone - which can only happen with price https://abs.twimg.com/emoji/v2/... draggable="false" alt="⬇️" title="Pfeil nach unten" aria-label="Emoji: Pfeil nach unten"> or ticket buying https://abs.twimg.com/emoji/v2/... draggable="false" alt="⬆️" title="Pfeil nach oben" aria-label="Emoji: Pfeil nach oben">142 day strong hand implies overhead resistance" class="img-responsive" style="max-width:100%;"/>


