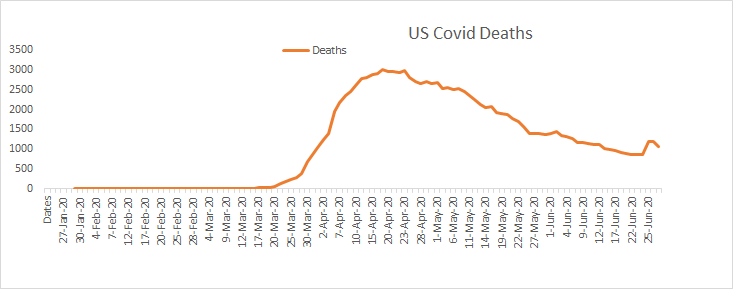
Okay, we start today w/ US Covid-19 latest confirmed, deaths, ratios (deaths/confirmed & deaths/confirmed a week ago) & growth of deaths & confirmed.
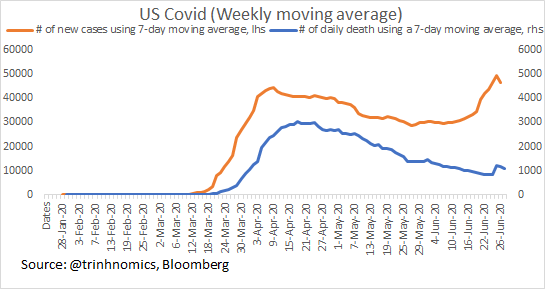
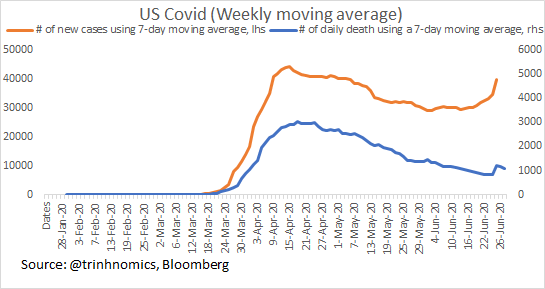
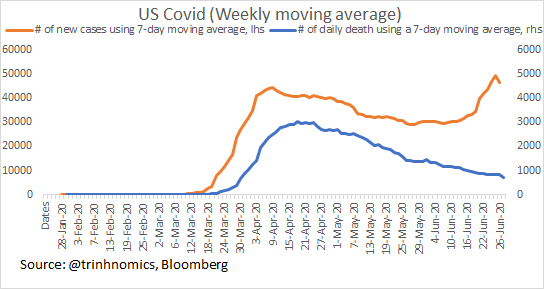
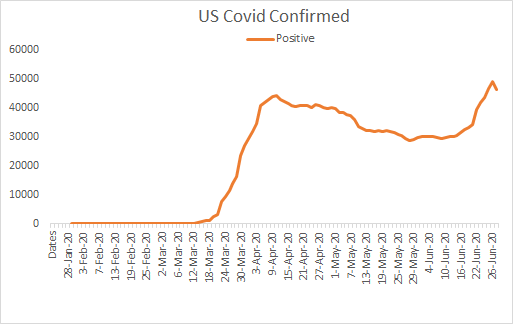
Latest Covid-19 7-day daily average increase of cases & 7-day daily average increase of deaths https://abs.twimg.com/emoji/v2/... draggable="false" alt="👇🏻" title="Rückhand Zeigefinger nach unten (heller Hautton)" aria-label="Emoji: Rückhand Zeigefinger nach unten (heller Hautton)">
Latest Covid-19 7-day daily average increase of cases & 7-day daily average increase of deaths
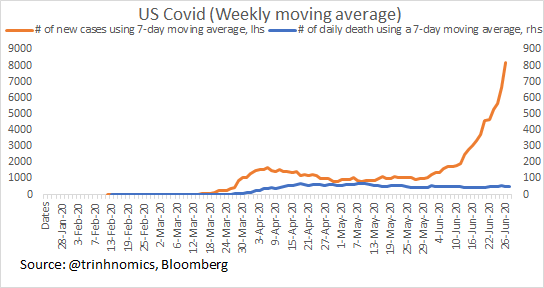
I show them separately so that you can see the trends without a scale issue & it& #39;s clear that deaths have risen in recent days. Now this is how they look on a relative basis.
Scale for confirmed is 10k & scale for deaths is 1k (10:1).
Scale for confirmed is 10k & scale for deaths is 1k (10:1).
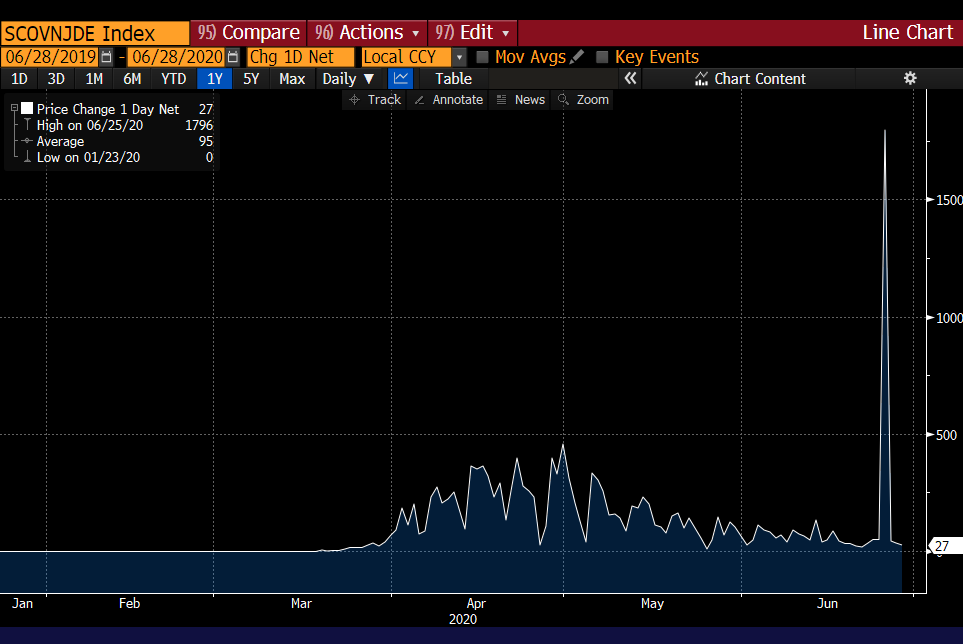
Someone mentioned New Jersey legacy deaths. Let me show that 1854 in a chart so I will strip that out & do the analysis again as it was in the past & just part of data revision.
https://www.inquirer.com/health/coronavirus/coronavirus-covid-19-philadelphia-pa-new-jersey-death-toll-probable-green-20200625.html">https://www.inquirer.com/health/co...
https://www.inquirer.com/health/coronavirus/coronavirus-covid-19-philadelphia-pa-new-jersey-death-toll-probable-green-20200625.html">https://www.inquirer.com/health/co...
Stripping out the New Jersey adding 1854 (bloomberg data shows only 1796 so I actually just substracted only 1796 on 25 June when New Jersey added old data to that date.
It shows deaths are down.
It shows deaths are down.
Fatality ratios for USA Covid:
Cumulative fatality = total deaths (including NJ revision)/ total confirmed down to 4.9% from 5.1%.
Concurrent daily fatality = down 1.5% from 1.7%
Current daily/last week confirmed =1.8% from 2.4%
Current daily/2 weeks ago =2.3% from 2.7%
Cumulative fatality = total deaths (including NJ revision)/ total confirmed down to 4.9% from 5.1%.
Concurrent daily fatality = down 1.5% from 1.7%
Current daily/last week confirmed =1.8% from 2.4%
Current daily/2 weeks ago =2.3% from 2.7%
Conclusion:
a) Deaths are down on an absolute basis & relative (even if we include lags of 1 week & 2 week).
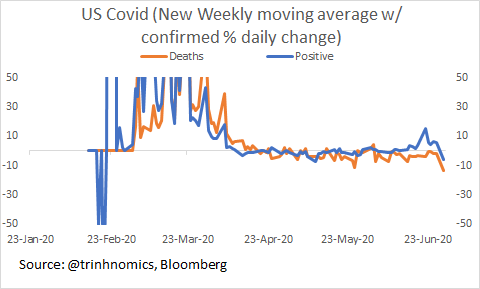
b) Deaths are down also on a trend basis as % growth is contracting.
This is good news in terms of both costs of lives & fatality of disease.
Let& #39;s look at states: FL!
a) Deaths are down on an absolute basis & relative (even if we include lags of 1 week & 2 week).
b) Deaths are down also on a trend basis as % growth is contracting.
This is good news in terms of both costs of lives & fatality of disease.
Let& #39;s look at states: FL!
This is Florida & I use scale of 1k for confirmed & 100 for deaths. As Florida fatality is much less than the US, u can see that u can& #39;t see deaths clearly even if we use a 10:1 ratio.
So I am changing this ratio to 1k & 10s so that& #39;s a 100:1 scale just to reflect that fatality rates in Florida are much lower. I do this so u can see trends of deaths clearer & it& #39;s clearly trending side-way despite massive increase of Covid!
Let me show you this:
Florida new 7-day average daily deaths/ new 7-day average daily confirmed fatality = 0.6% down from 0.8%
If you take the number of confirmed from 2 weeks ago, it would still shows 1.6% vs 19% previously so it& #39;s falling.
U can see trends here.
Florida new 7-day average daily deaths/ new 7-day average daily confirmed fatality = 0.6% down from 0.8%
If you take the number of confirmed from 2 weeks ago, it would still shows 1.6% vs 19% previously so it& #39;s falling.
U can see trends here.
Forgot to show you % growth of Covid cases & deaths. You can see they are trending in opposite directions.
Let& #39;s do Arizona & Texas!
Let& #39;s do Arizona & Texas!
Here are Texas daily increases of Covid & deaths> I use 100:1 because Texas fatality is low relative to the USA & other states.
Cases sky-rocking & deaths side-way.
Cases sky-rocking & deaths side-way.
Texas fatality:
Cumulative is 1.6% & trend is downward.
New daily 7-day average deaths/ new daily 7-day Covid positive = 0.6% fatality & trend has been the same for 1 week.
Current deaths/ confirmed 2 wks ago = 1.2% from 1.4%
In short, trend is downward for fatality & deaths
Cumulative is 1.6% & trend is downward.
New daily 7-day average deaths/ new daily 7-day Covid positive = 0.6% fatality & trend has been the same for 1 week.
Current deaths/ confirmed 2 wks ago = 1.2% from 1.4%
In short, trend is downward for fatality & deaths

 Read on Twitter
 " title="Okay, we start today w/ US Covid-19 latest confirmed, deaths, ratios (deaths/confirmed & deaths/confirmed a week ago) & growth of deaths & confirmed.Latest Covid-19 7-day daily average increase of cases & 7-day daily average increase of deathshttps://abs.twimg.com/emoji/v2/... draggable="false" alt="👇🏻" title="Rückhand Zeigefinger nach unten (heller Hautton)" aria-label="Emoji: Rückhand Zeigefinger nach unten (heller Hautton)">">
 " title="Okay, we start today w/ US Covid-19 latest confirmed, deaths, ratios (deaths/confirmed & deaths/confirmed a week ago) & growth of deaths & confirmed.Latest Covid-19 7-day daily average increase of cases & 7-day daily average increase of deathshttps://abs.twimg.com/emoji/v2/... draggable="false" alt="👇🏻" title="Rückhand Zeigefinger nach unten (heller Hautton)" aria-label="Emoji: Rückhand Zeigefinger nach unten (heller Hautton)">">
