24hr Youtube MV - Graphs & Charts
Note:
1. Data collected since Jan 3rd YT update.
2. Collected by myself; may be a video I missed bc this isn& #39;t my full time job :)
3. NOT for fanwars; it is to raise questions of transparency for @Youtube.
Enjoy!
Special thanks to @starkindler1
Note:
1. Data collected since Jan 3rd YT update.
2. Collected by myself; may be a video I missed bc this isn& #39;t my full time job :)
3. NOT for fanwars; it is to raise questions of transparency for @Youtube.
Enjoy!
Special thanks to @starkindler1
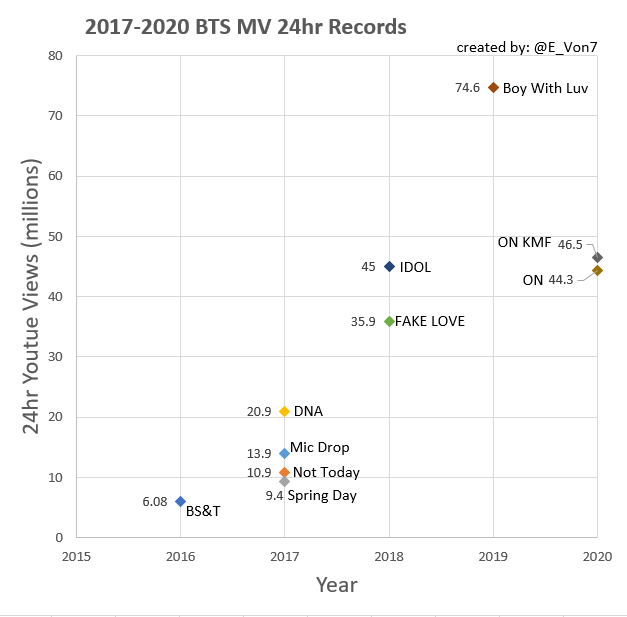
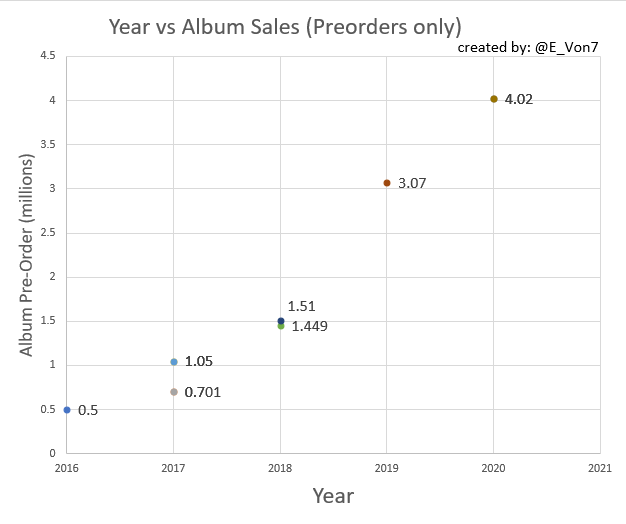
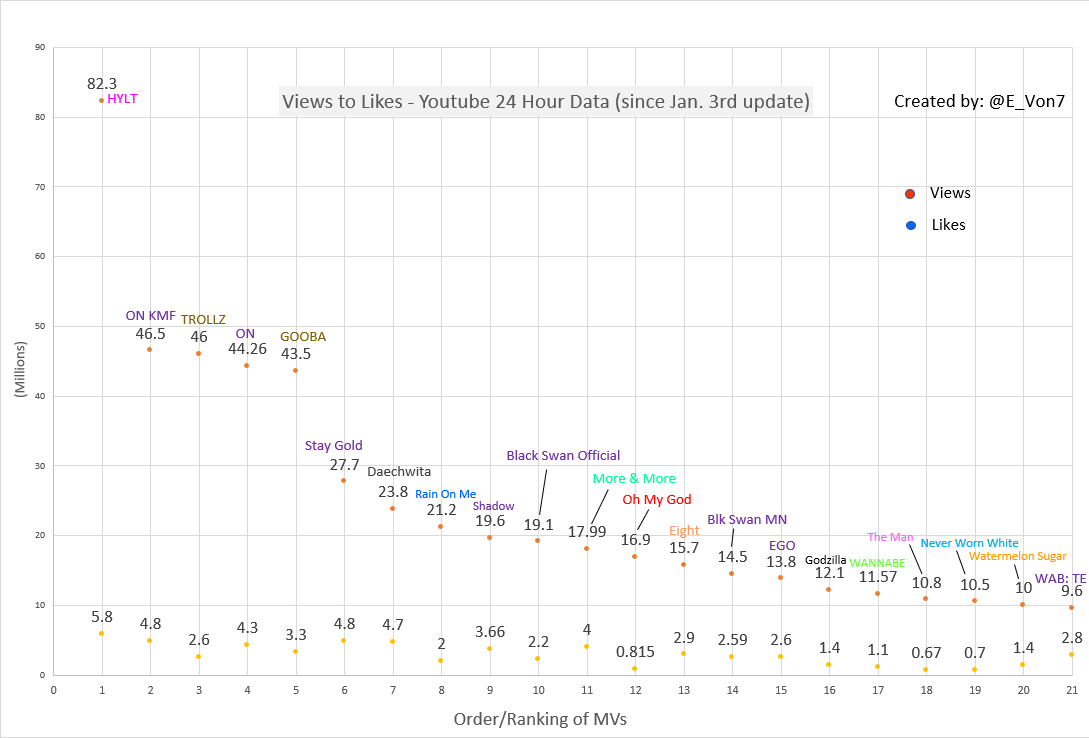
I took the top 21 MVs on the list above (for simplicity/easier to read graph).
This first graph is Views & Likes for the Top 21 MVs.
Note:
*HYLT = How You Like That
*KMF = Kinetic Manifesto Film
*WAB = We Are Bulletproof
This first graph is Views & Likes for the Top 21 MVs.
Note:
*HYLT = How You Like That
*KMF = Kinetic Manifesto Film
*WAB = We Are Bulletproof
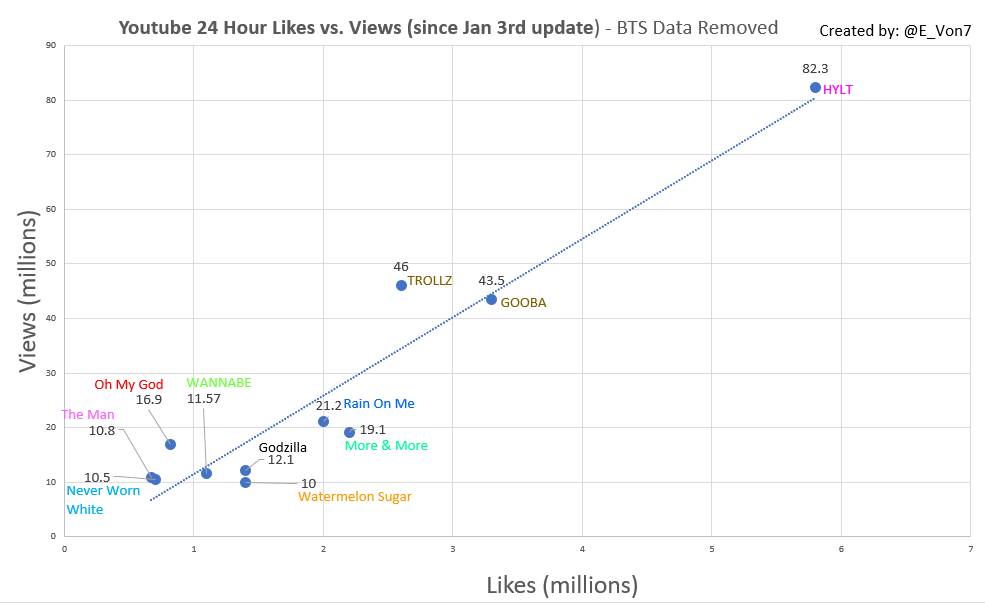
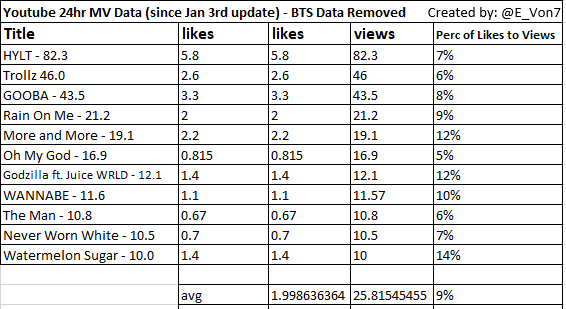
Due to the high deviation from the standard trend, I removed the BTS MVs which were the largest outliers (Watermelon Sugar being the other outlier).
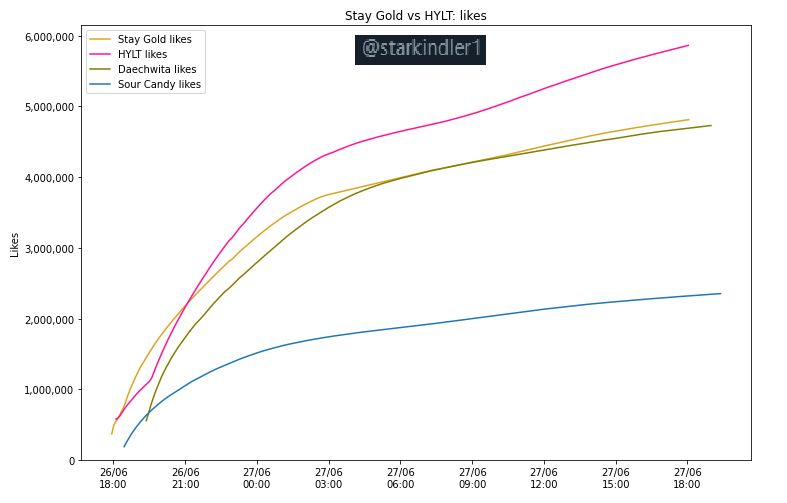
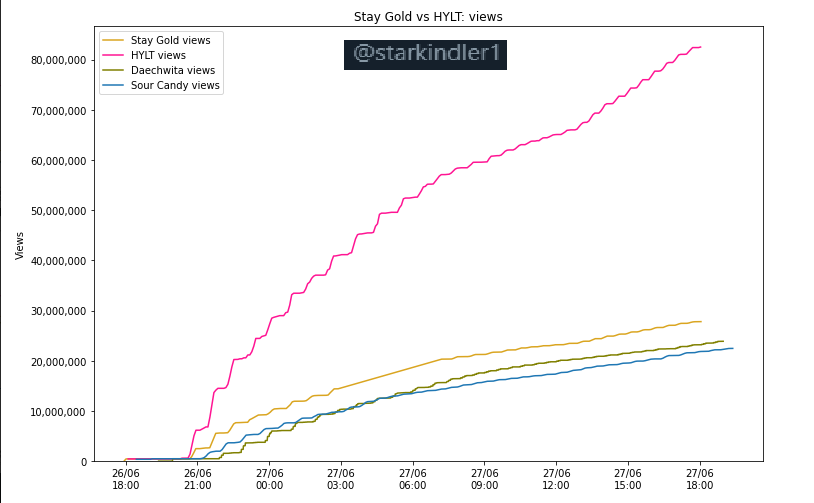
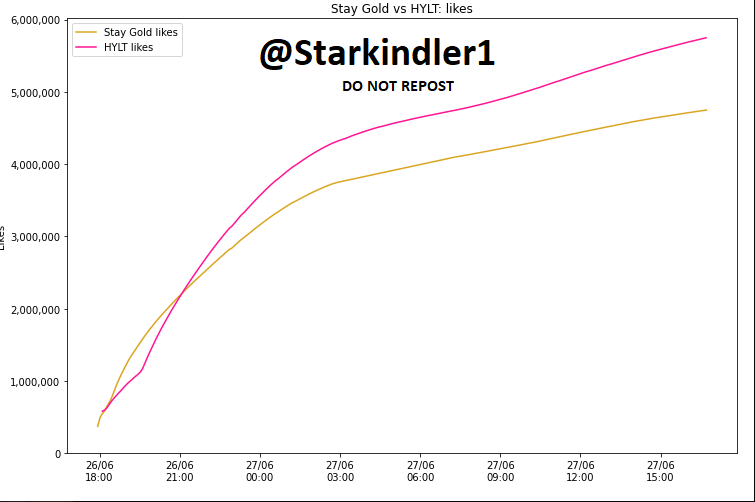
Thanks to @starkindler1& #39;s amazing coding skills, they tracked the real time likes/views directly from YT (not a 3rd party tracker).
HYLT & Stay Gold were particularly nice because they were a same day release.
[Once again emphasizing that this is not for fanwars. https://abs.twimg.com/emoji/v2/... draggable="false" alt="🙏" title="Folded hands" aria-label="Emoji: Folded hands">]
HYLT & Stay Gold were particularly nice because they were a same day release.
[Once again emphasizing that this is not for fanwars.
They have been collecting data for a few other MVs recently once 6ix 9ine released GOOBA because of the very strange trends for that video.
Again: this is not their ft job; 4 videos used for the graphs as they had the most complete data.
HYLT
Stay Gold
Daechwita
Sour Candy
Again: this is not their ft job; 4 videos used for the graphs as they had the most complete data.
HYLT
Stay Gold
Daechwita
Sour Candy

 Read on Twitter


 ]" title="Thanks to @starkindler1& #39;s amazing coding skills, they tracked the real time likes/views directly from YT (not a 3rd party tracker). HYLT & Stay Gold were particularly nice because they were a same day release.[Once again emphasizing that this is not for fanwars.https://abs.twimg.com/emoji/v2/... draggable="false" alt="🙏" title="Folded hands" aria-label="Emoji: Folded hands">]">
 ]" title="Thanks to @starkindler1& #39;s amazing coding skills, they tracked the real time likes/views directly from YT (not a 3rd party tracker). HYLT & Stay Gold were particularly nice because they were a same day release.[Once again emphasizing that this is not for fanwars.https://abs.twimg.com/emoji/v2/... draggable="false" alt="🙏" title="Folded hands" aria-label="Emoji: Folded hands">]">
