yesterday, i posted this thread about the suggestive timing on the rise in US hospitalizations vs protests.
the biggest pushback, as expected, was "but NYC had protests and no spike."
i think this is because there was another factor at play: density. https://twitter.com/boriquagato/status/1276494896132534277?s=20">https://twitter.com/boriquaga...
the biggest pushback, as expected, was "but NYC had protests and no spike."
i think this is because there was another factor at play: density. https://twitter.com/boriquagato/status/1276494896132534277?s=20">https://twitter.com/boriquaga...
herd immunity threshold (HIT) and disease break point is NOT a uniform number. it varies place to place and one of the key variables is social graph.
there is solid science behind this and has important epidemiological implications. https://twitter.com/boriquagato/status/1259552285102727168?s=20">https://twitter.com/boriquaga...
there is solid science behind this and has important epidemiological implications. https://twitter.com/boriquagato/status/1259552285102727168?s=20">https://twitter.com/boriquaga...
a big part of social graph is density and city density varies massively by region in the US
the population density of the northeast vs the rest of the US is difficult to overstate
that is a major factor in establishing HIT
(and real HIT is MUCH lower than 1-(1/R0) predicts)
the population density of the northeast vs the rest of the US is difficult to overstate
that is a major factor in establishing HIT
(and real HIT is MUCH lower than 1-(1/R0) predicts)
this is population/square mile of the biggest city in northeast vs western/southern states.
the variation is gigantic. NY is 4 times as dense as LA and 9 times as dense as houston.
this would make HIT much higher in NY (it looks to be about 25% based on serology)
the variation is gigantic. NY is 4 times as dense as LA and 9 times as dense as houston.
this would make HIT much higher in NY (it looks to be about 25% based on serology)
so here& #39;s what i think happened: ALL these cities had reached disease break point and were going into decline.
but they did this at very different levels. it looks to have been ~25% in NY. perhaps it was only 8-10% in LA and 6% in houston
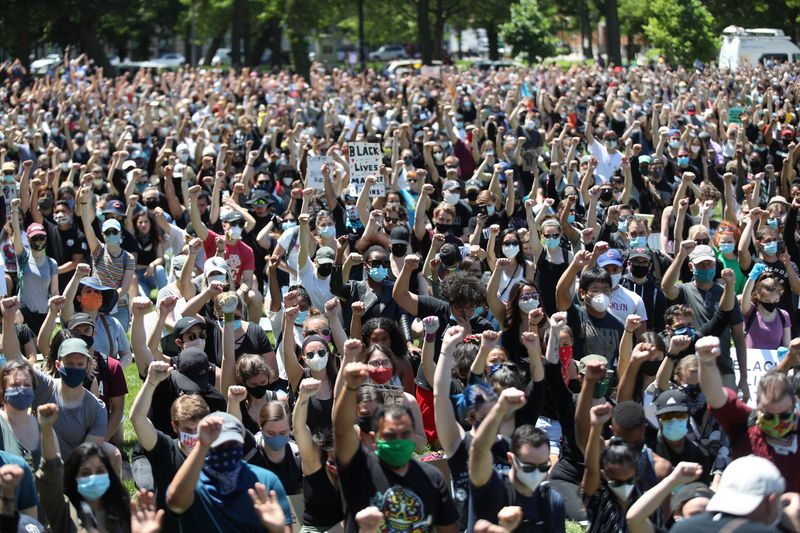
then the protests hit.
but they did this at very different levels. it looks to have been ~25% in NY. perhaps it was only 8-10% in LA and 6% in houston
then the protests hit.
the protests were a change in social patterns/groupings.
whether that change was a strong enough signal to affect your locality depended upon your locality.
it& #39;s all about how many people you had been encountering before and the extent that had driven previous disease spread
whether that change was a strong enough signal to affect your locality depended upon your locality.
it& #39;s all about how many people you had been encountering before and the extent that had driven previous disease spread
in NYC or boston or newark, it probably was not. you were already in close contact with so many people that a few more made no functional difference.
one ride on the B train was like a day at a protest.
such cities were already immune to the point where protests added little.
one ride on the B train was like a day at a protest.
such cities were already immune to the point where protests added little.
but, in sprawl cities like houston, LA, dallas, phoenix, and jacksonville, this was something WILDLY new.
i posit that we saw something like this where the red line is the level of population density that would have driven high enough previous infection to shield from protests
i posit that we saw something like this where the red line is the level of population density that would have driven high enough previous infection to shield from protests
this all forms a self adjusting cycle of feedback
let& #39;s say (and i& #39;m making this up) that you need 15% prior disease prevalence (resistant population) to weather a big protest without it becoming a new contagion vector
so NY, philly, boston all hit this. but houson, LA did not
let& #39;s say (and i& #39;m making this up) that you need 15% prior disease prevalence (resistant population) to weather a big protest without it becoming a new contagion vector
so NY, philly, boston all hit this. but houson, LA did not
everyone has reached a point of disease decline based on the basic epidemiology of covid. it hit local disease break point and went into decline.
but the jolt of protests was enough to push it back into spread in places that had prevalence below some threshold.
but the jolt of protests was enough to push it back into spread in places that had prevalence below some threshold.
san francisco is an interesting test case here: they had protests but are not seeing the same spike LA is. but they are 2.5X as dense as LA. so that makes sense.
and folks from kaiser told me they thought covid was all over norcal back in dec
LA also had much larger protests
and folks from kaiser told me they thought covid was all over norcal back in dec
LA also had much larger protests
it seems like we have 2 factors here
how big were your protests & how much immunity did your locality have beforehand?
if the former overwhelms the latter, you re-kindle contagion
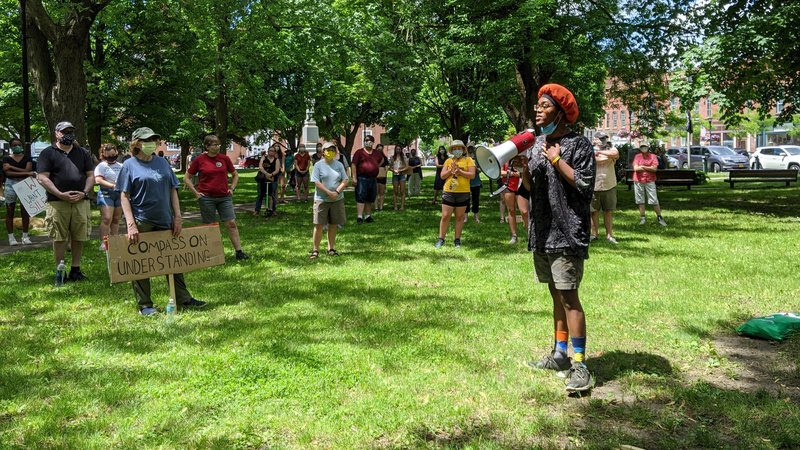
a small protest in laramie WY might do this
there might be no protest big enough to do it in NYC
how big were your protests & how much immunity did your locality have beforehand?
if the former overwhelms the latter, you re-kindle contagion
a small protest in laramie WY might do this
there might be no protest big enough to do it in NYC
so, i think that& #39;s what explains the variance.
it was size of protests vs initial ability to absorb this sort of shock to a percolation model.
this is a hypothesis in progress that seems promising to me so far, but i welcome input.
that& #39;s why i post this stuff.
it was size of protests vs initial ability to absorb this sort of shock to a percolation model.
this is a hypothesis in progress that seems promising to me so far, but i welcome input.
that& #39;s why i post this stuff.
my thanks to folks like @AlexBerenson @ElonBachman @kerpen @aginnt and @BrendanEich and many others all of whom have been helpful in thinking about this.
this is always a group effort. https://twitter.com/boriquagato/status/1276619446983901184?s=20">https://twitter.com/boriquaga...
this is always a group effort. https://twitter.com/boriquagato/status/1276619446983901184?s=20">https://twitter.com/boriquaga...

 Read on Twitter


