THREAD:
Introducing Possession Value (PV) Maps.
In the last few weeks I have used the PV metric and many of you have liked it as it rewards progressive passing and movement. So, I have built post-game PV maps.
What is PV and how does a PV map work? Let& #39;s find out.
Introducing Possession Value (PV) Maps.
In the last few weeks I have used the PV metric and many of you have liked it as it rewards progressive passing and movement. So, I have built post-game PV maps.
What is PV and how does a PV map work? Let& #39;s find out.
PV refers to ‘Possession Value’. It looks at how much value a player brings to a team& #39;s possession based on their passing and movement. One can use it for off-ball elements too though I have not yet done so.
Value is determined by how likely it is that a goal would be scored at the end of a possession that starts from the location the ball is in.
So, if the ball is in a team& #39;s own 6-yard box the PV is 0.009 (0.9%) whereas it is 0.571 (57.1%) if it is in the opposition& #39;s 6-yard box.
So, if the ball is in a team& #39;s own 6-yard box the PV is 0.009 (0.9%) whereas it is 0.571 (57.1%) if it is in the opposition& #39;s 6-yard box.
This is determined by historic data in football in a similar manner to the metric ‘Expected Goals’. The ball in certain locations will more likely result in a goal than other locations which is known by necessity when one watches the game.
So, if a player can progress the ball he increases the chances of scoring. For example, if he manages to add +30.5 from a pass this means he increased the chances of a goal being scored by 30.5% which is huge in football.
PV is gained by moving the ball closer to the opposition& #39;s box. If a player passes the ball from the centre circle to the edge of the opposition& #39;s box (the D just outside) the PV goes from 0.016 to 0.080 (1.6% to 8.0%). So, the PV Added is 5.4% or +5.4 (8.0 – 1.6 = PV Added).
The highest PV zone is, unsurprisingly, the 6-yard box but only the width of the goal. The PV here is 0.571 (57.1%) which is completely understandable as the ball in this area often leads to goals due to how close it is to the goal. Players tend to shoot 88% of the time here.
From a single pass the highest PV one can add is +56.7. This is from one own& #39;s corner flag to the opposition& #39;s 6-yard box — highly improbable of course. The lowest PV one can add is +0.0. This is when the ball is passed but remains in the same PV zone.
PV, whilst not perfect, is a useful metric in rewarding players who build-up wonderfully well but do not score or get an assist. If Player A plays a through ball over the top to Player B and he squares the ball for Player C, then C scores, B gets an assist and A gets nothing.
However, PV rewards Player A for the pass they made. In some cases it may reward the player more than the player who assisted for the goal depending on the passes or movement.
Player A might increase the chances of scoring more than the one who assisted. PV will tell us this.
Player A might increase the chances of scoring more than the one who assisted. PV will tell us this.
Possession Value (PV) Maps
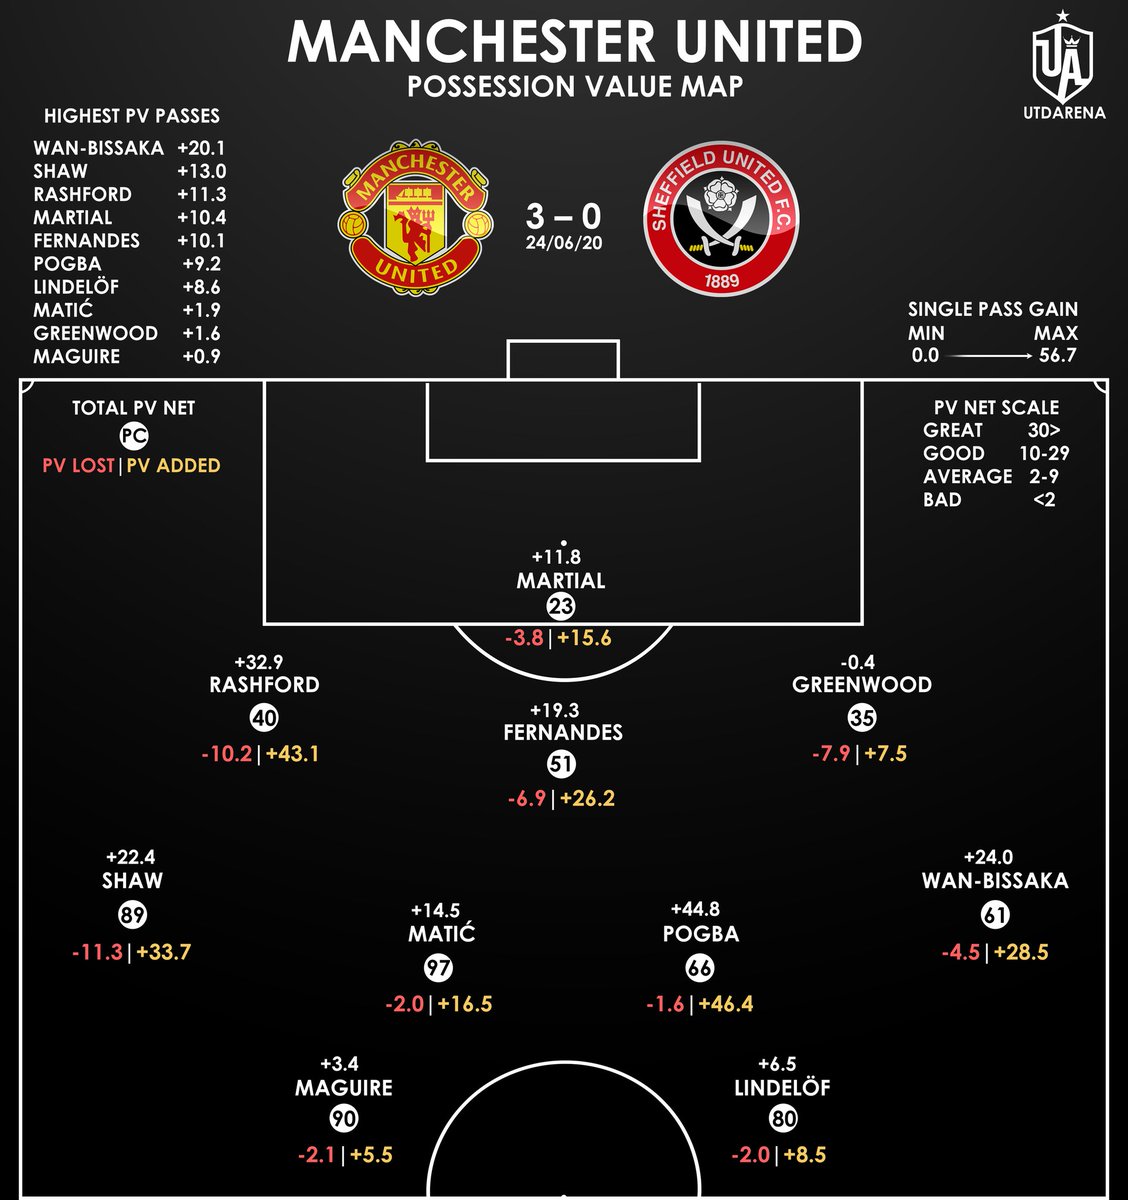
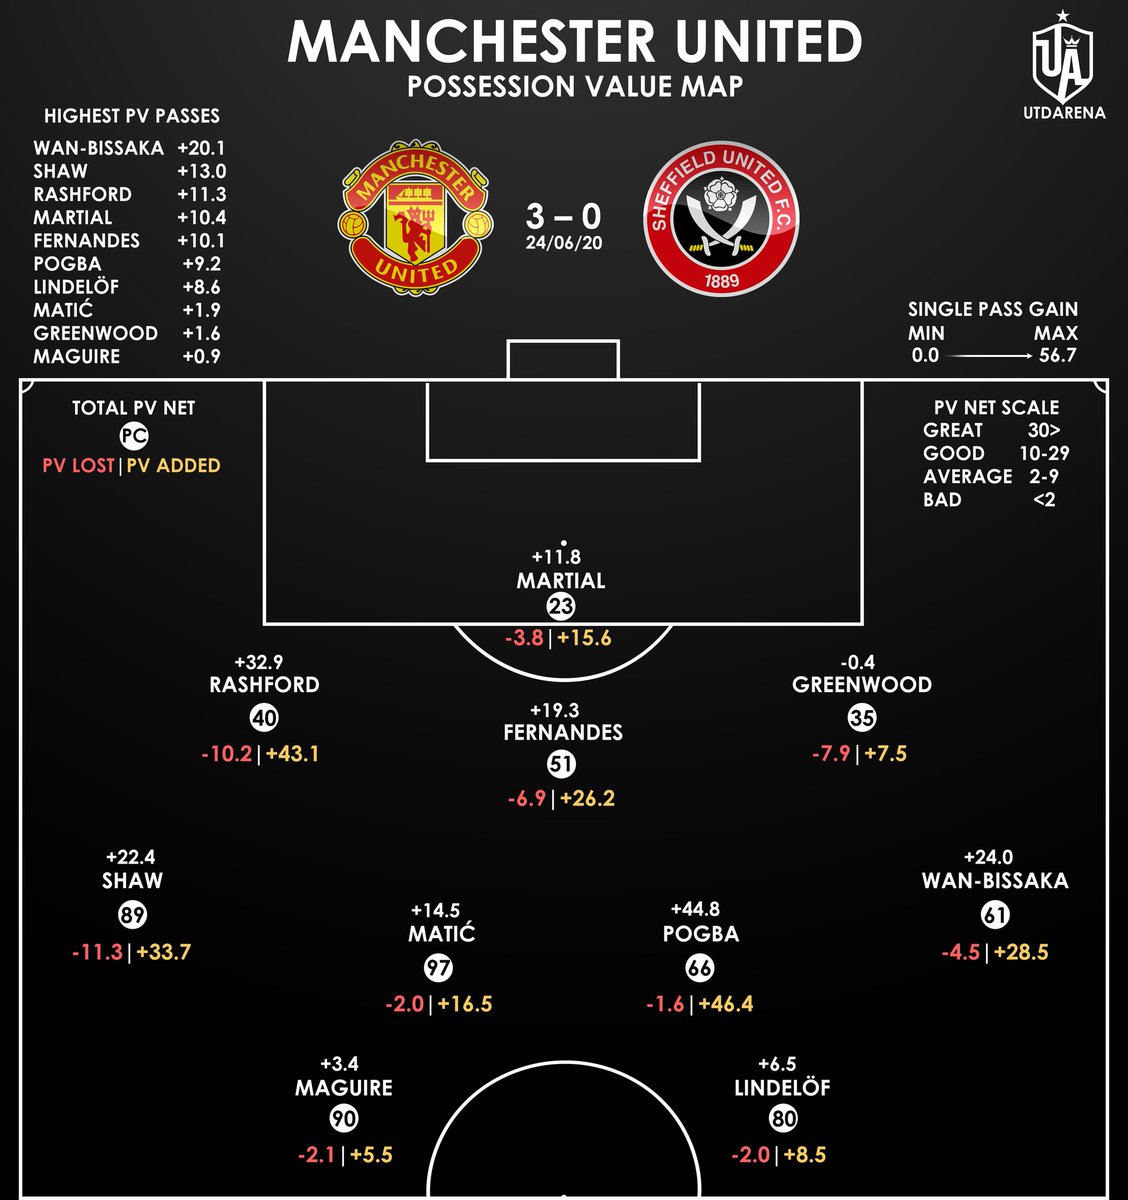
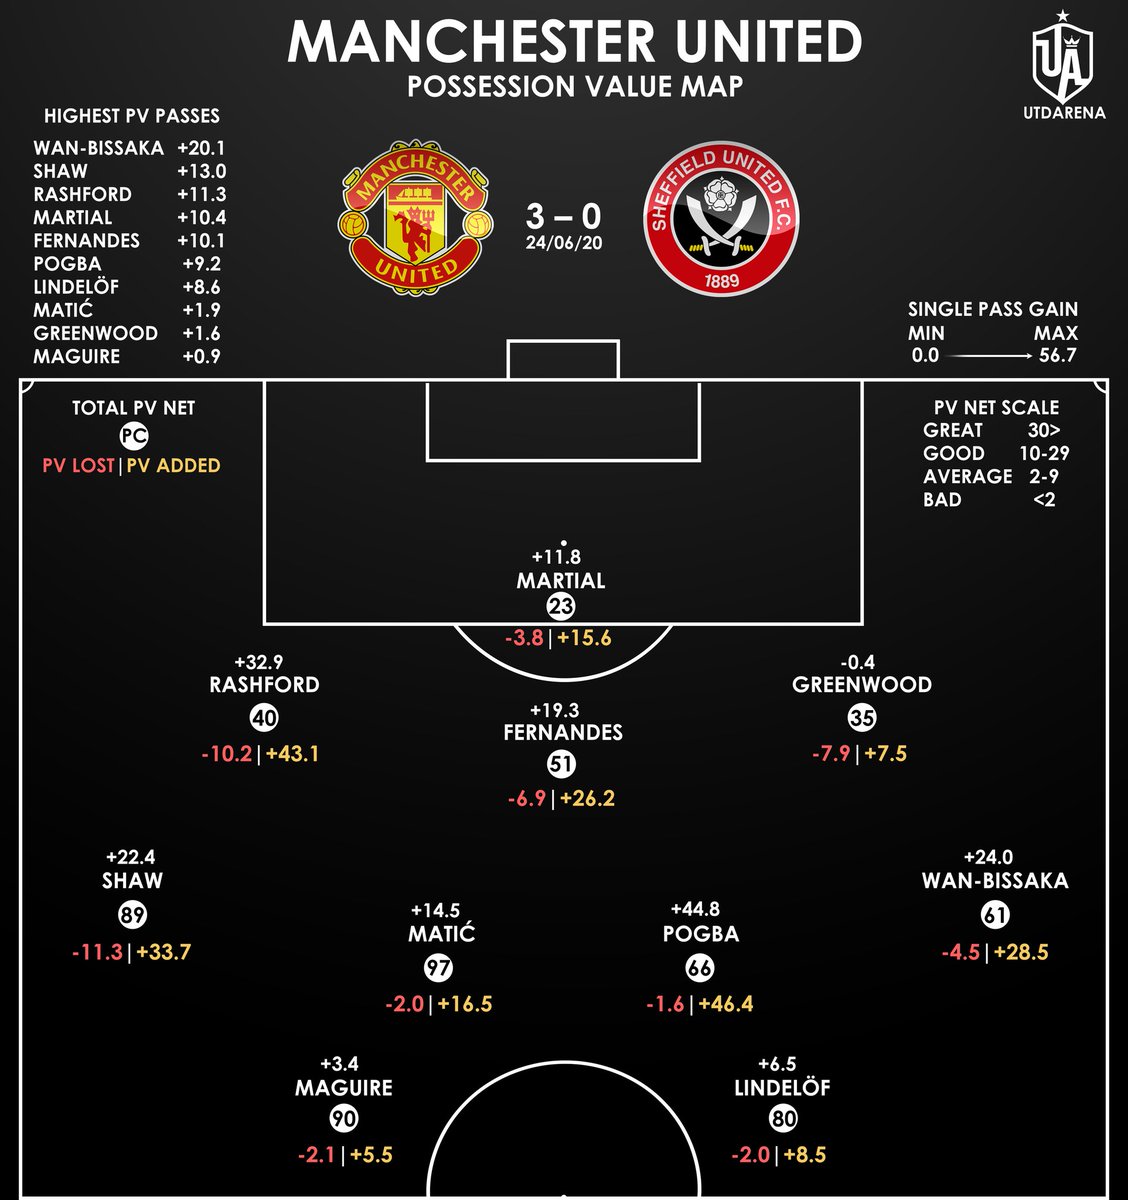
This is a PV Map which I made for the game against Sheffield. Have a look through the various parts.
This map only concerns passes and not movement as I do not have access to such data for now.
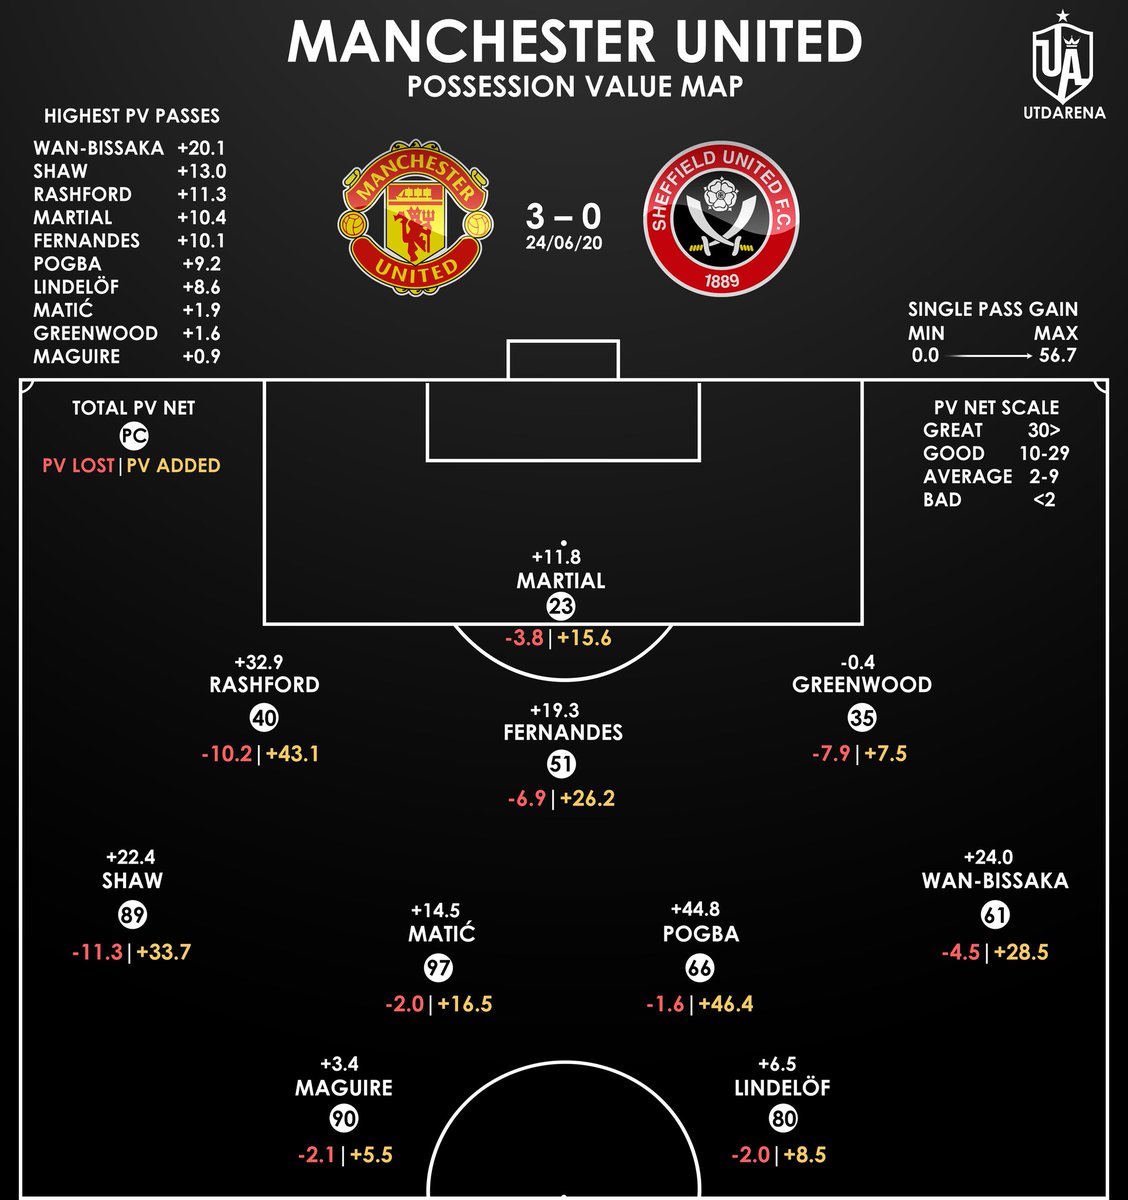
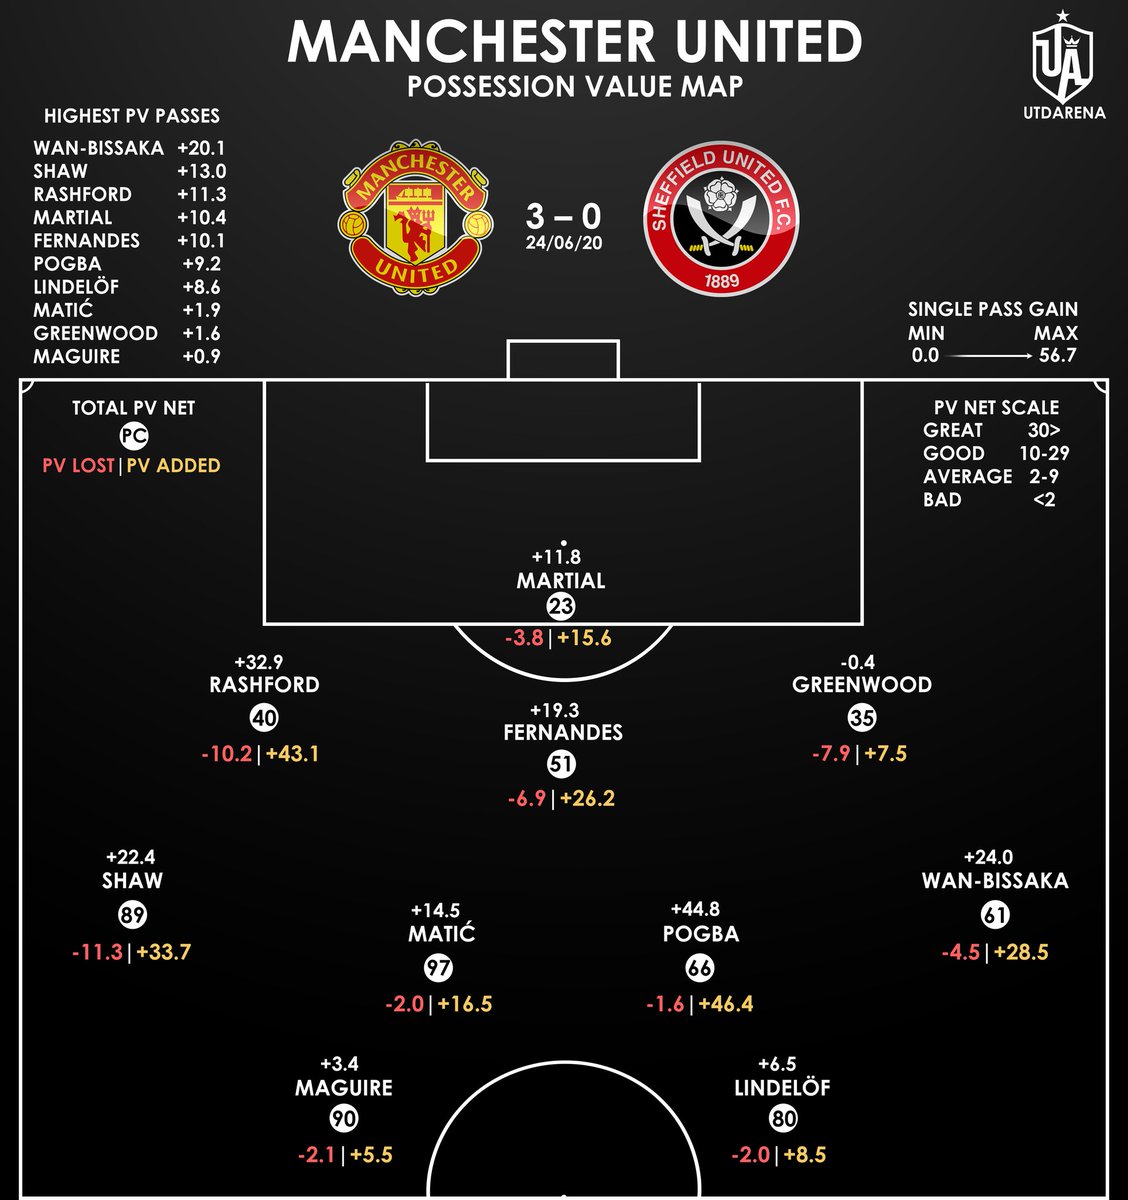
This is a PV Map which I made for the game against Sheffield. Have a look through the various parts.
This map only concerns passes and not movement as I do not have access to such data for now.
The two values shown side by side (value | value) is the PV lost and added in the game. So, Anthony Martial reduced the team& #39;s PV by 3.8 whilst he increased it by 15.6 and, thus, his net value is +11.8.
Martial increased our chances of scoring by 11.8% via passes in the game.
Martial increased our chances of scoring by 11.8% via passes in the game.
On the top right-hand side of the pitch there is a key to highlight what a ‘great’ to ‘bad’ PV score looks like. So, Martial& #39;s PV just entered into the ‘good’ zone which is nice. It is not high, though. However, this is not a problem because Martial& #39;s job isn& #39;t to progress.
On the top left of the visual we can see the highest PV passes played by each player.
Do you remember the first assist from Marcus Rashford to Martial? He added +11.3 PV due to where he was and where the ball ended up. It was a very dangerous pass and it resulted in a goal.
Do you remember the first assist from Marcus Rashford to Martial? He added +11.3 PV due to where he was and where the ball ended up. It was a very dangerous pass and it resulted in a goal.
Let& #39;s look at Shaw. His PV Added is +33.7 which is due to some of the good passes he played into dangerous areas. However, his PV Lost is –11.3 because he also passed backwards in a lot of good positions. His PV, funnily enough, highlights the opposing views about him.
Many of us said Greenwood struggled in this game and it is true. His overall PV was actually –0.4 — the only negative PV in the game. This, again, agrees with what we saw. There were some good parts but he was often too deep and inactive on the ball.
Pogba and Matic were brilliant. Matic completed 97 passes yet only lost –2.0 PV as a result. This means he often moved the ball sideways or forward and rarely went back.
On the other hand, Pogba had the highest PV score from any player on the pitch.
On the other hand, Pogba had the highest PV score from any player on the pitch.
Marcus Rashford& #39;s highest PV+ was +11.3. Overall, his PV was +32.9; he played quite a good few passes into dangerous areas and picked up two assists.
However, look at Wan-Bissaka. His PV Added is +28.5 but +20.1 came from one pass. Without that pass (assist to Martial) his PV Added is just +8.4 and his overall PV becomes just +3.9 which is not good. So, his assist truly inflated his overall numbers whilst he is still rewarded.
Something to note is that this was a fantastic performance from us and so our PV was very high. Generally speaking our players have averaged between 4-20 this season. Against Sheffield, four players were above 20 and Pogba was into the 40s!
Overall, PV is a good metric to use but it isn& #39;t perfect. It cannot capture some elements of the game which require observatory analysis. This is why I combine between the two. Nevertheless, it is a good metric that is still being developed and I, myself, am working on it too.
In conclusion, I hope you enjoy the maps. This is my first one. I will be making them a day after every game as it gives me time to revise and edit to make sure it is accurate.
End of Thread.

 Read on Twitter
