Most important thing u& #39;ll read today!
A few days ago I posted this, about how Stockholm behaves according to predictions by @MLevitt_NP2013 (15-20%)
To understand this, it is imperative that you understand what the Gompertz Function is and what it means. https://twitter.com/gummibear737/status/1275118332887392256?s=20">https://twitter.com/gummibear...
First, it& #39;s important to understand the basics of what exponential growth is and how it behaves on a linear and logarithmic scale. This background info is important for understanding how Gompertz works https://www.youtube.com/watch?v=hCgPf1SuPNY">https://www.youtube.com/watch...
Now we get into the Gompertz Function.
Unlike exponential growth, Gompertz rate of growth is slowing down as soon as it begins. Like a bullet coming out of a gun, it has max speed when it exits the barrel and then immediately slows due to air resistance https://www.youtube.com/watch?v=Uw2ZTaiN97k">https://www.youtube.com/watch...
Unlike exponential growth, Gompertz rate of growth is slowing down as soon as it begins. Like a bullet coming out of a gun, it has max speed when it exits the barrel and then immediately slows due to air resistance https://www.youtube.com/watch?v=Uw2ZTaiN97k">https://www.youtube.com/watch...
Covid outbreaks (in small homogenous populations) perfectly align with the Gompertz function curve!
1) Its growth is immediately decreasing exponentially
2) It has a ceiling beyond which it does not grow
Here are SK and NZ as examples: https://www.youtube.com/watch?v=8aHrx68IT7o">https://www.youtube.com/watch...
1) Its growth is immediately decreasing exponentially
2) It has a ceiling beyond which it does not grow
Here are SK and NZ as examples: https://www.youtube.com/watch?v=8aHrx68IT7o">https://www.youtube.com/watch...
But maybe lockdowns explain the peak?
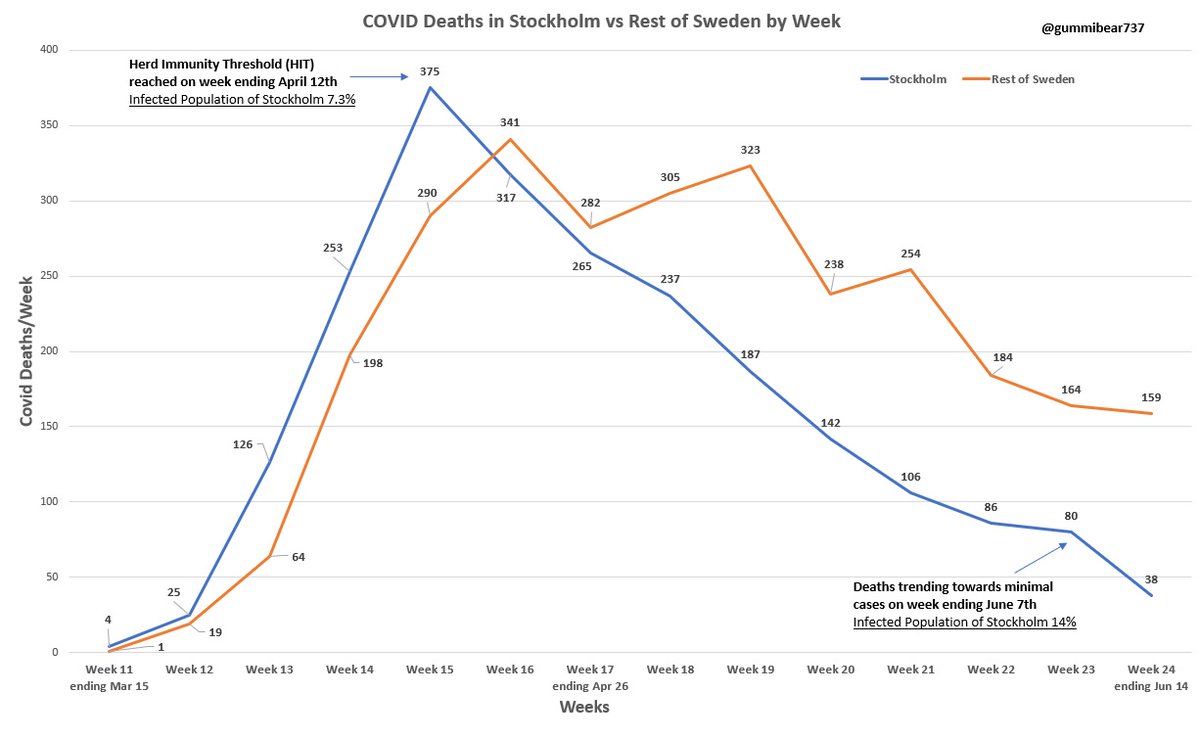
Non-locked down Stockholm, a homogenous/localized population displayed the pattern predicted by Gompertz curve
In fact, one thing Gompertz predicts is that the number of deaths after the peak is roughly double those from before. Looks right
Non-locked down Stockholm, a homogenous/localized population displayed the pattern predicted by Gompertz curve
In fact, one thing Gompertz predicts is that the number of deaths after the peak is roughly double those from before. Looks right
Every outbreak in every city or region is going to be its own little Gompertz curve.
For Stockholm, only 15% infection rate was necessary for the virus to burn out
In other areas, the rates can be higher or lower depending on various factors
For Stockholm, only 15% infection rate was necessary for the virus to burn out
In other areas, the rates can be higher or lower depending on various factors
The Gompertz theory explains most of what we have observed so far about Covid
And lots of other people are also catching on: https://www.medrxiv.org/content/10.1101/2020.06.18.20135210v1">https://www.medrxiv.org/content/1...
And lots of other people are also catching on: https://www.medrxiv.org/content/10.1101/2020.06.18.20135210v1">https://www.medrxiv.org/content/1...

 Read on Twitter


