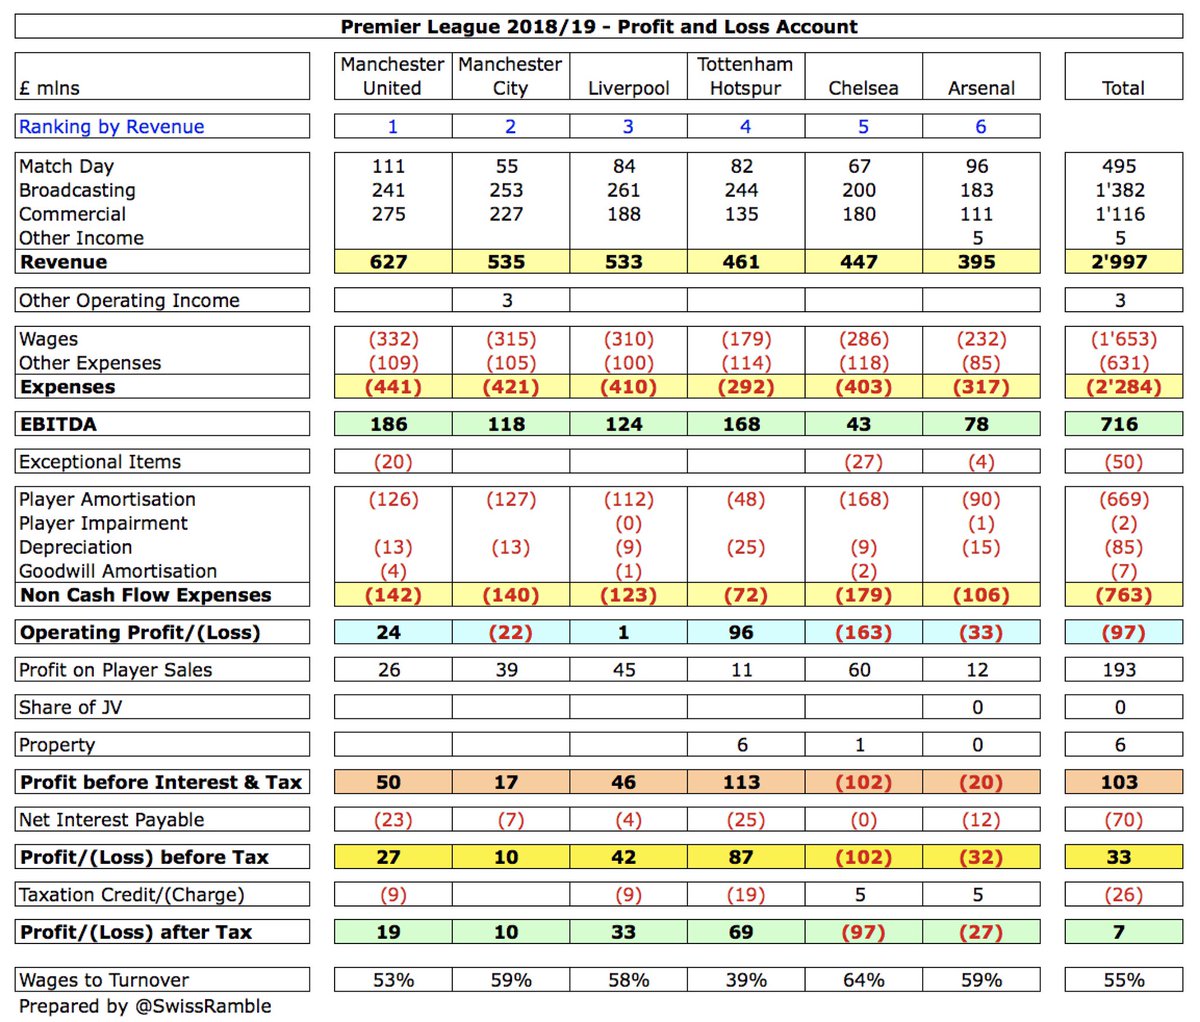
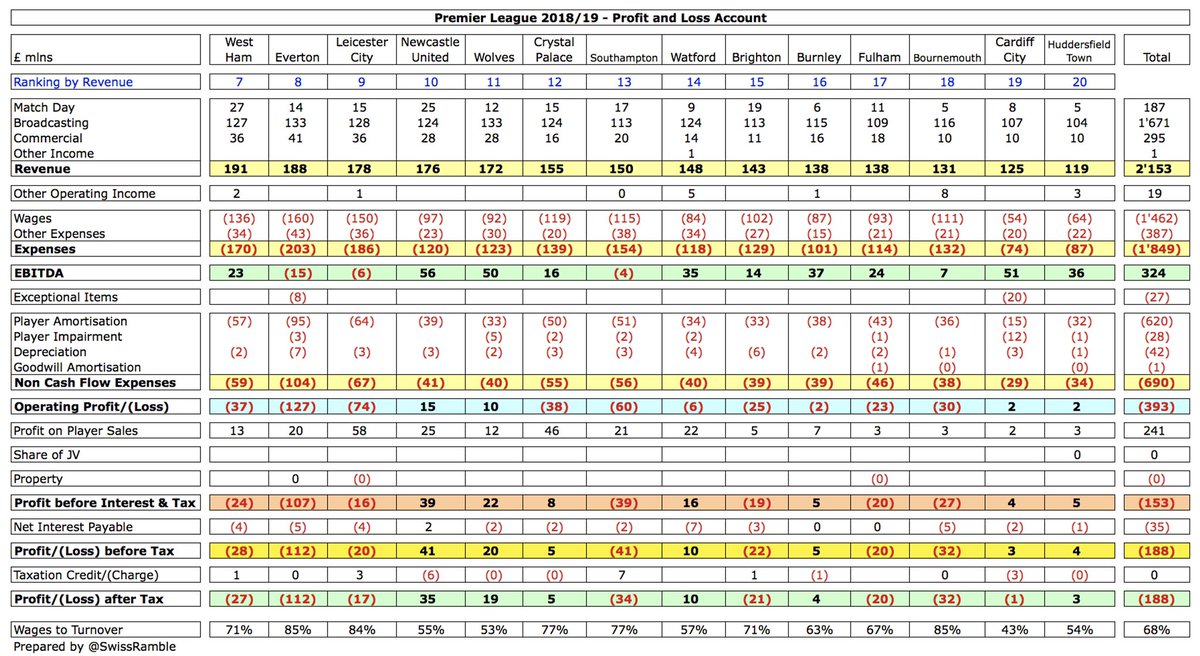
Having already posted detailed threads looking at the Premier League 2018/19 financial results for both the Big 6 and Other 14 clubs, today we complete the analysis by comparing the two groups.
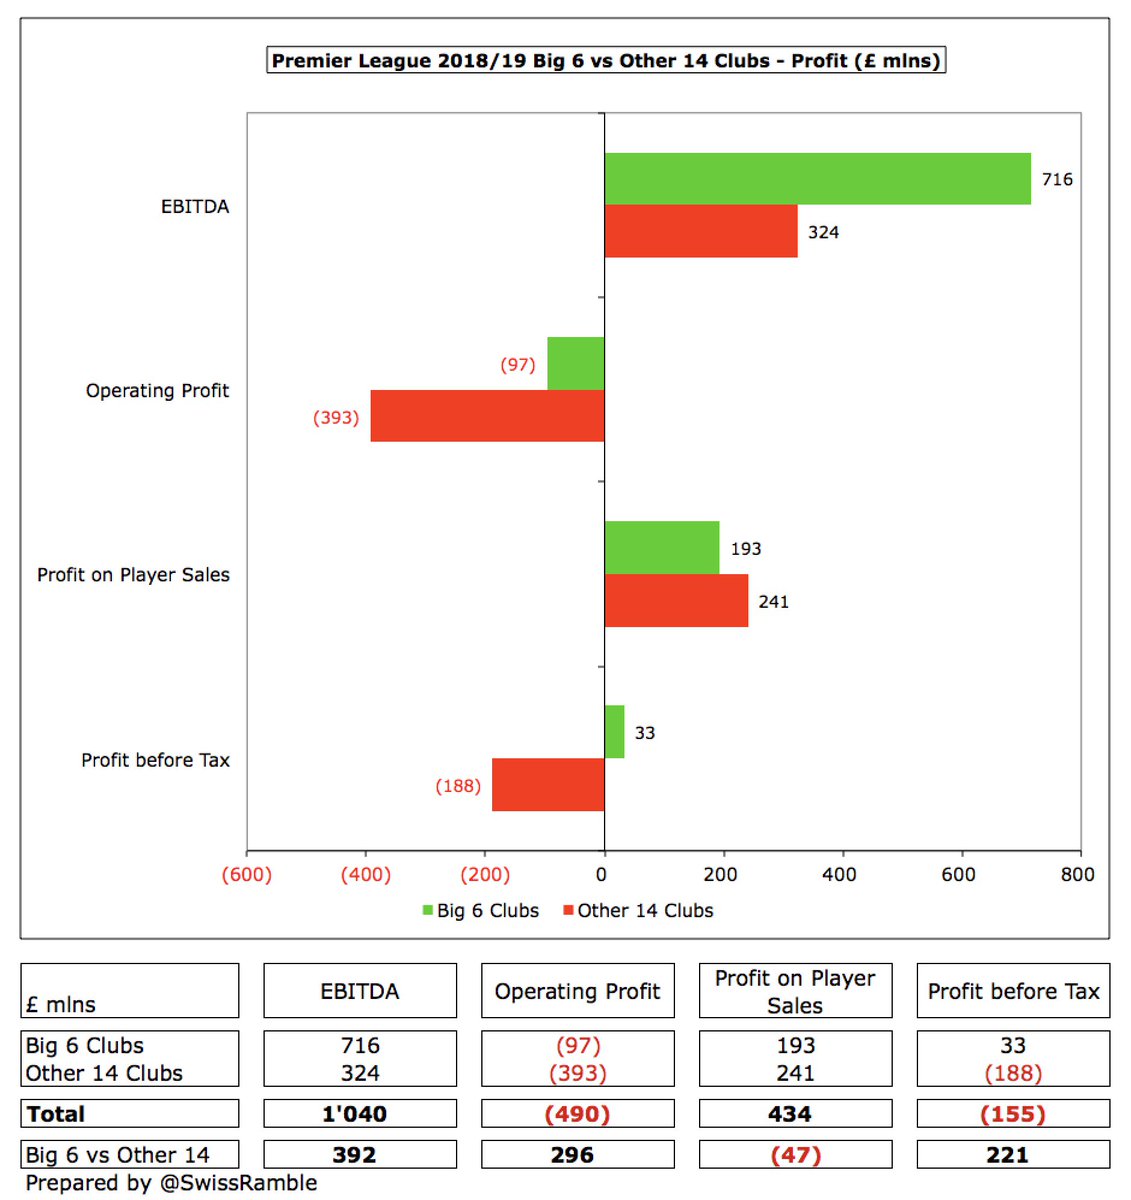
Big 6 were more profitable than Other 14 on most metrics: EBITDA around twice as much (£716m vs £324m); operating loss much smaller (£97m vs £393m); £33m profit before tax vs £188m loss. The only exception was profit on player sales, where Other 14 were higher (£241m vs £193m).
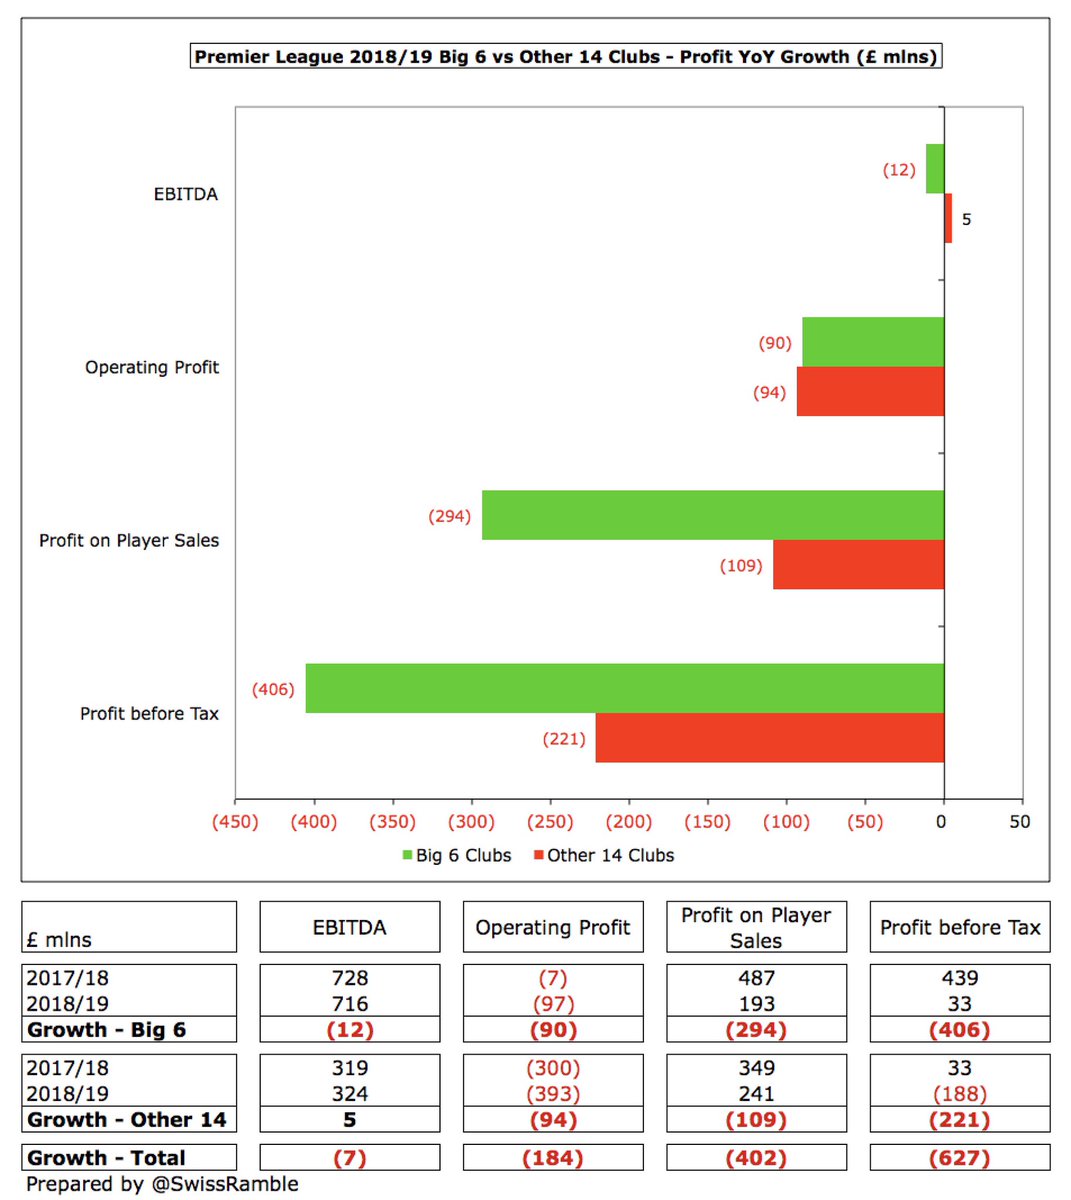
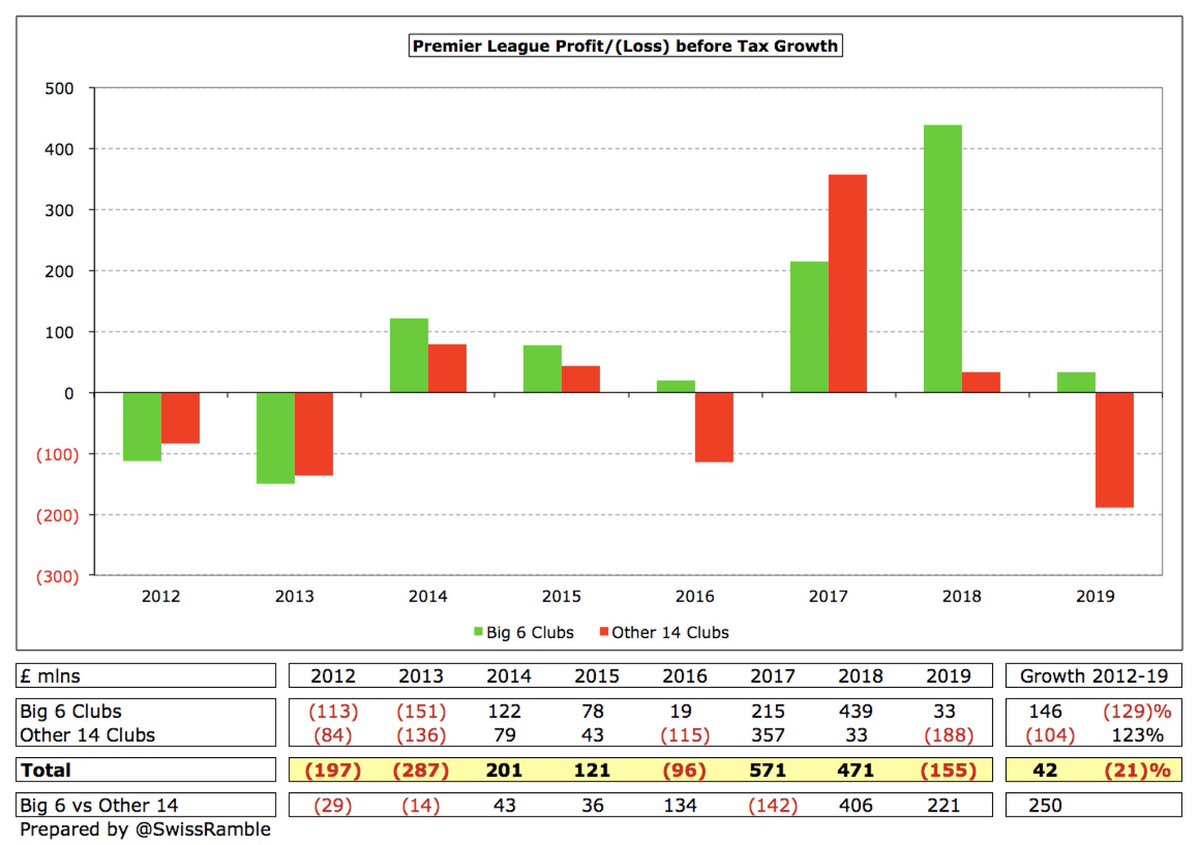
However, Big 6 profitability dropped more than Other 14 against prior year, especially pre-tax profit, falling £406m from £439m to £33m, while Other 14 “only” decreased £221m, albeit moving from £33m profit to £188m loss. Profit on player sales also fell more (£294m vs £109m).
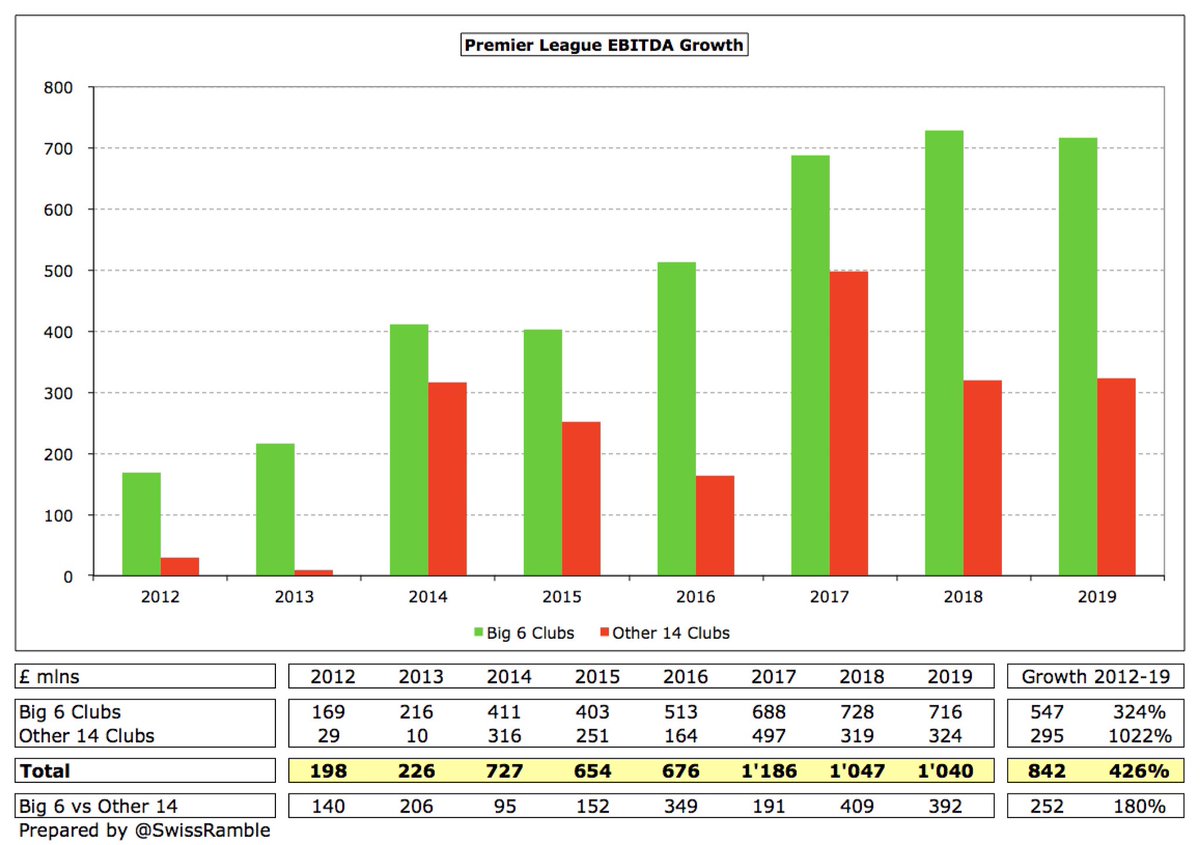
Big 6 EBITDA of £716m is more than double Other 14 £324m, with the gap increasing from £140m in 2012 to £392m in 2019. Interestingly, Big 6 manage to maintain EBITDA over course of 3-year Premier League TV deal, while Other 14 profitability falls over that period.
Big 6 and Other 14 tend to report operating losses with the best performance in the first year of 3-year Premier League TV deal (2014 and particularly 2017). However, Big 6 have reduced loss from £159m in 2012 to £97m in 2019, while Other 14 loss has doubled from £186m to £393m.
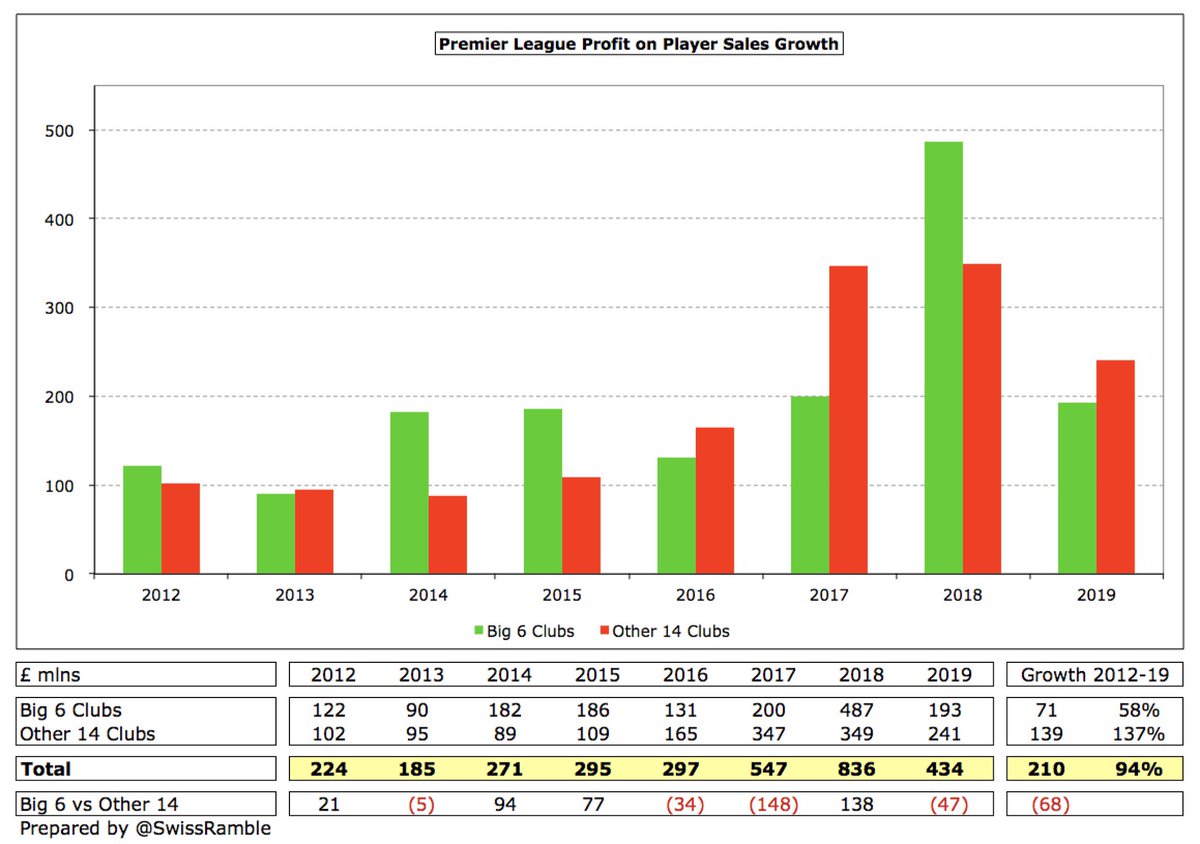
Profit on player sales is the one area where Other 14 registered higher profits than Big 6 in 2019 (£241m vs £193m) on a “needs must” basis. Have also grown twice as much since 2012 (£139m vs £71m). 2018 was a real outlier, as £836m was nearly £300m higher than next best year.
Thanks to player sales, Premier League clubs have largely managed to post pre-tax profits in last 8 years: Big 6 every season since 2013; Other 14 losses come in 3rd year of TV deal. Big 6 more profitable in last 3-year cycle against 2014-16; Other 14 also improved on that basis.
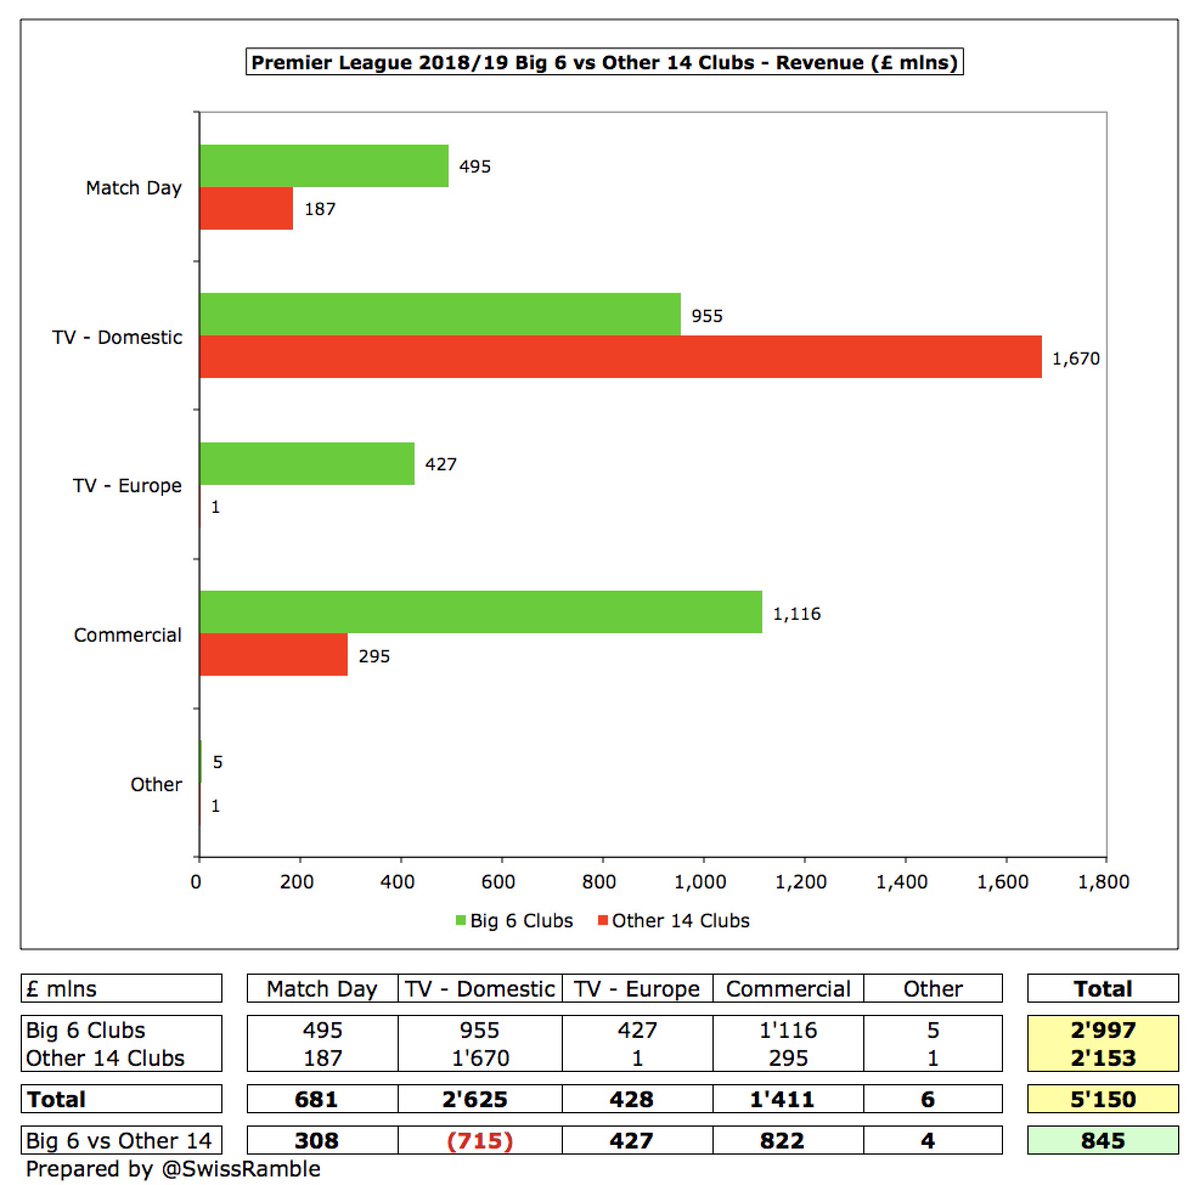
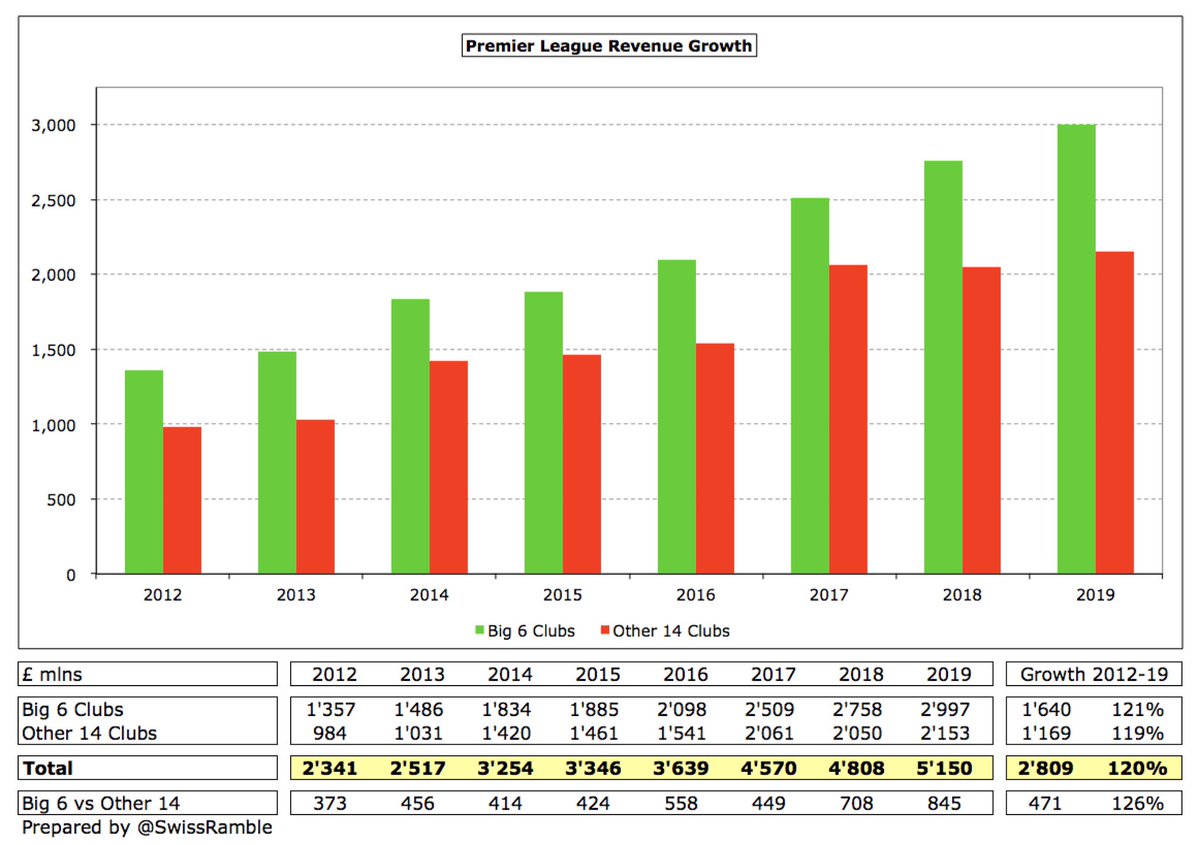
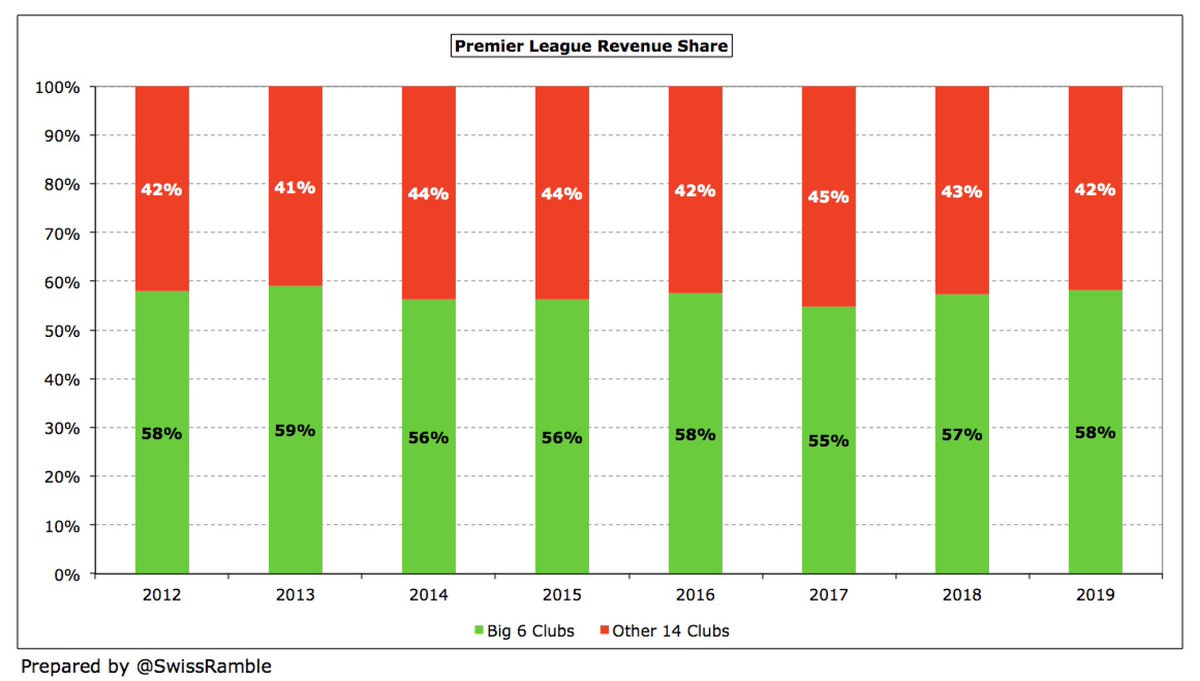
Big 6 £3.0 bln revenue is £845m more than Other 14 £2.2 bln (58% vs 42% of £5.2 bln total). Big 6 is higher than Other 14 for almost all revenue streams: commercial £822m, Europe TV £427m and match day £308m. The only exception is domestic TV, where Other 14 are £715m higher.
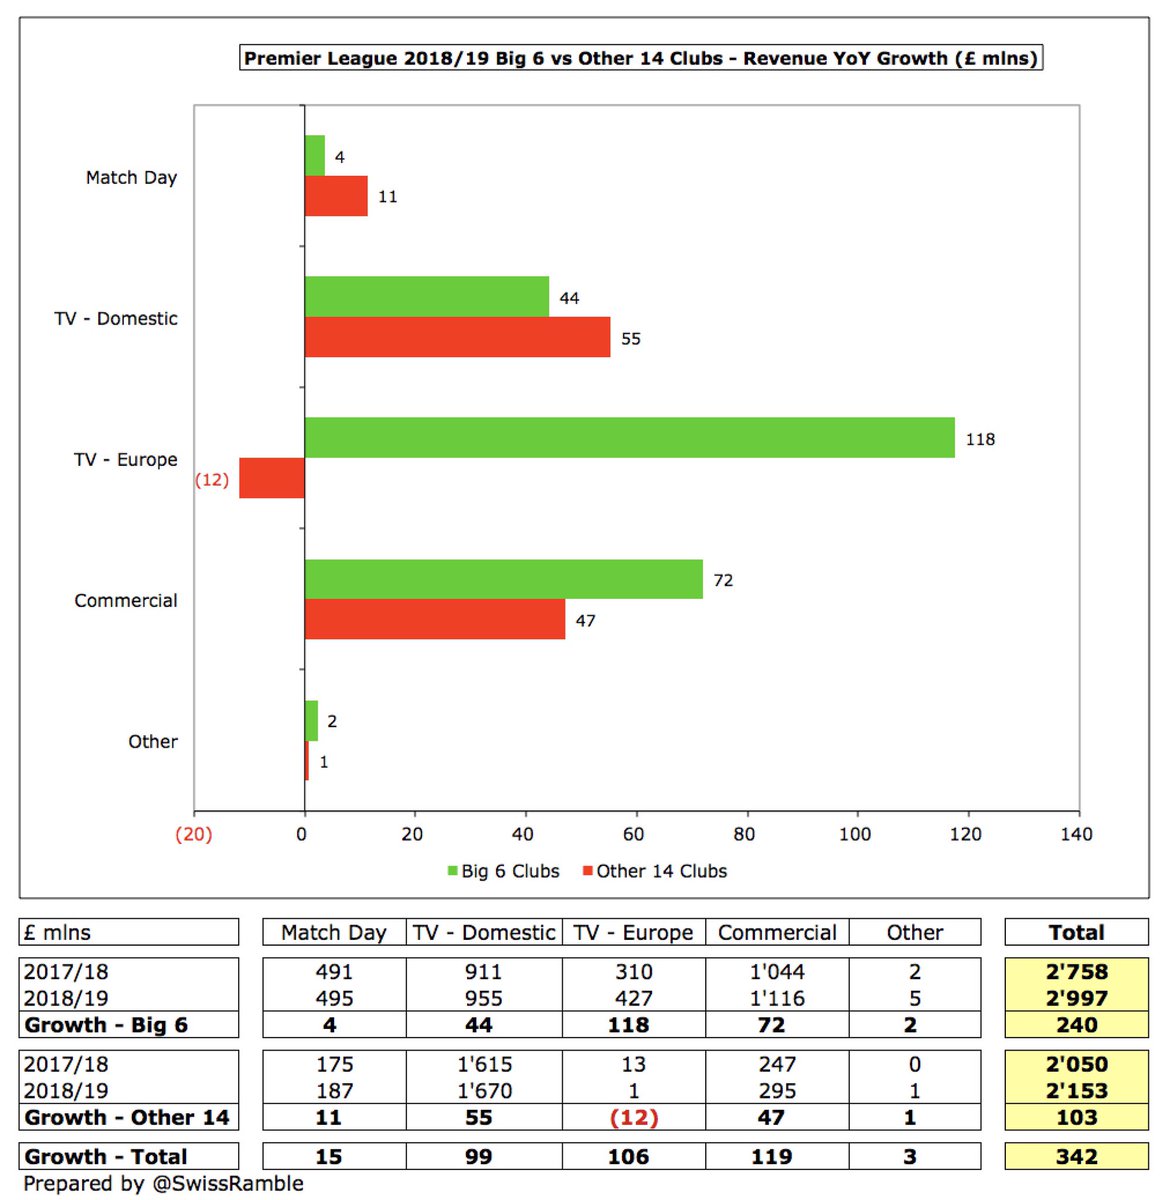
Premier League revenue grew £342m in 2019 over prior year with Big 6 £240m growth over twice as much as Other 14 £103m, largely driven by new UEFA TV deals (£118m vs minus £12m) and commercial deals (£72m vs £47m).
Although Big 6 and Other 14 revenue has grown at much the same rate (around 120%) since 2012, the gap has widened by almost half a billion pounds, increasing from £373m to £845m. Big 6 58% revenue share in 2019 is highest since 59% in 2013.
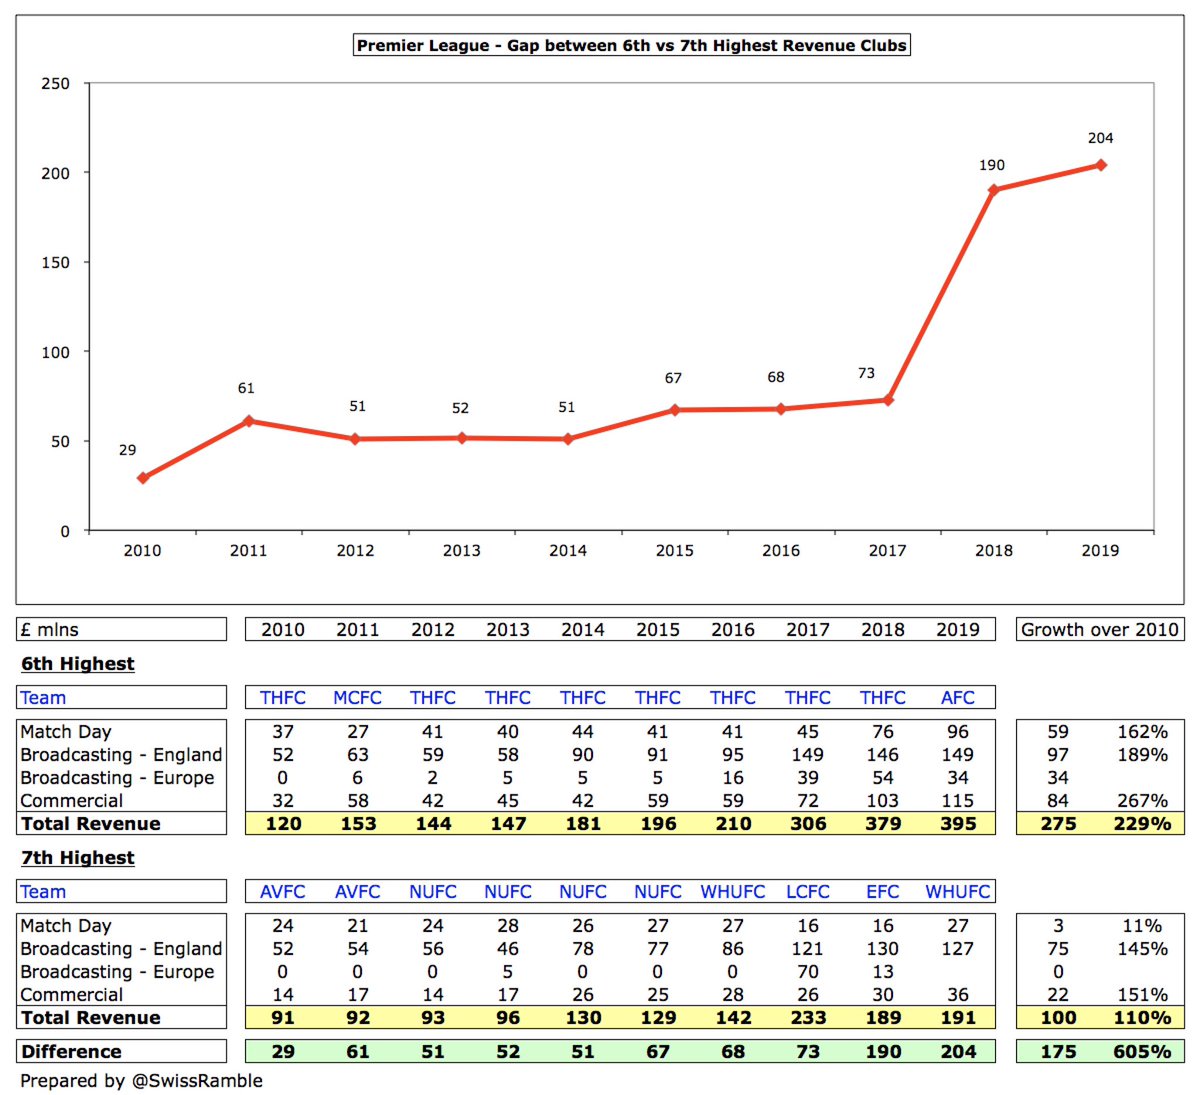
The gap between the 6th and 7th highest Premier League clubs by revenue has never been higher, rising from £190m to £204m in 2019 ( #AFC £395m vs #WHUFC £191m). The difference was as low as £73m just two years ago ( #THFC £306m vs #LCFC £233m).
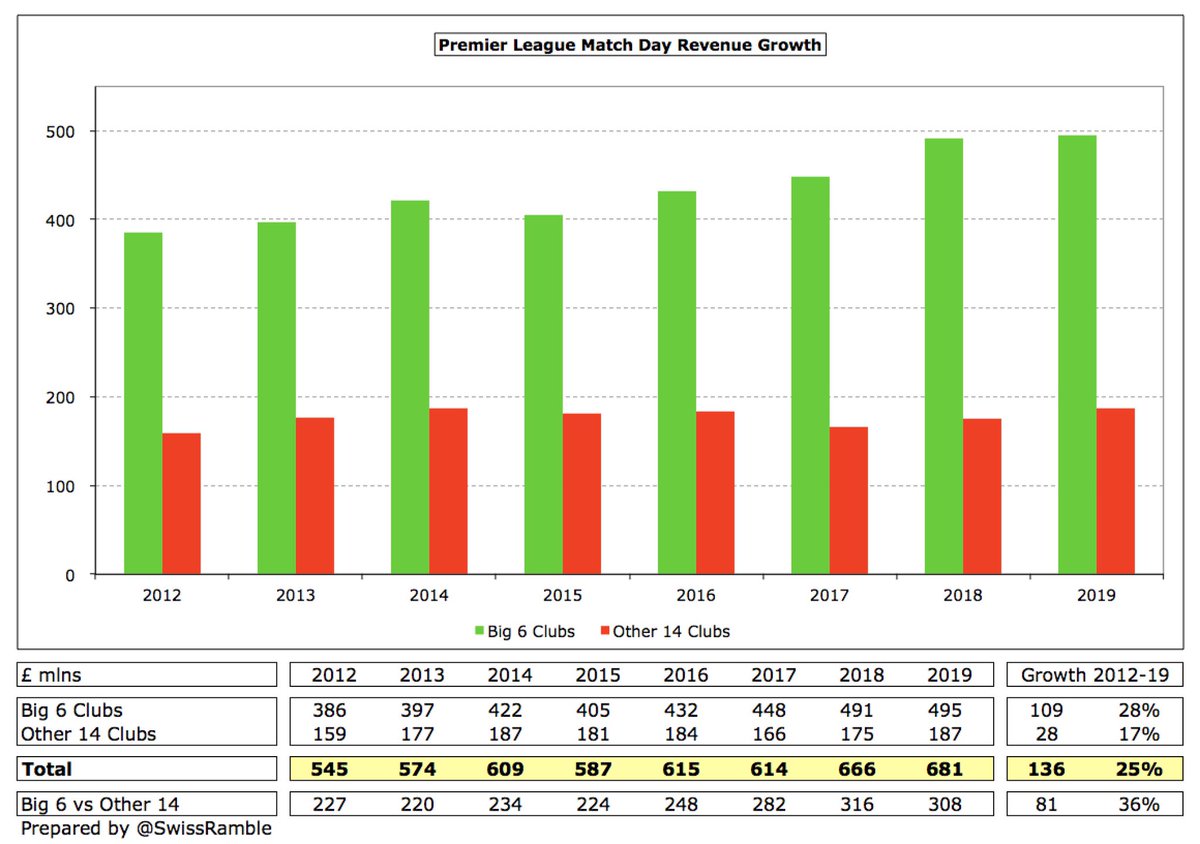
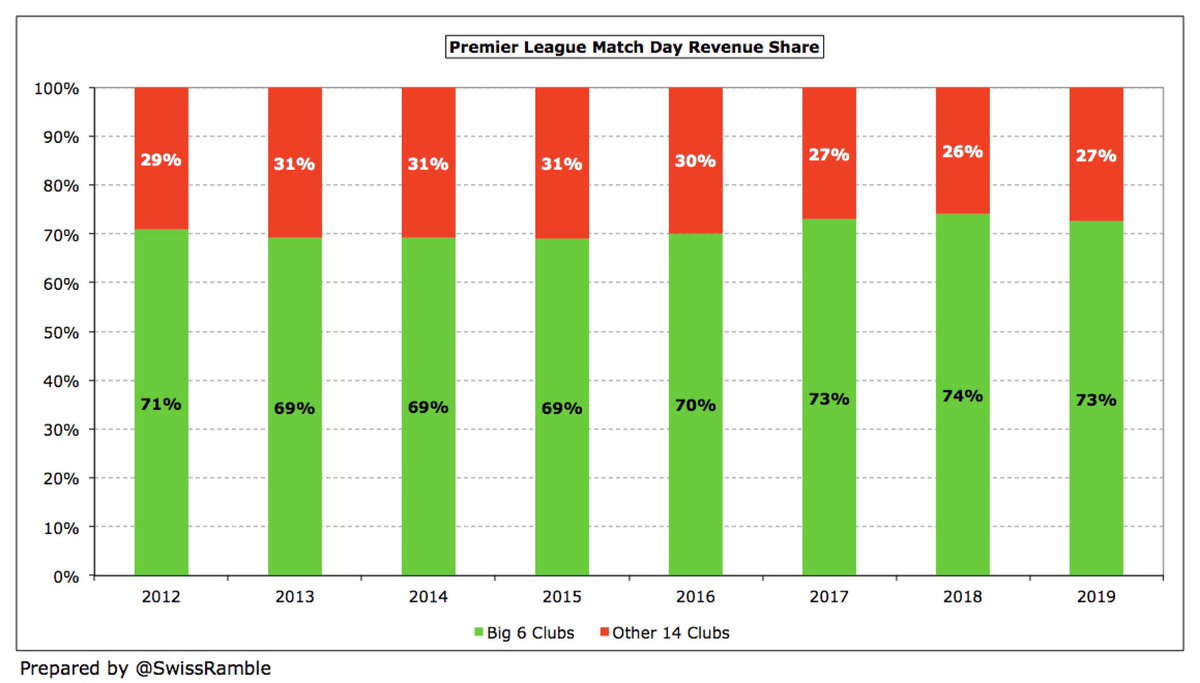
Big 6 £495m match day revenue is nearly three times as much as Other 14 £187m (73% vs 27% of £681m total). Since 2012, Big 6 has grown by £109m compared to just £28m in Other 14, so the gap has increased from £227m to £308m.
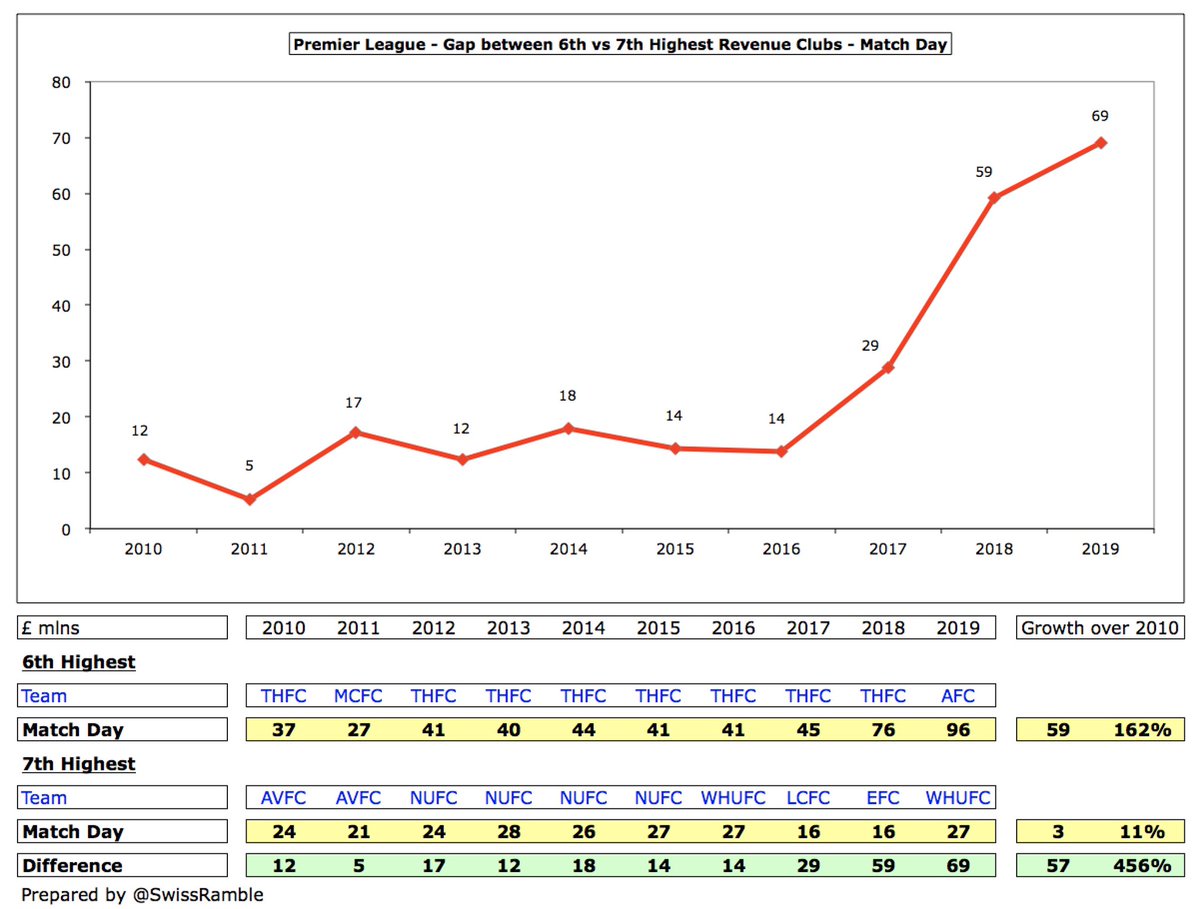
In this way, the gap between the 6th and 7th highest Premier League clubs by revenue for match day has shot up from only £14m in 2016 ( #THFC £41m vs #WHUFC £27m) to £69m in 2019 ( #AFC £96m vs #WHUFC £27m).
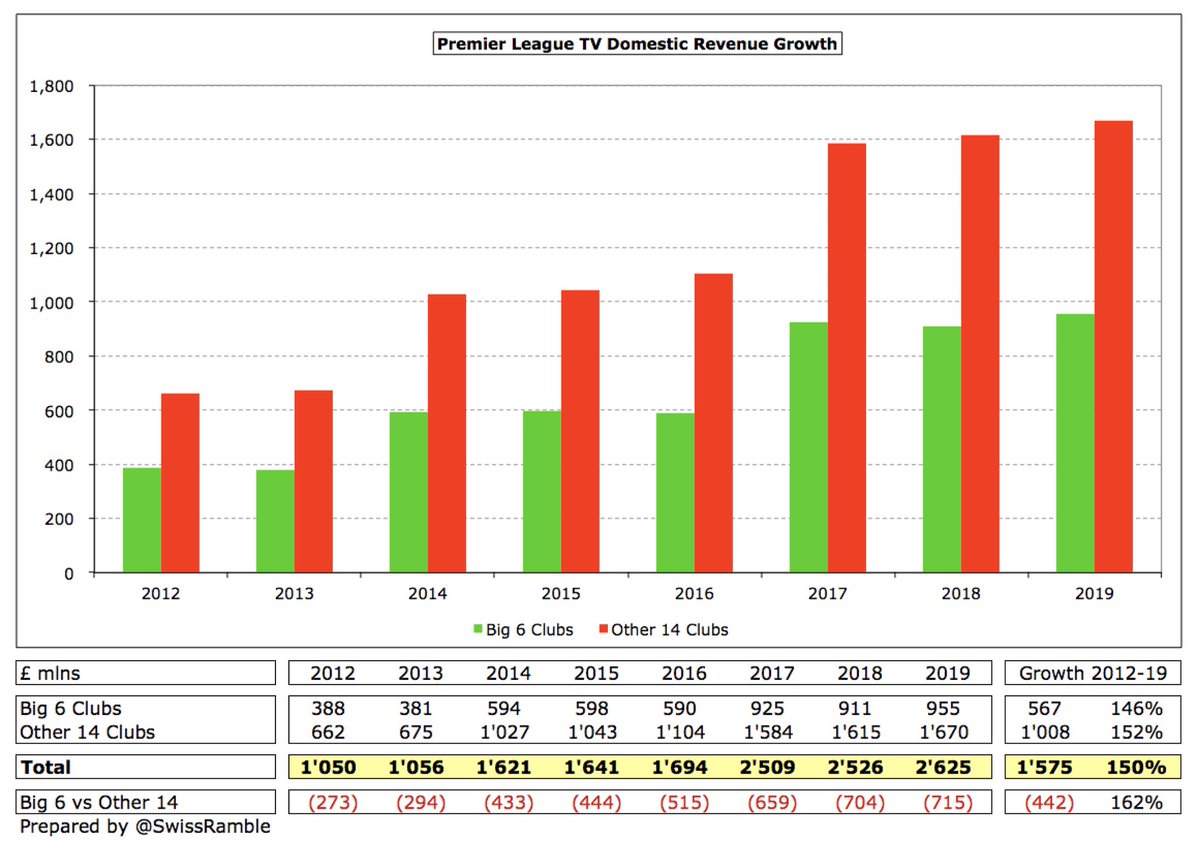
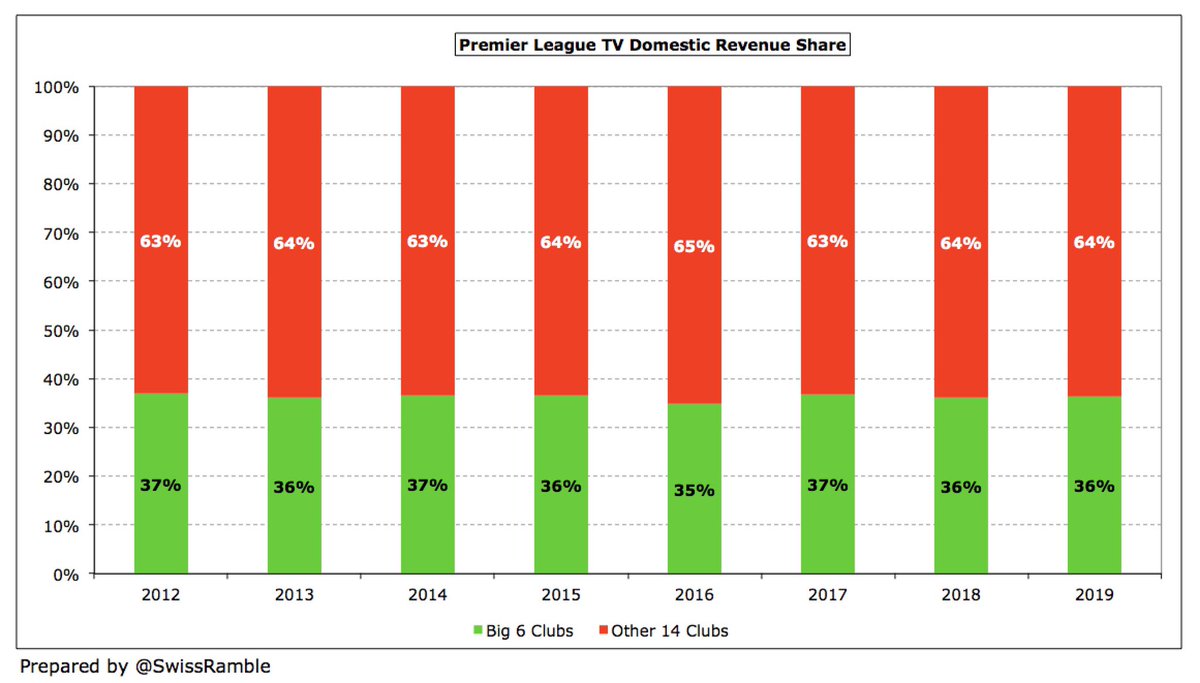
The only area where Other 14 has outpaced Big 6 is domestic broadcasting revenue, due to the fairly equitable nature of the Premier League TV deal. In fact, since 2012 the gap has nearly tripled from £273m in 2012 to £715m in 2019: Big 6 £1.0 bln (36%) vs Other 14 £1.7 bln (64%).
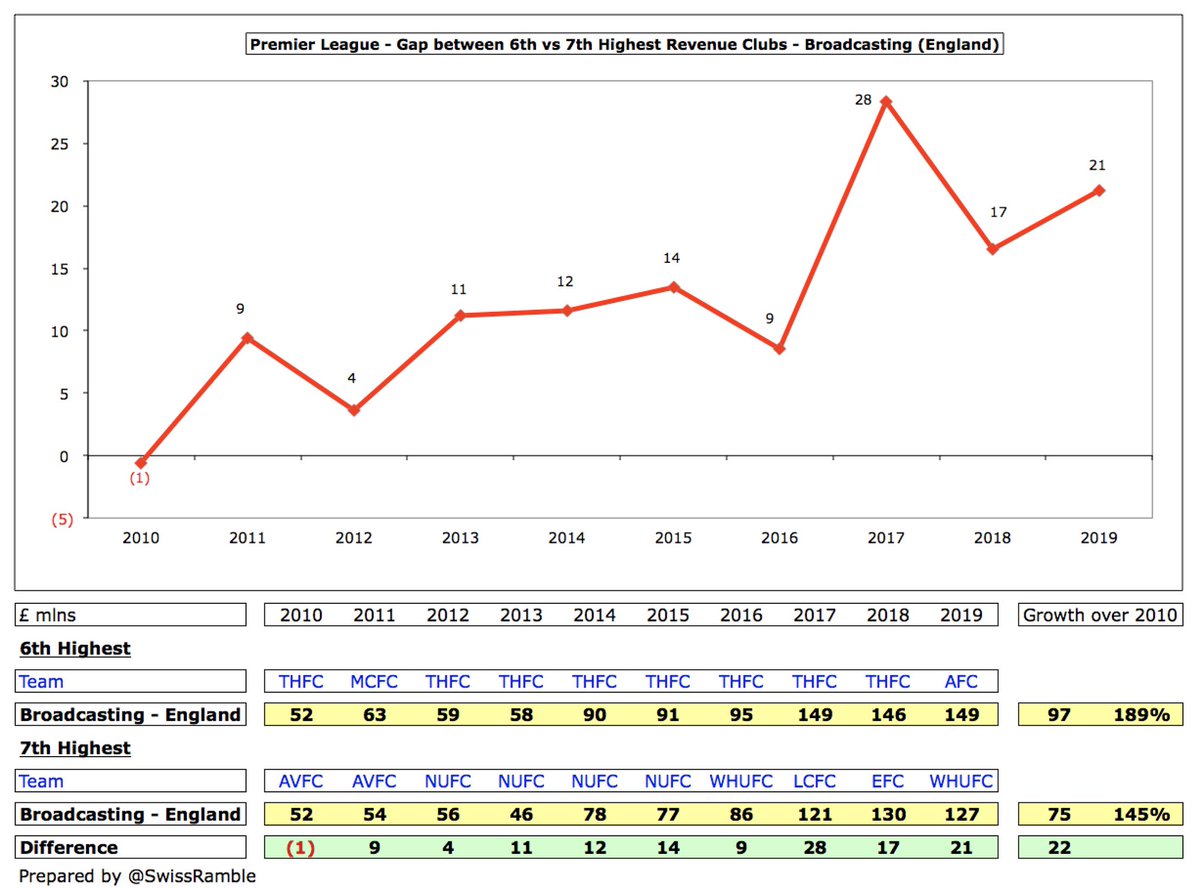
That said, the gap between the 6th and 7th highest Premier League clubs by revenue for domestic TV has steadily risen from only £4m in 2012 ( #THFC £59m vs #NUFC £56m) to £21m in 2019 ( #AFC £149m vs #WHUFC £127m).
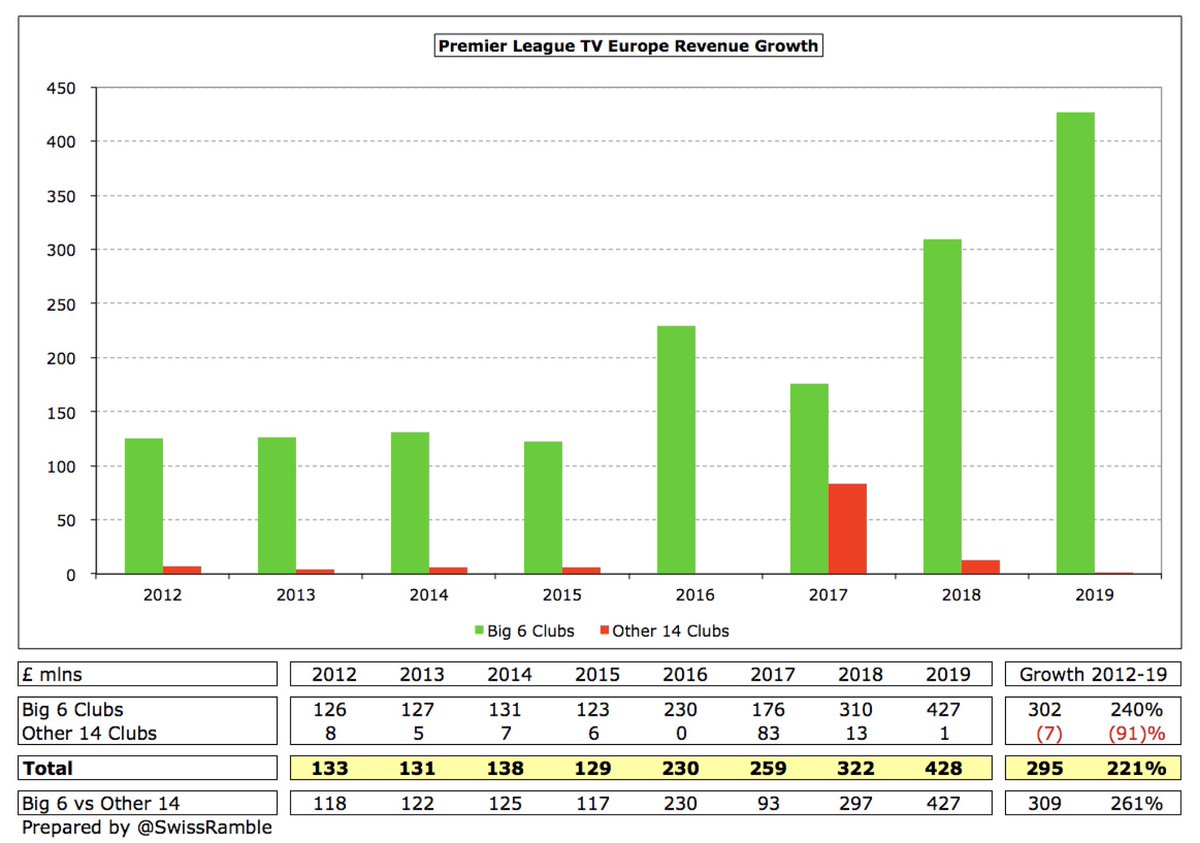
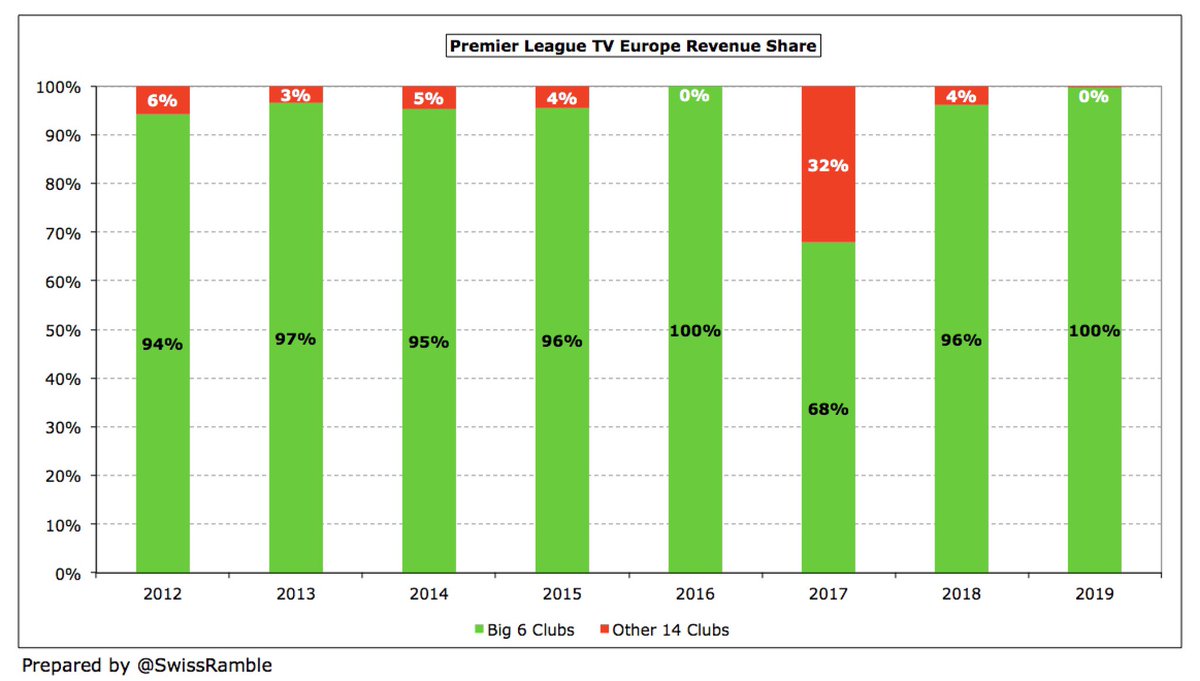
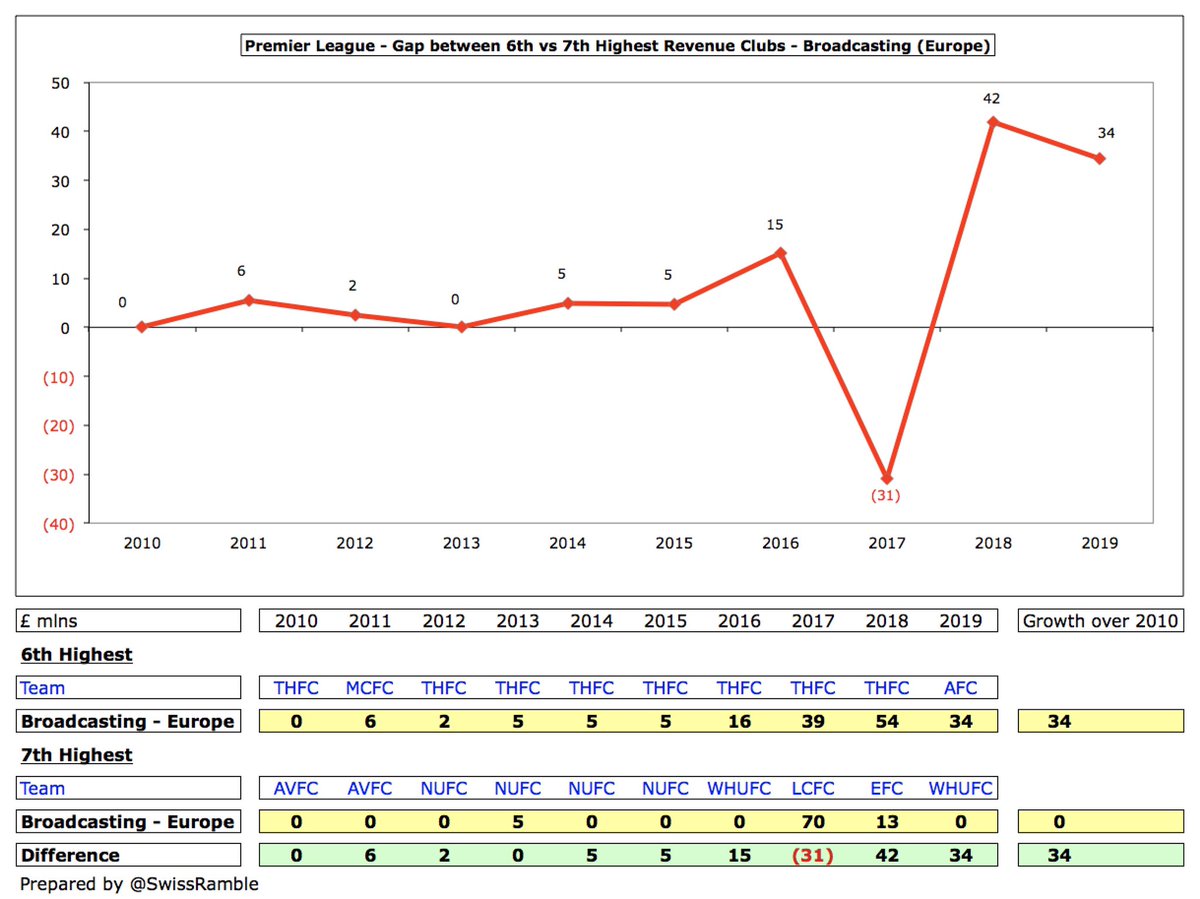
European competition has always been a huge differentiator for the Big 6, but the gap in 2019 is colossal: £427m vs just £1m. In fact, the only year where the Other 14 clubs have earned more than £13min last 8 years was 2017, thanks to #LCFC Champions League exploits.
The 6th highest Premier League club by revenue, namely #AFC, saw its European TV revenue drop to £34m in 2019, but this was still £34m higher than the 7th placed club #WHUFC, as they did not qualify for Europe. In 2018 the gap was £42m, as #THFC £54m was more than #EFC £13m.
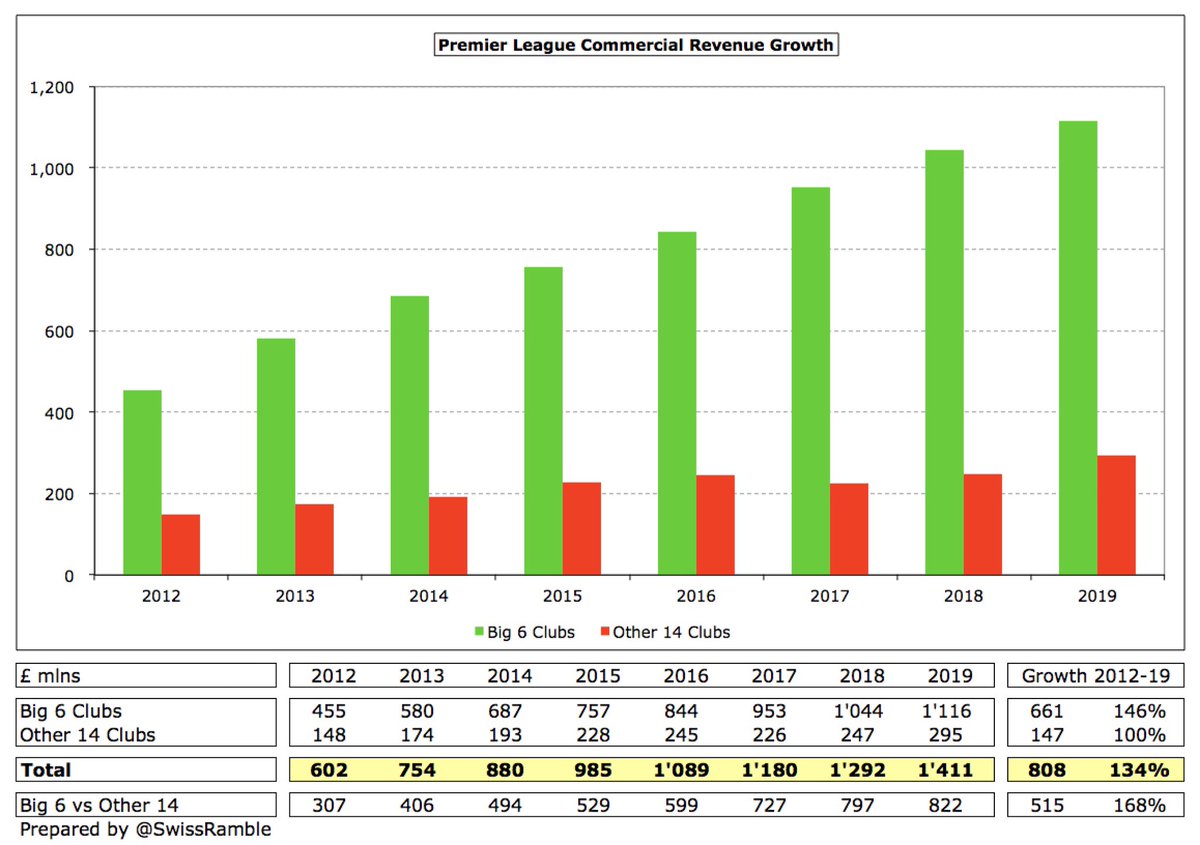
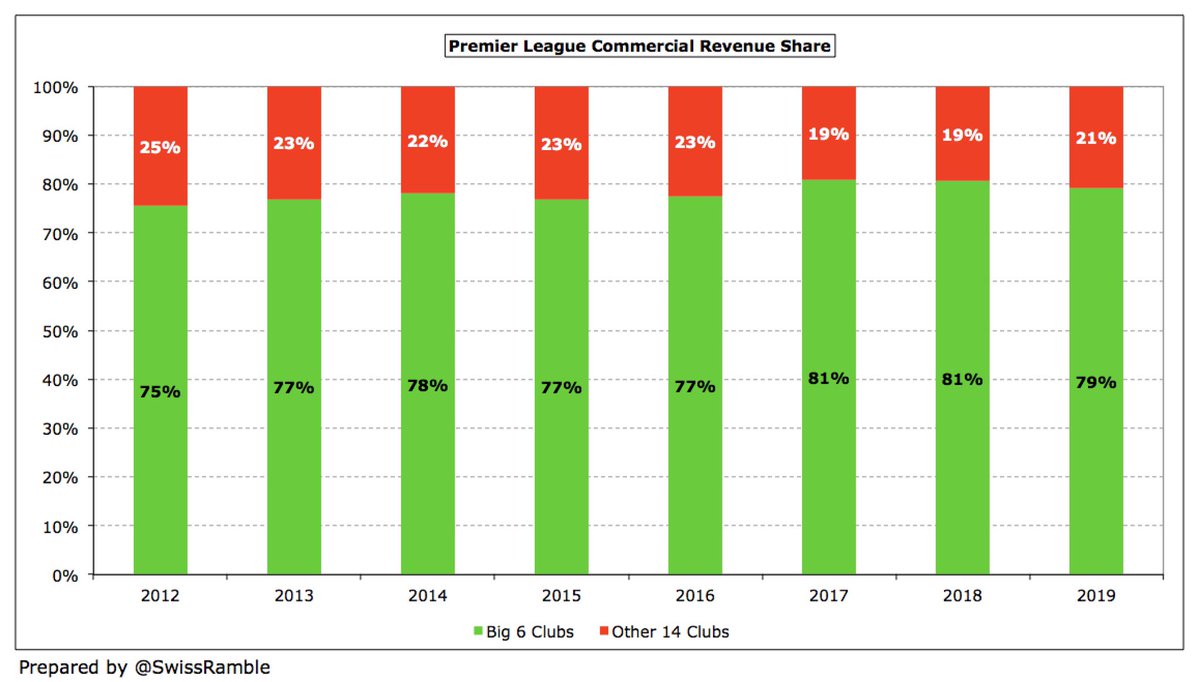
Another area where Big 6 has significantly outpaced Other 14 is commercial with the gap widening by over half a billion pounds from £307m in 2012 to £822m in 2019 (£1.1 bln vs £295m). That said, Big 6 share of total commercial revenue has slightly fallen from 81% to “only” 79%.
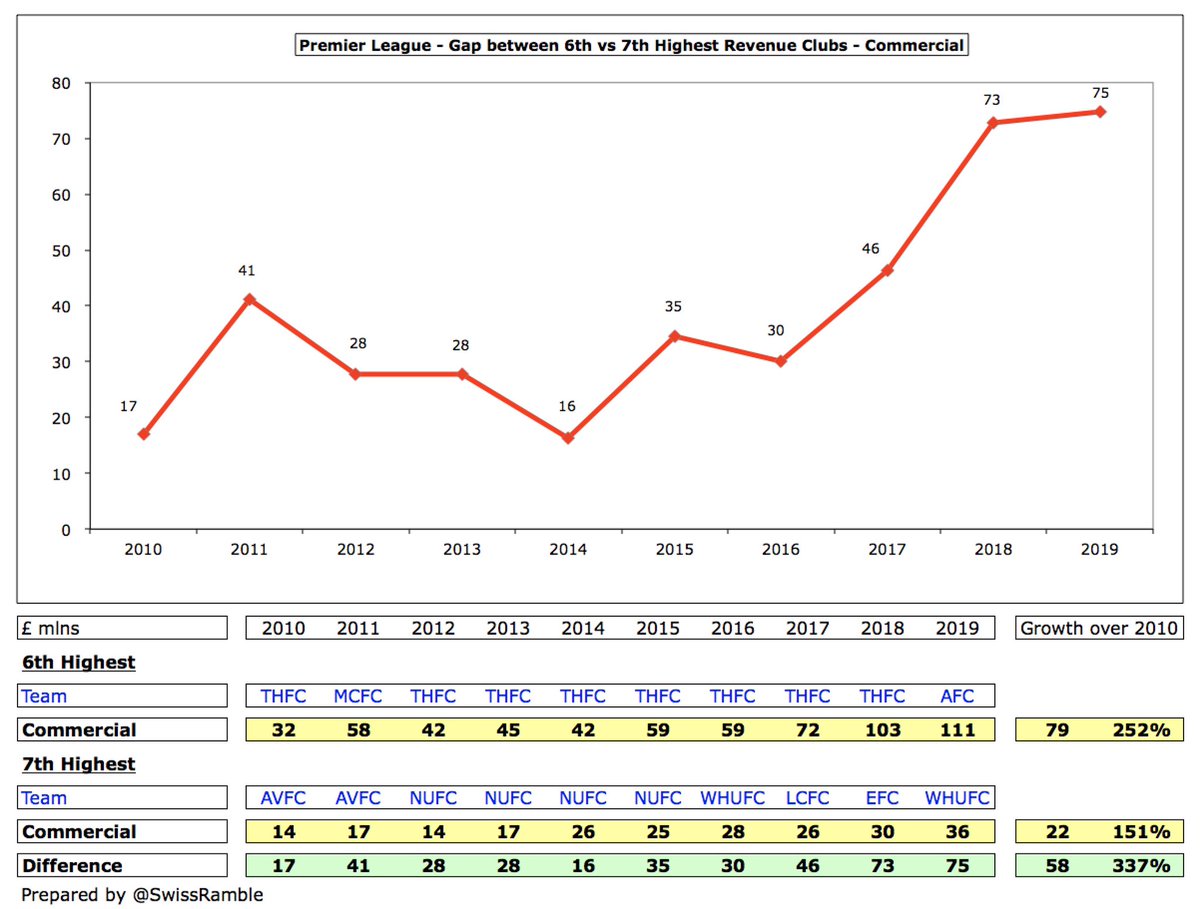
The gap between the 6th and 7th highest Premier League clubs by revenue for commercial has shot up from only £16m in 2014 ( #THFC £42m vs #NUFC £26m) to £75m in 2019 ( #AFC £111m vs #WHUFC £36m), the highest ever.
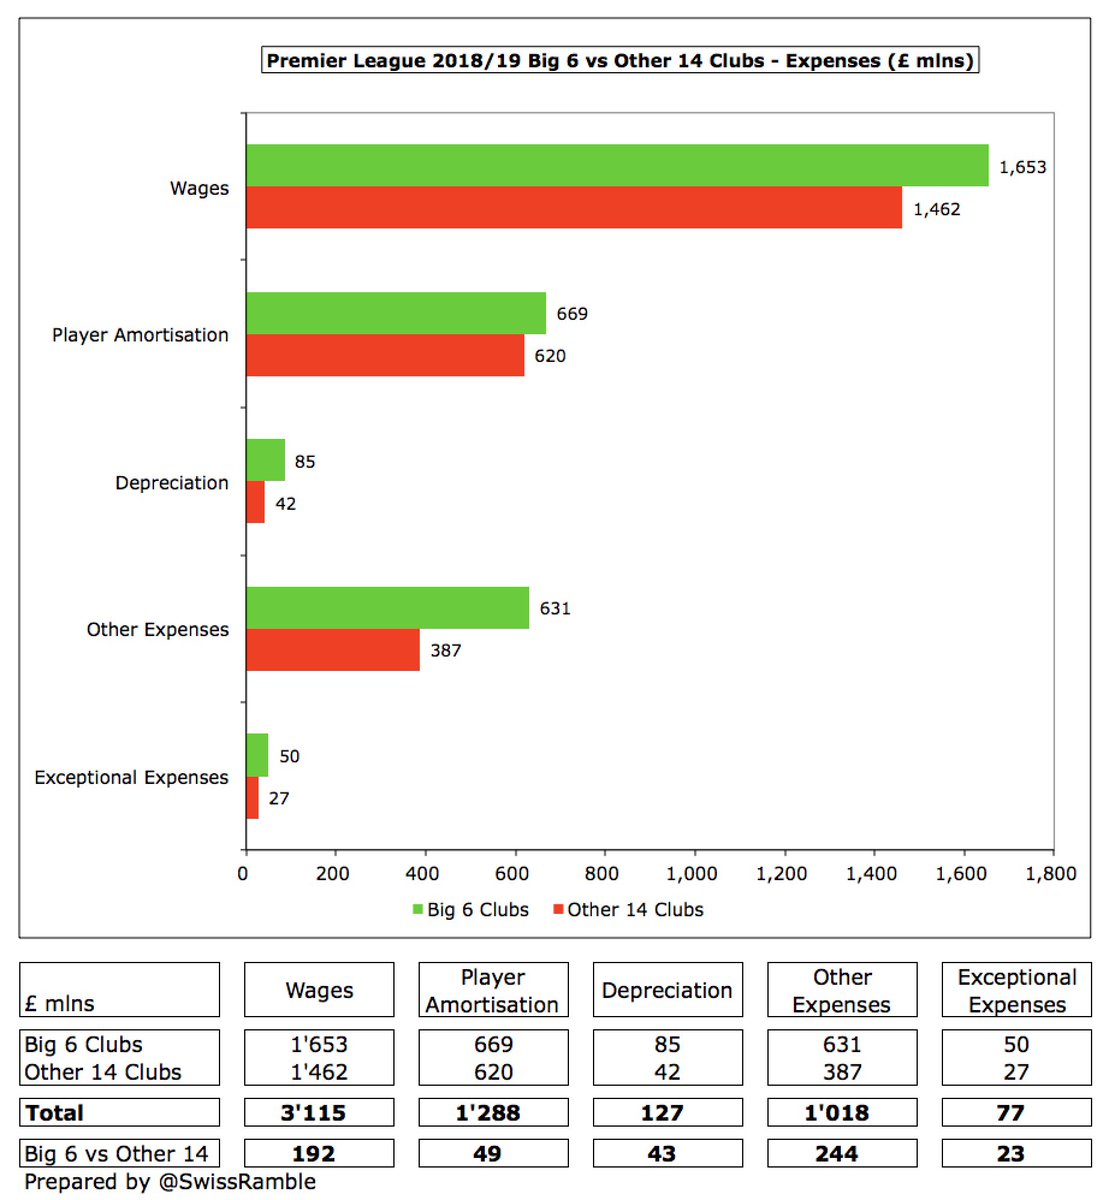
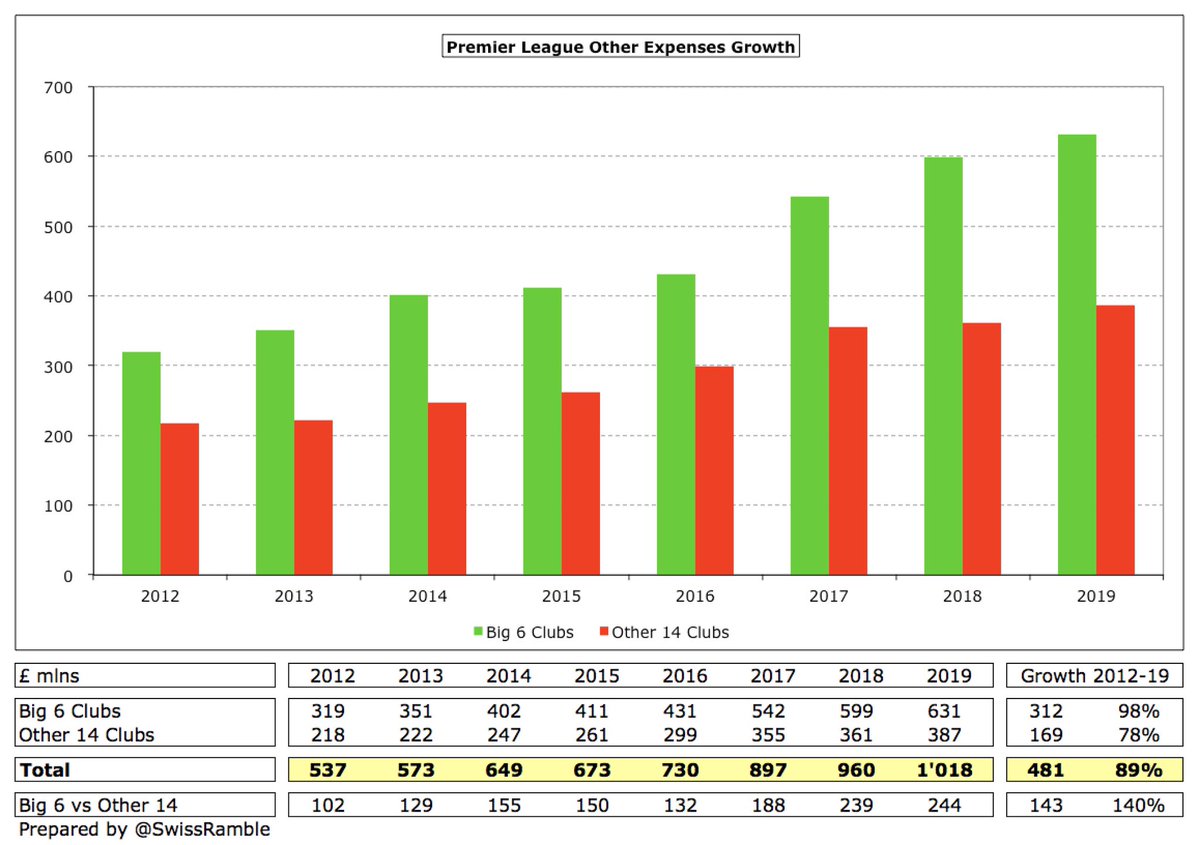
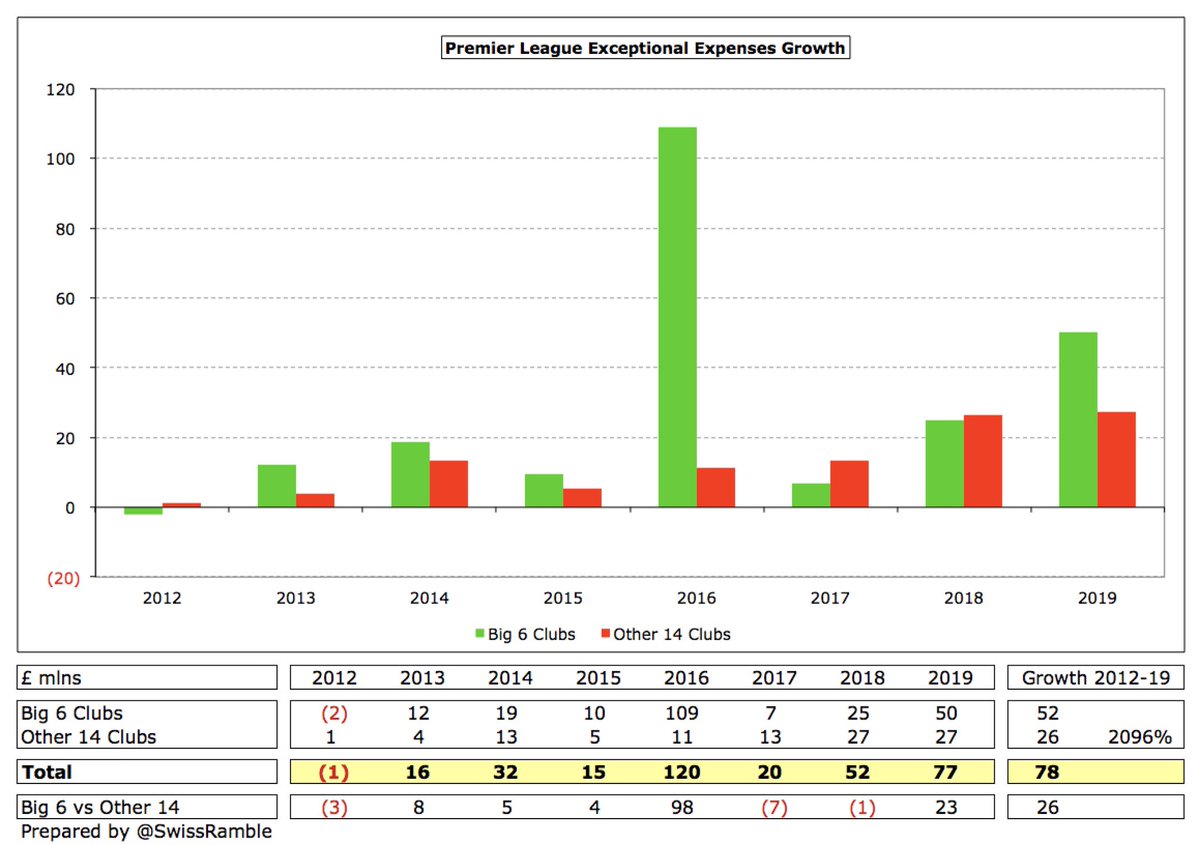
Similar to revenue, Big 6 expenses are invariably higher than Other 14, notably wages (£1.7 bln vs £1.5 bln) and player amortisation (£669m vs £620m). This is also the case for depreciation (£85m vs £42m), other expenses (£631m vs £387m) and exceptional charges (£50m vs £27m).
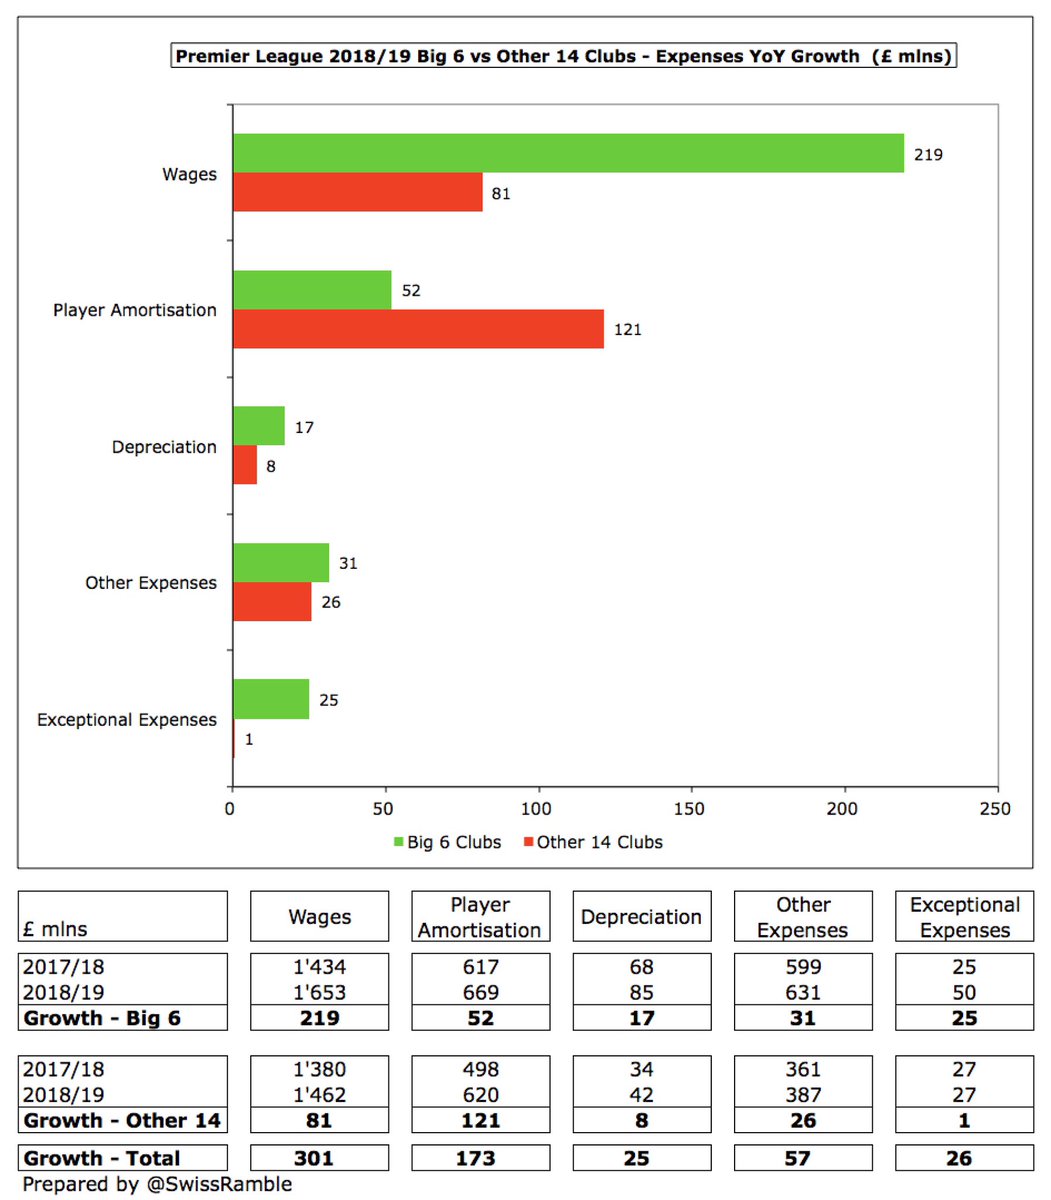
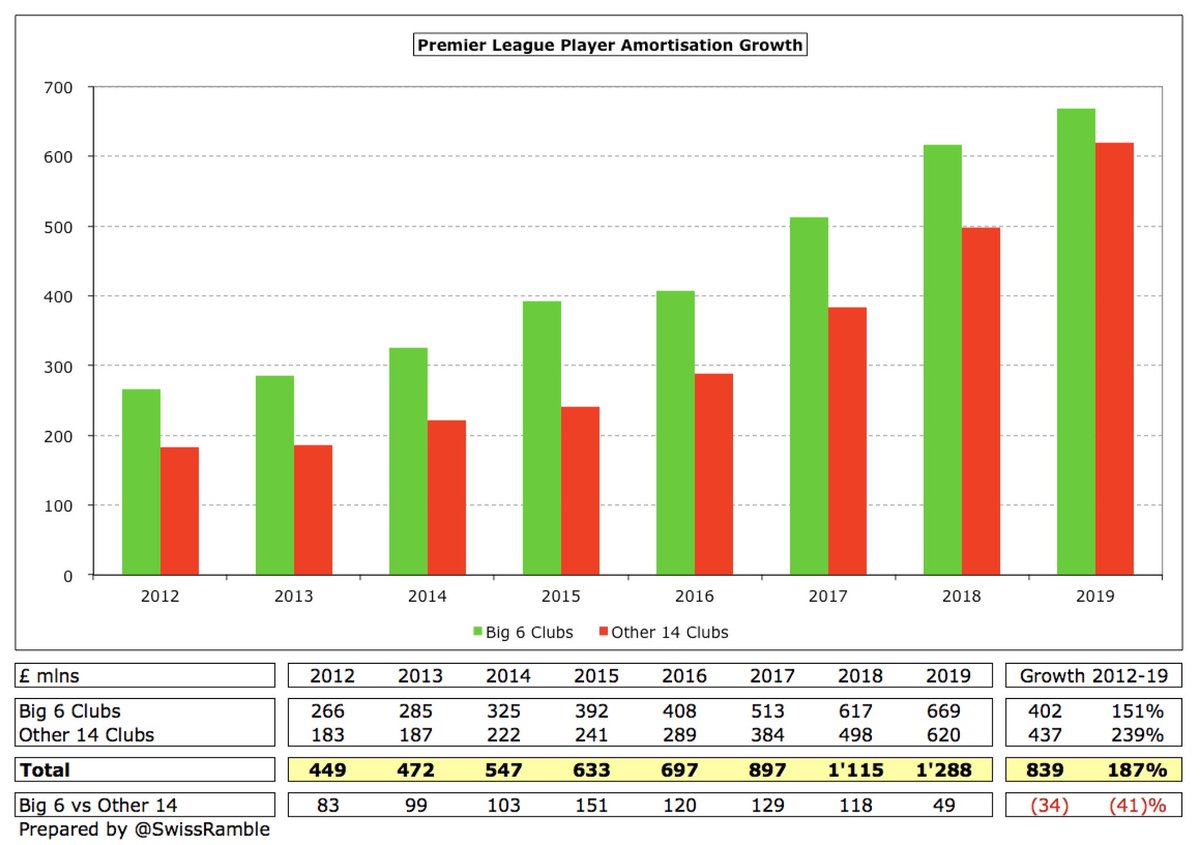
Big 6 £219m wages growth over prior year was more than twice as much as Other 14 £81m, but it is worth noting that player amortisation increased more at the Other 14 (£121m) than Big 6 (£52m).
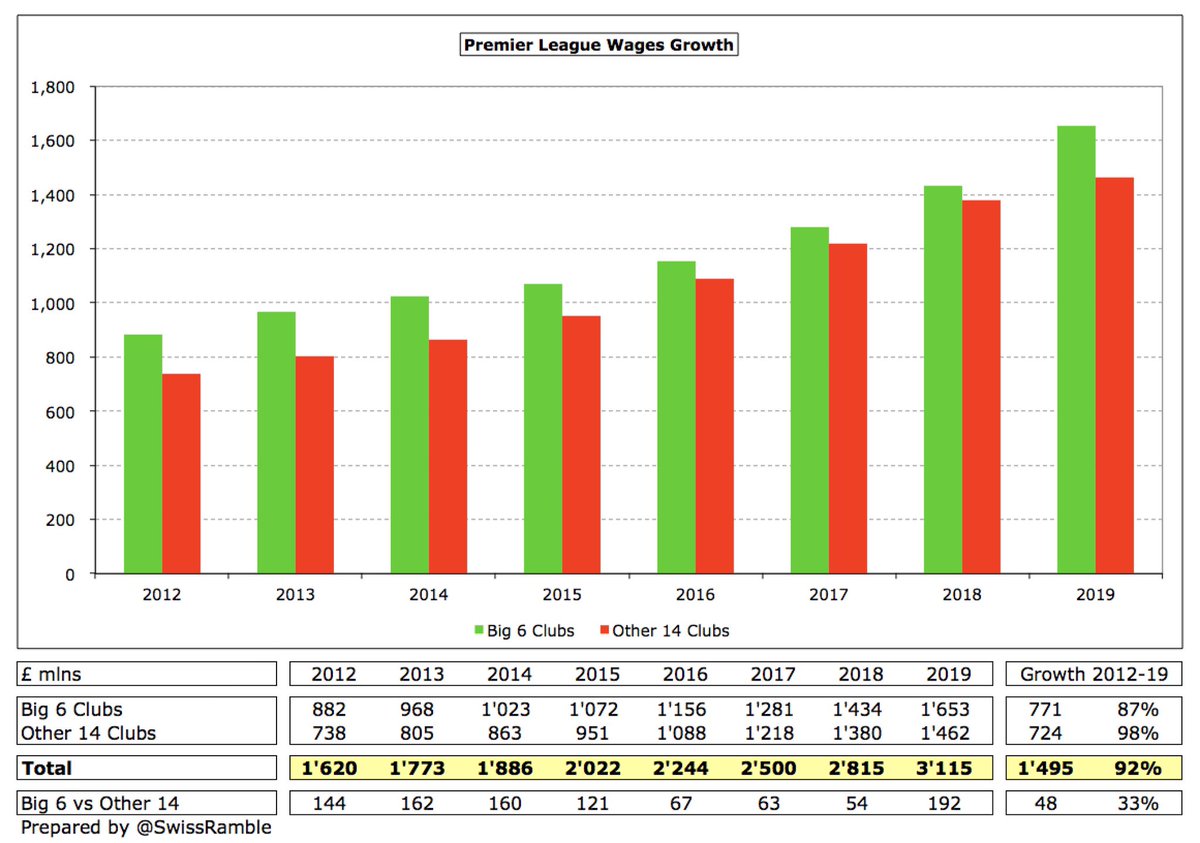
Interestingly, since 2012 wages growth at Big 6 (£771m) and Other 14 (£724m) has been very similar, both having nearly doubled in this period, though the gap widened in 2019 to £192m (£1.7 bln vs £1.5 bln), having narrowed to just £54m in 2018.
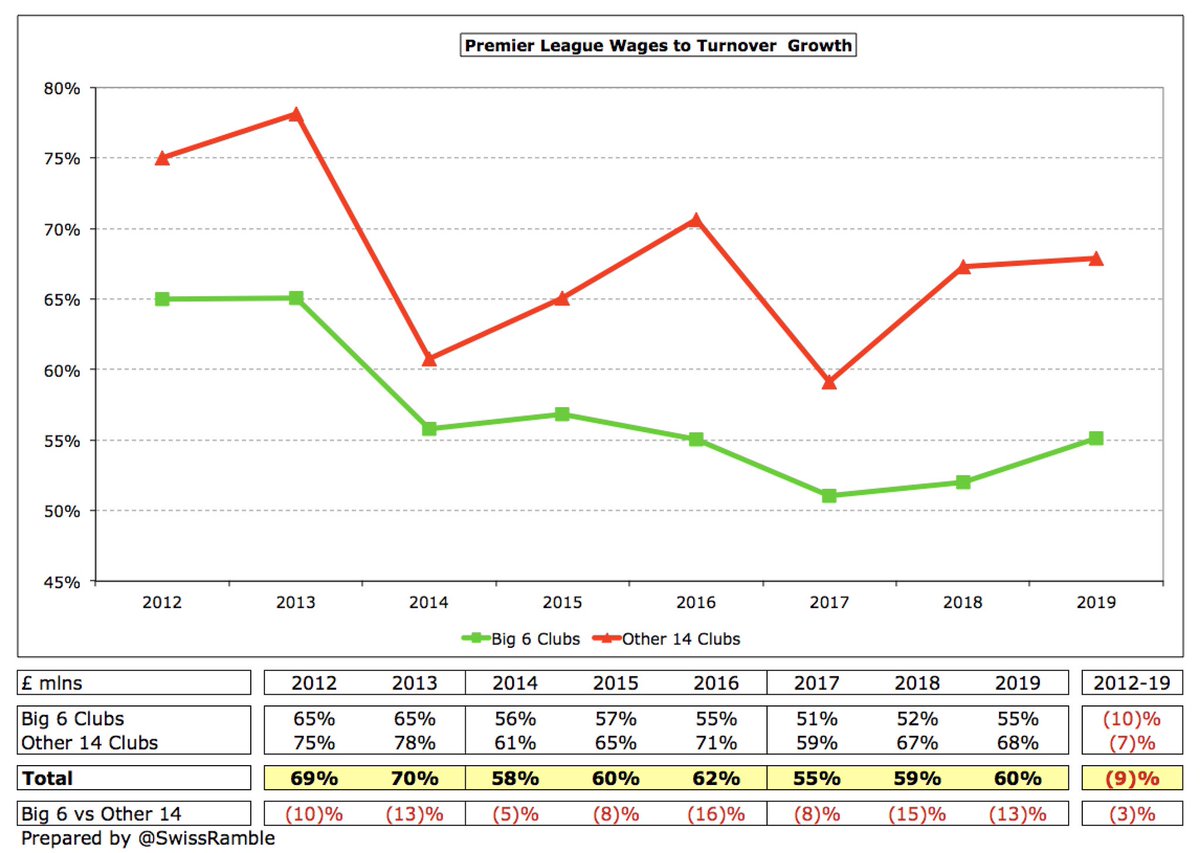
Although wages to turnover ratios worsened in 2019 (Big 6 from 52% to 55%, Other 14 from 67% to 68%), it is interesting that these have improved since 2012 (Big 6 down from 65%, Other 14 from 75%). Lowest ratios are seen in first year of 3-year PL TV deal (2014 and 2017).
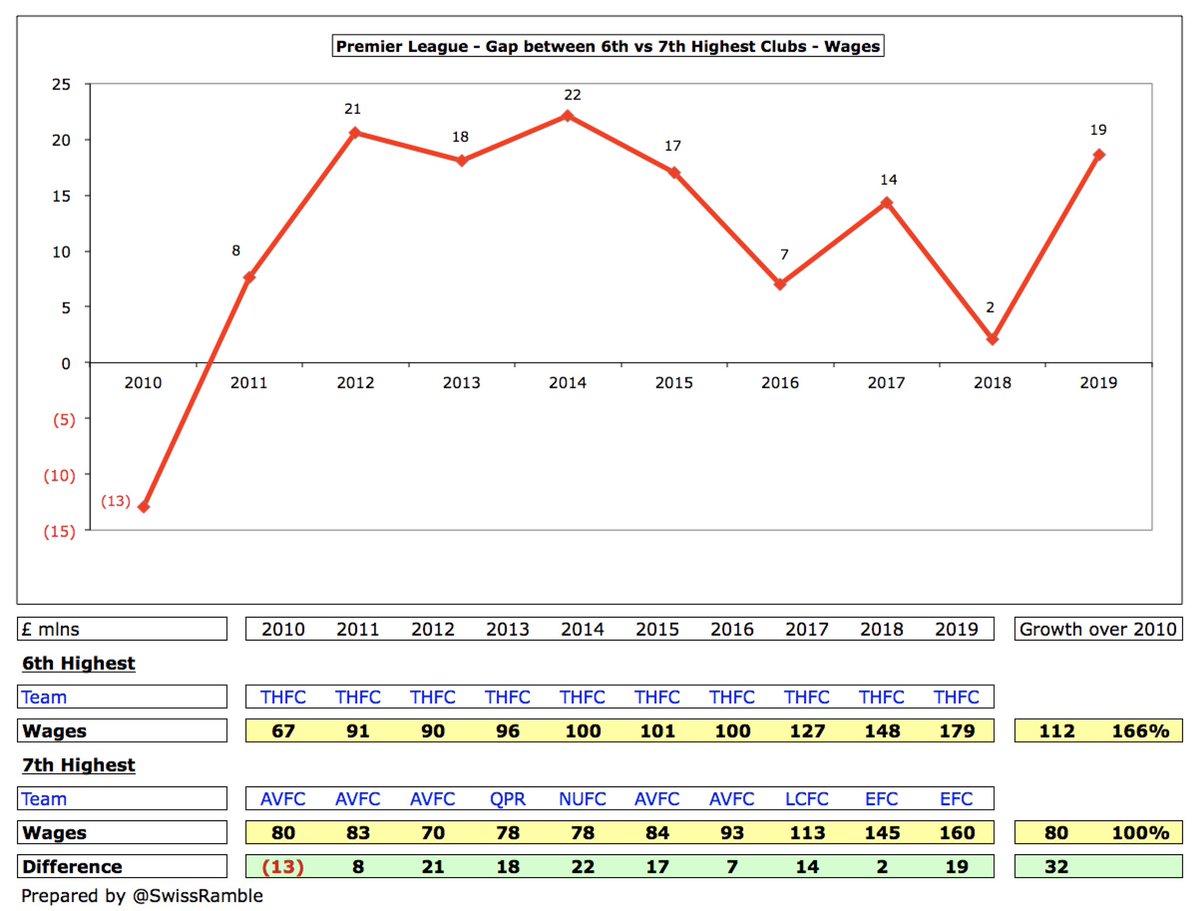
In contrast to revenue, the gap between the 6th and 7th highest wages clubs in the Premier League has not really grown much in the last few years, though rose from just £2m in 2018 to £19m in 2019 ( #THFC £179m vs. #EFC £160m), partly due to FFP, which restricted wages growth.
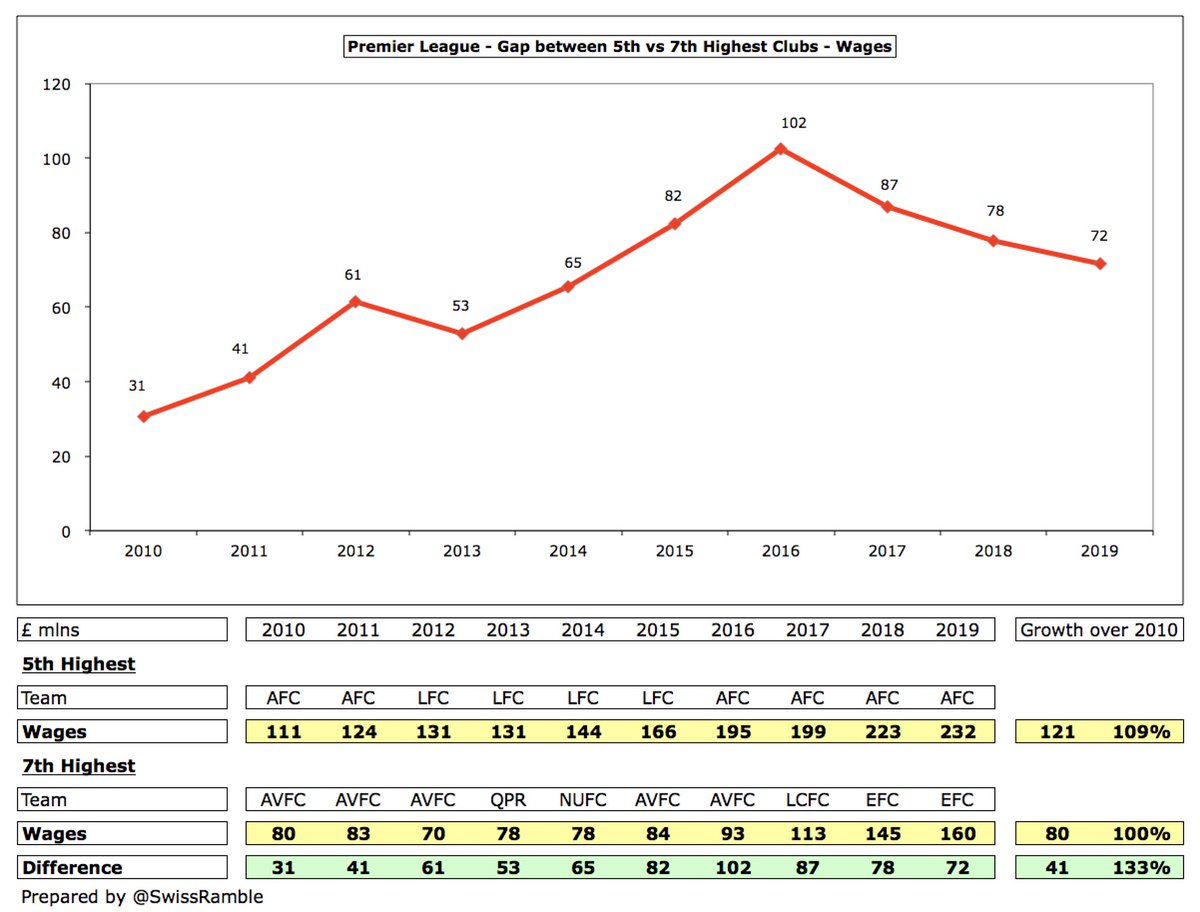
However, small wages gap is also due to #THFC’s frugal approach, so it’s worth also looking at the gap between the 5th and 7th placed clubs. Here, the gap has increased since 2010 from £31m to £72m ( #AFC £232m vs #EFC £160m), though has narrowed in last 3 years from £102m peak.
Player amortisation, the annual charge to write-off transfer fees over the length of a player’s contract, has risen significantly at Other 14 clubs in past few years, so the gap to Big 6 has closed from £151m in 2015 to £49m in 2019 (£669m vs £620m).
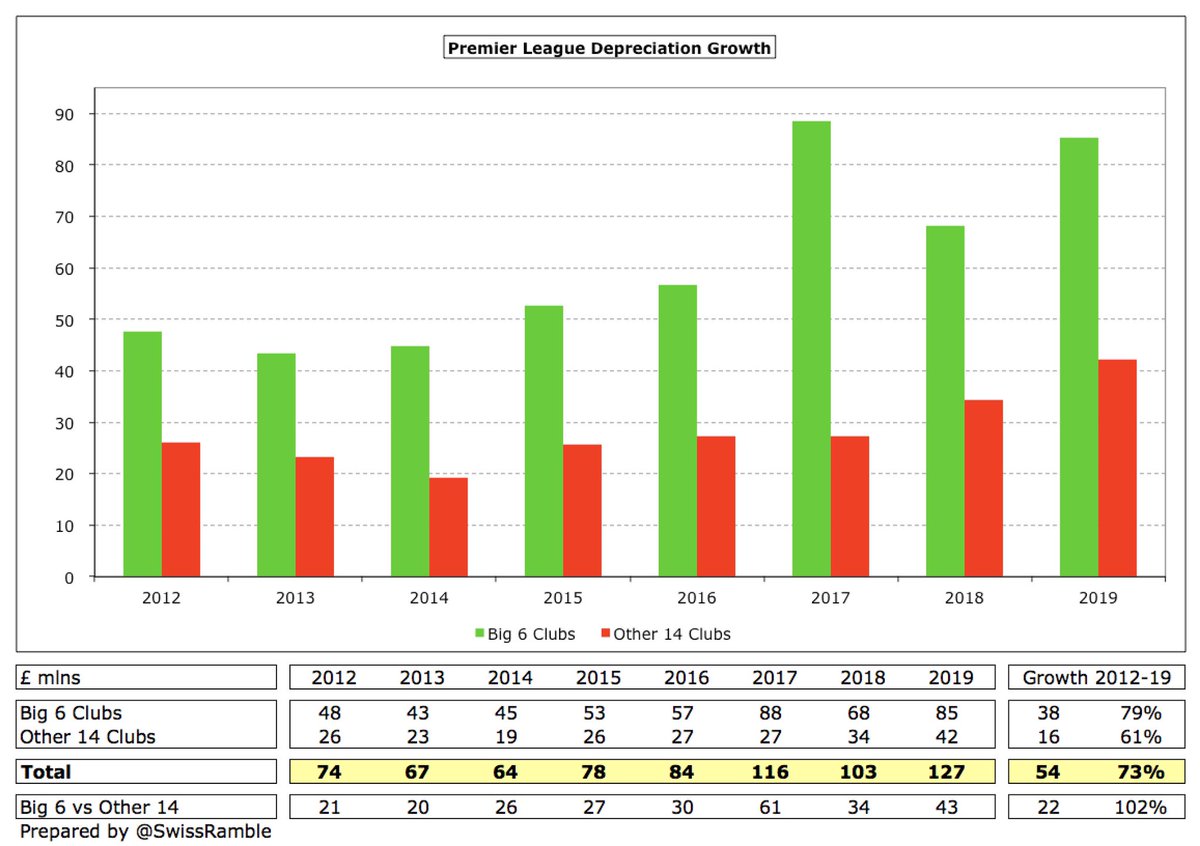
Big 6 £85m depreciation is double Other 14 £42m with the gap widening from £20m in 2013 to £43m in 2019, mainly thanks to #THFC investment in new stadium and #LFC stand expansion.
Big 6 other operating expenses have risen by £312m in the last seven years from £319m to £631m in 2019, while Other 14 are up £169m from £218m to £387m in the same period. As a result, the gap has substantially widened from £102m to £244m.
Big 6 also tend to have more exceptional expenses, usually severance payments for outgoing managers and their staff, and 2019 was no different (£50m vs £27m). Over half of these expenses (£126m) was incurred by #CFC in last 8 years.
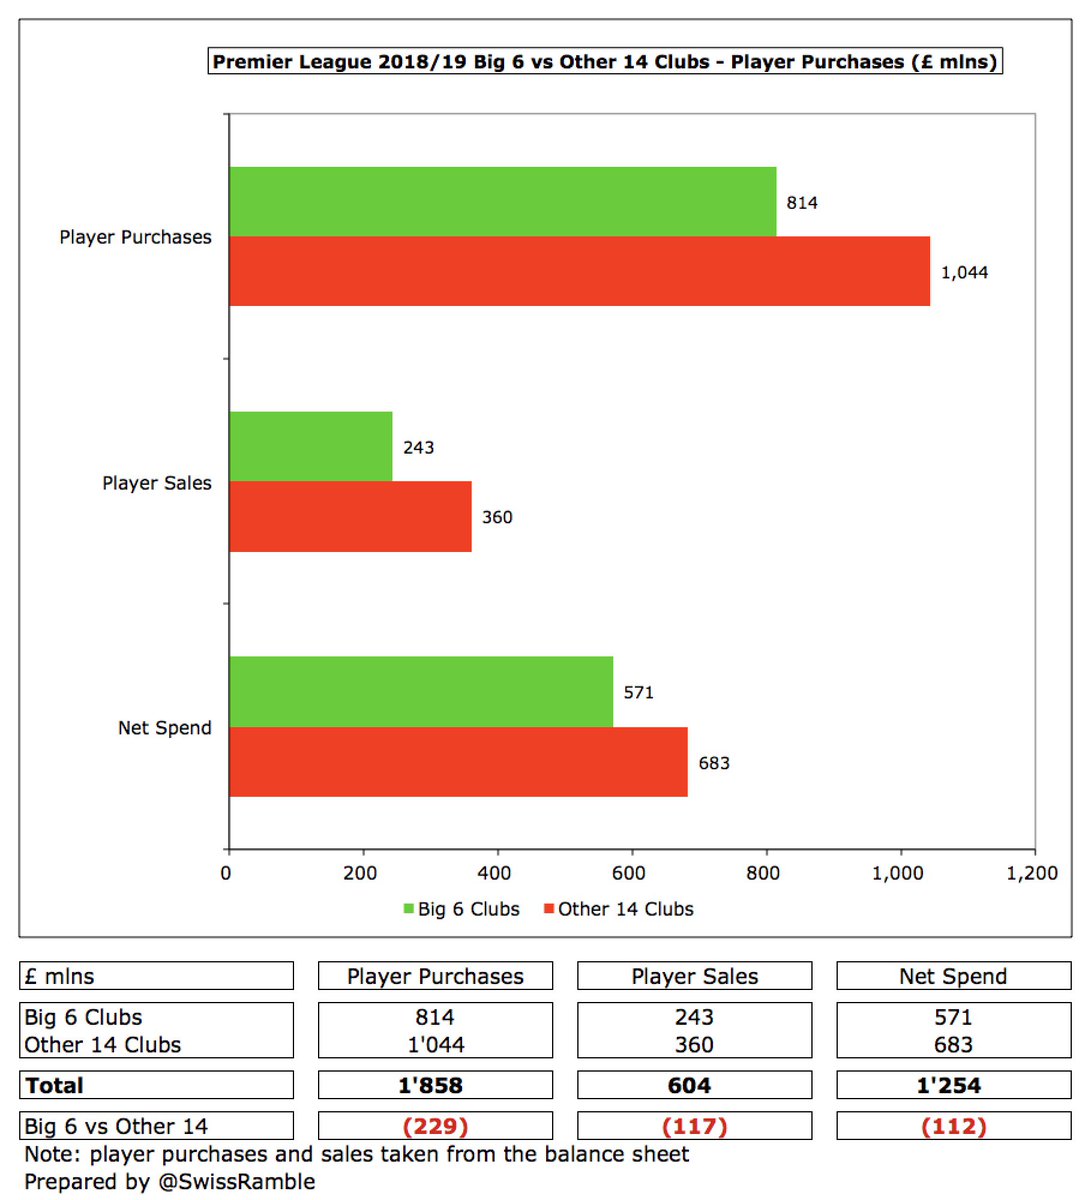
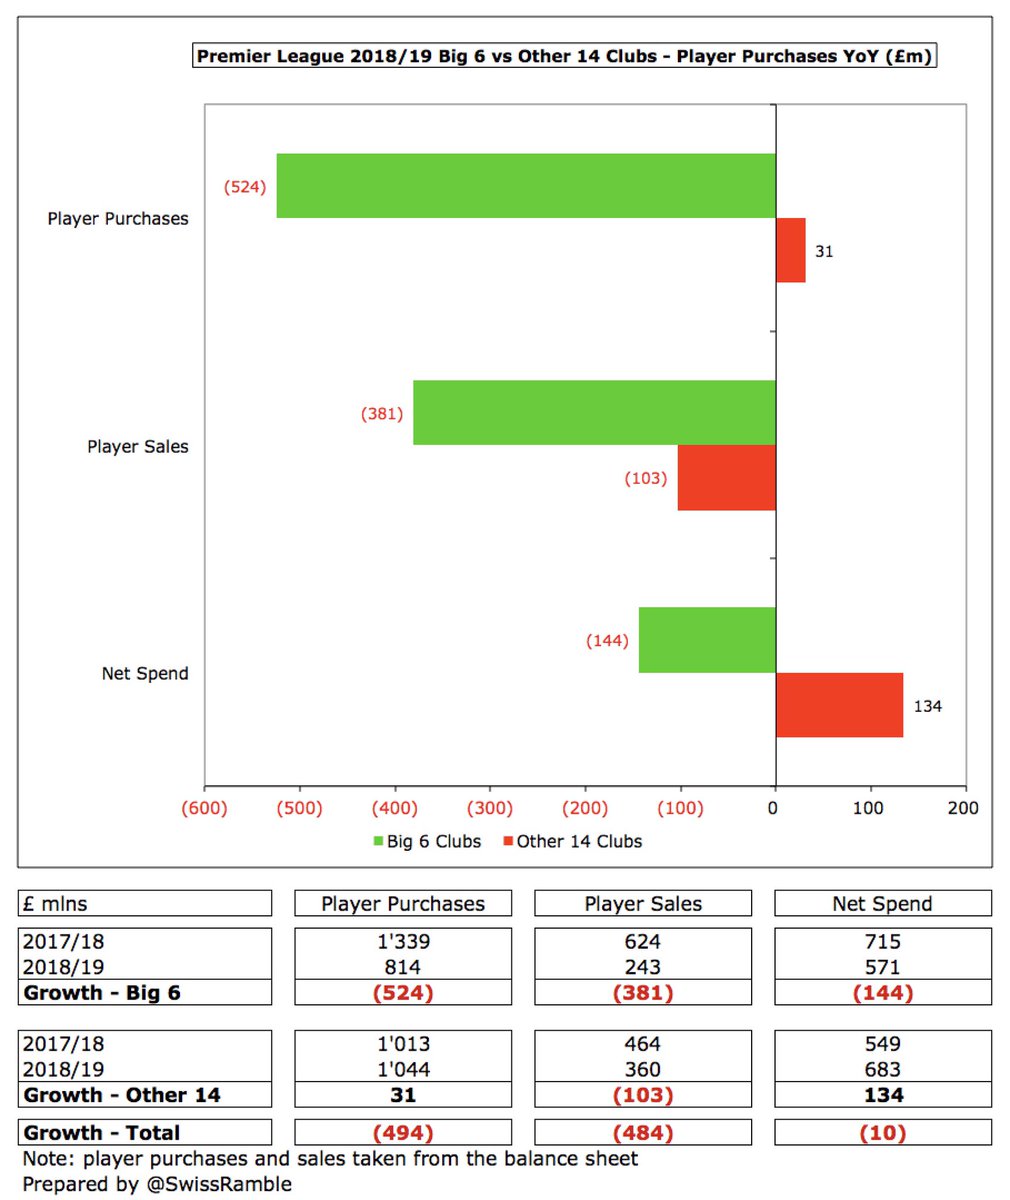
Other 14 spent more on players than Big 6 in 2019: purchases £1.0 bln vs £814m; sales £360m vs £243m; net spend £683m vs £571m. This was the reverse of the previous season, when Big 6 spent £326m more on player purchases and £166m more net spend.
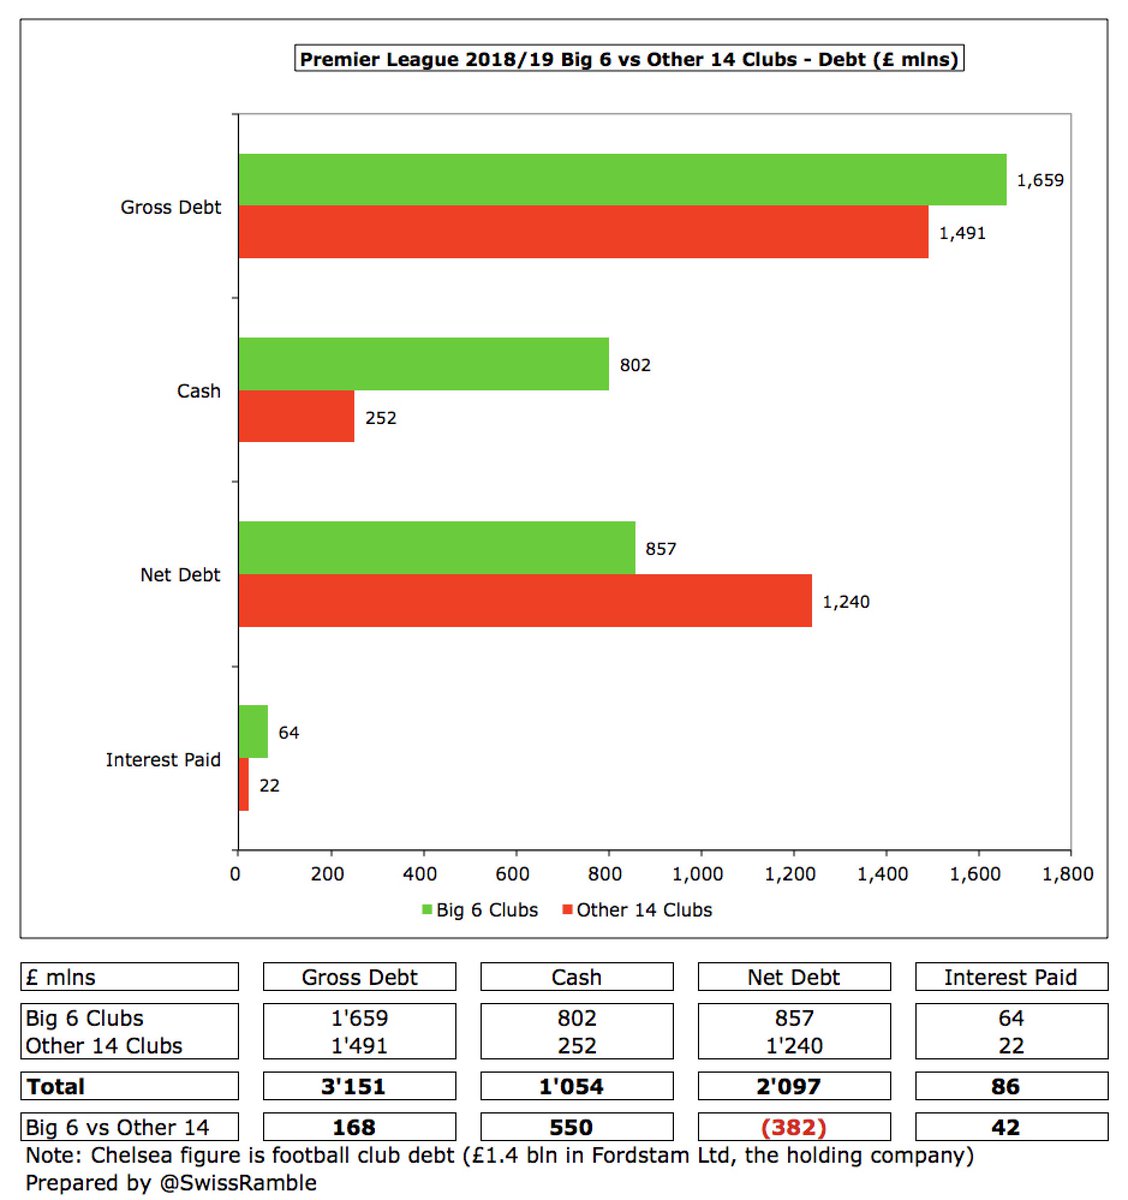
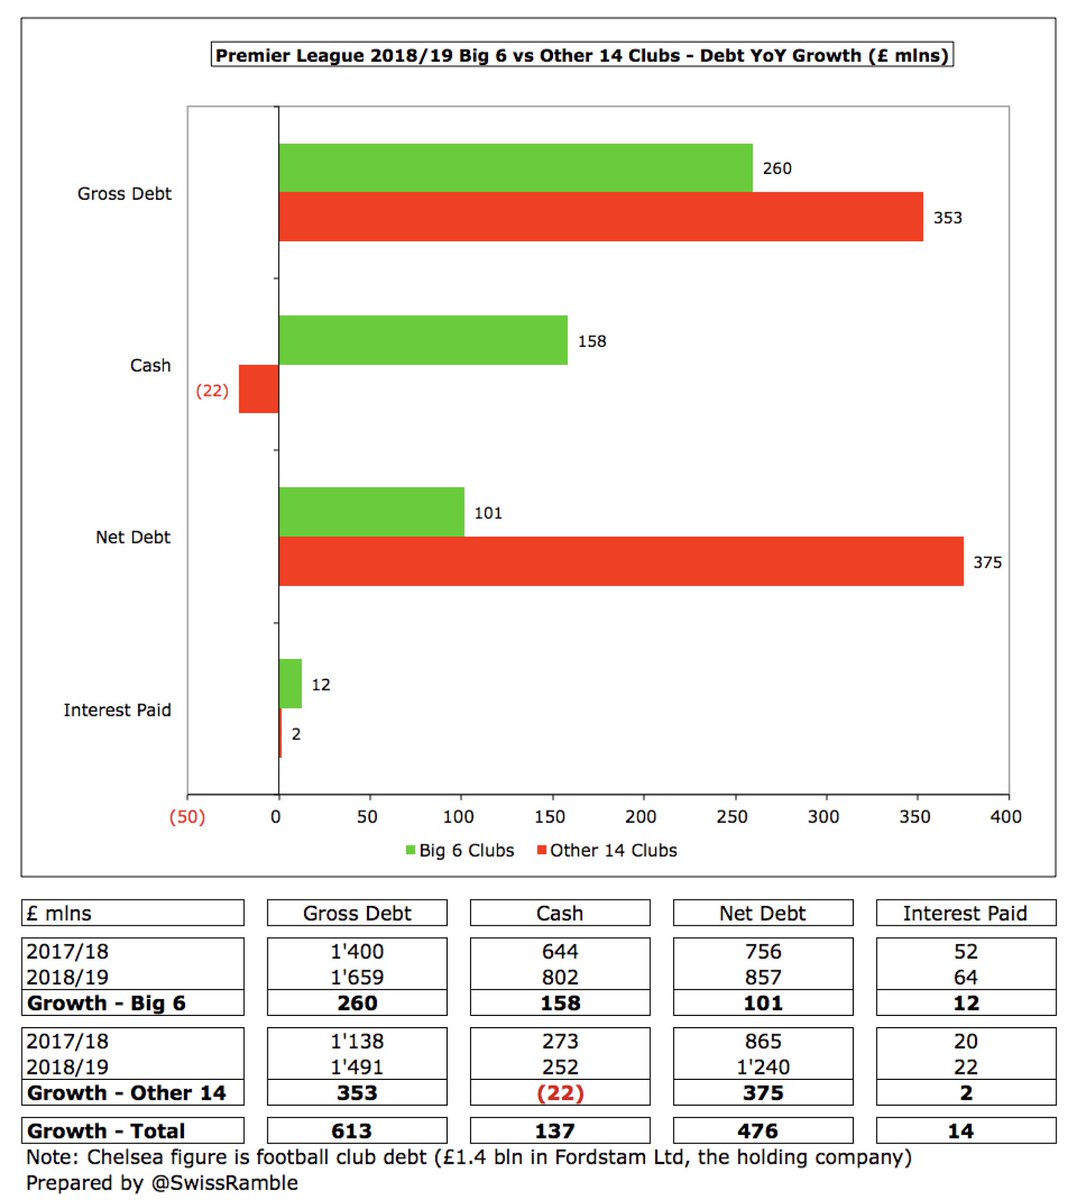
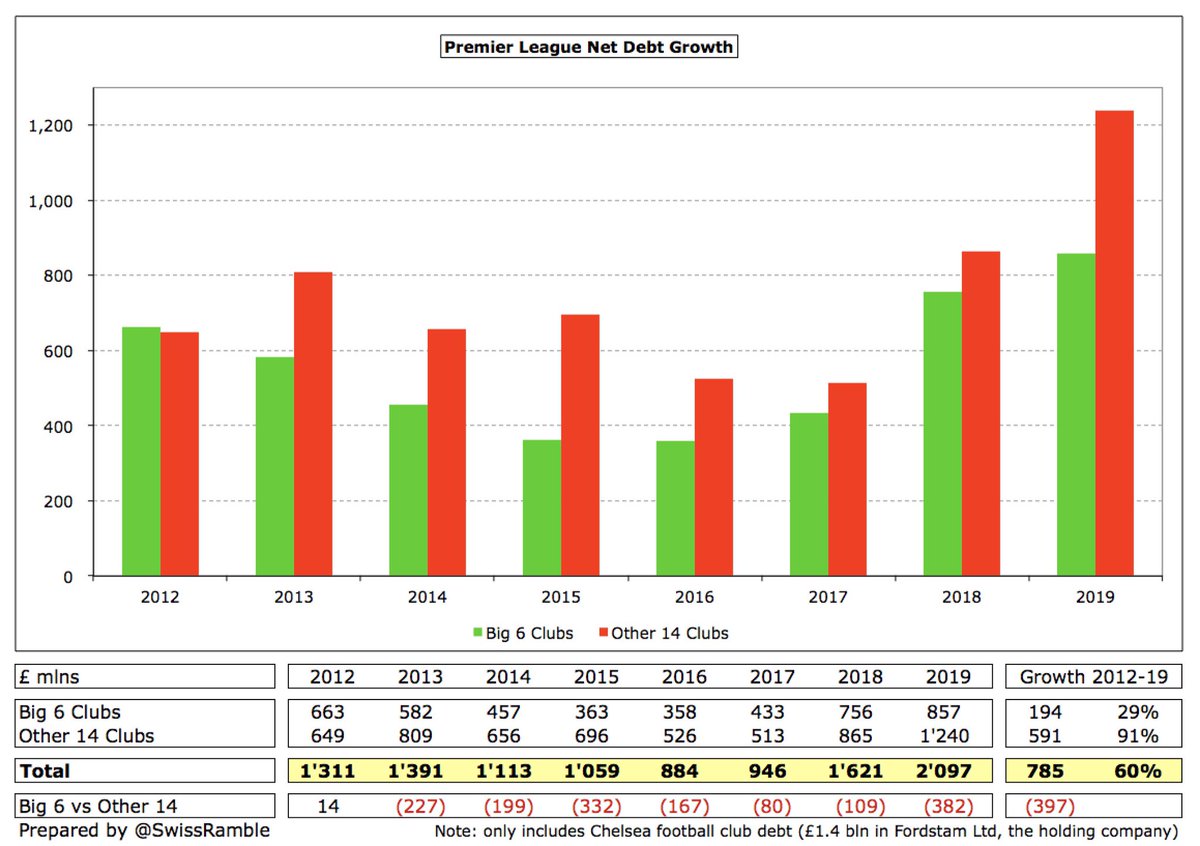
Big 6 £1.7 bln gross debt was £168m higher than Other 14 £1.5 bln, but £857m net debt was £382m lower than £1.2 bln, due to much more cash (£802m vs £252m). Big 6 and Other 14 gross debt both significantly up YoY (£260m vs £353m), though net debt increase much smaller at Big 6.
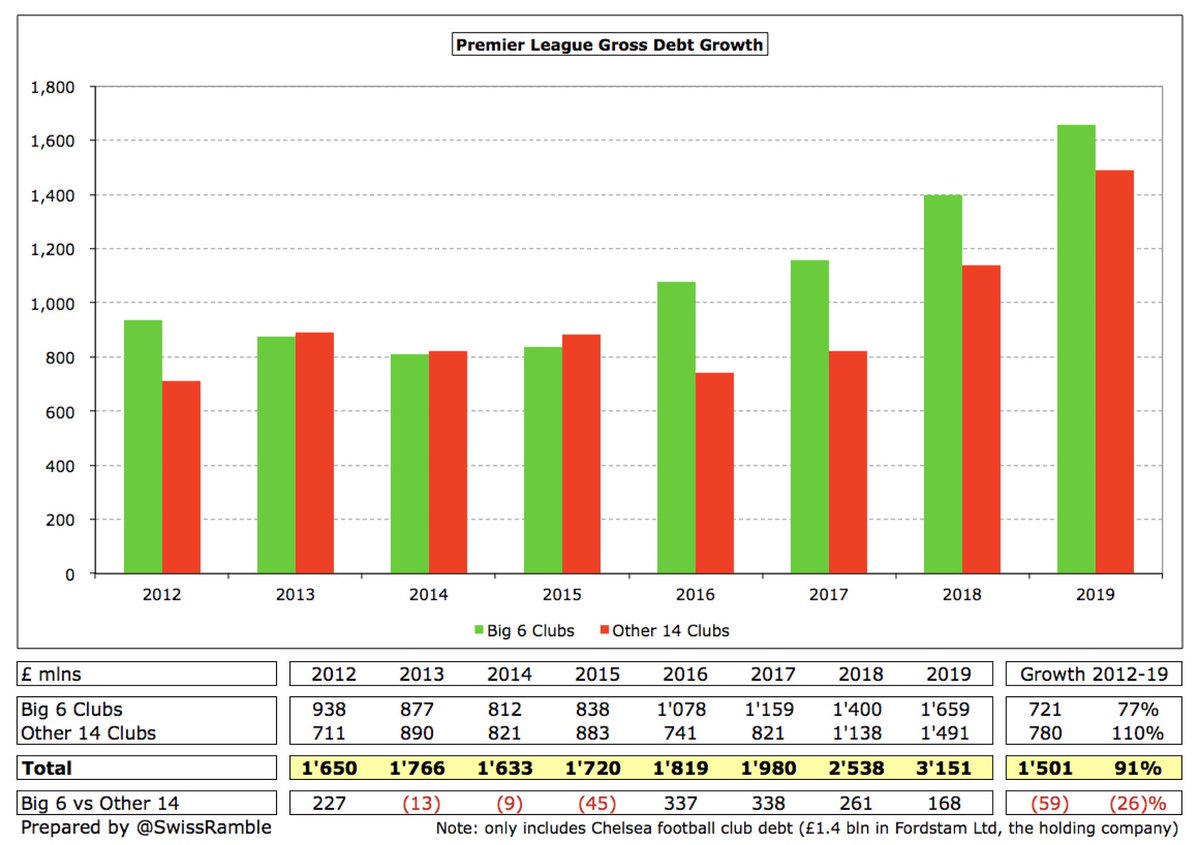
Although Big 6 gross debt is still more than Other 14, the gap has decreased by around £200m in last two years from £338m in 2017 to £168m in 2019. Premier League debt has almost doubled since 2012, but Other 14 up 110% compared to Big 6 77%.
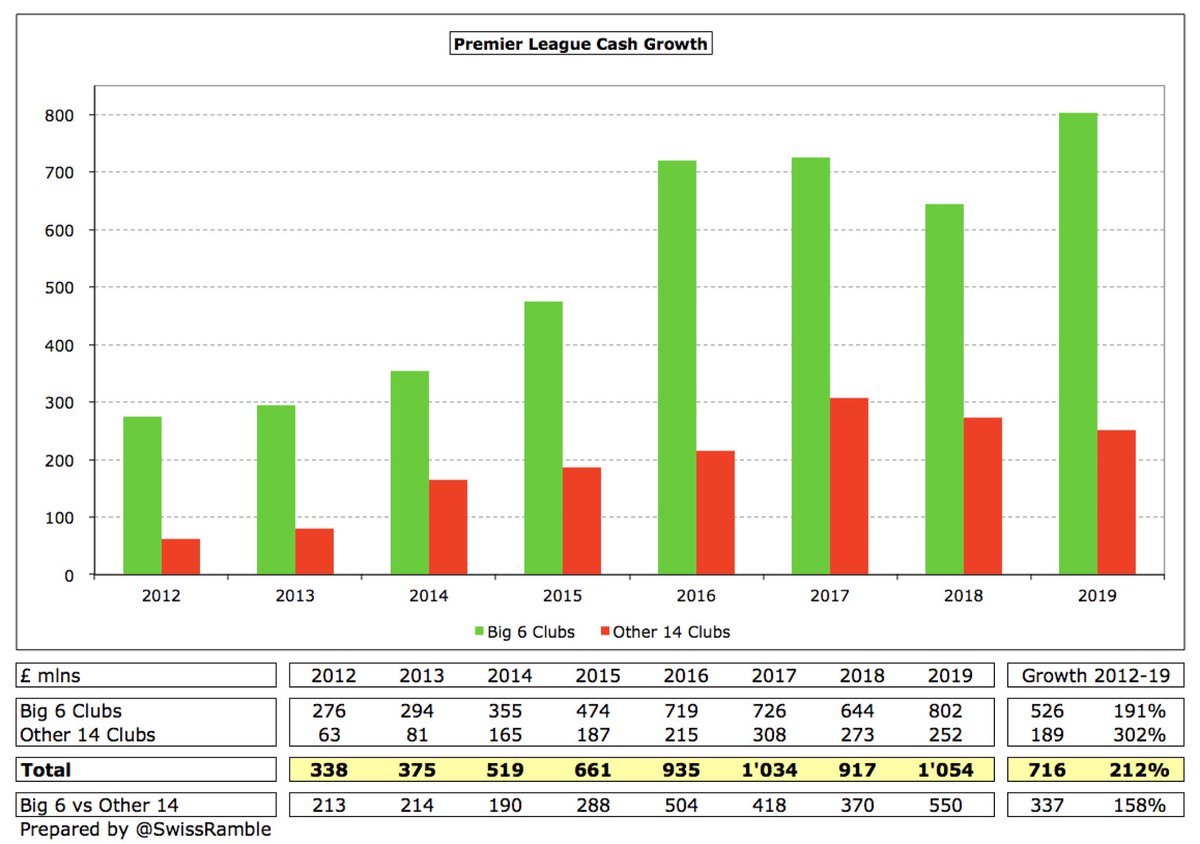
Premier League clubs had £1.1 bln cash in 2019, but almost all of this was held by Big 6 £802m, compared to £252m for Other 14. Big 6 cash balance was their highest ever, having risen by £526m from £276m in 2012, but Other 14 has now fallen two years in a row.
Other 14 net debt has almost doubled from £649m in 2012 to £1.2 bln in 2019, while Big 6 has only grown 29% in the same period from £663m to £857m. As a result, Other 14 net debt is now around £400m more than Big 6, while it was more or less the same in 2012.
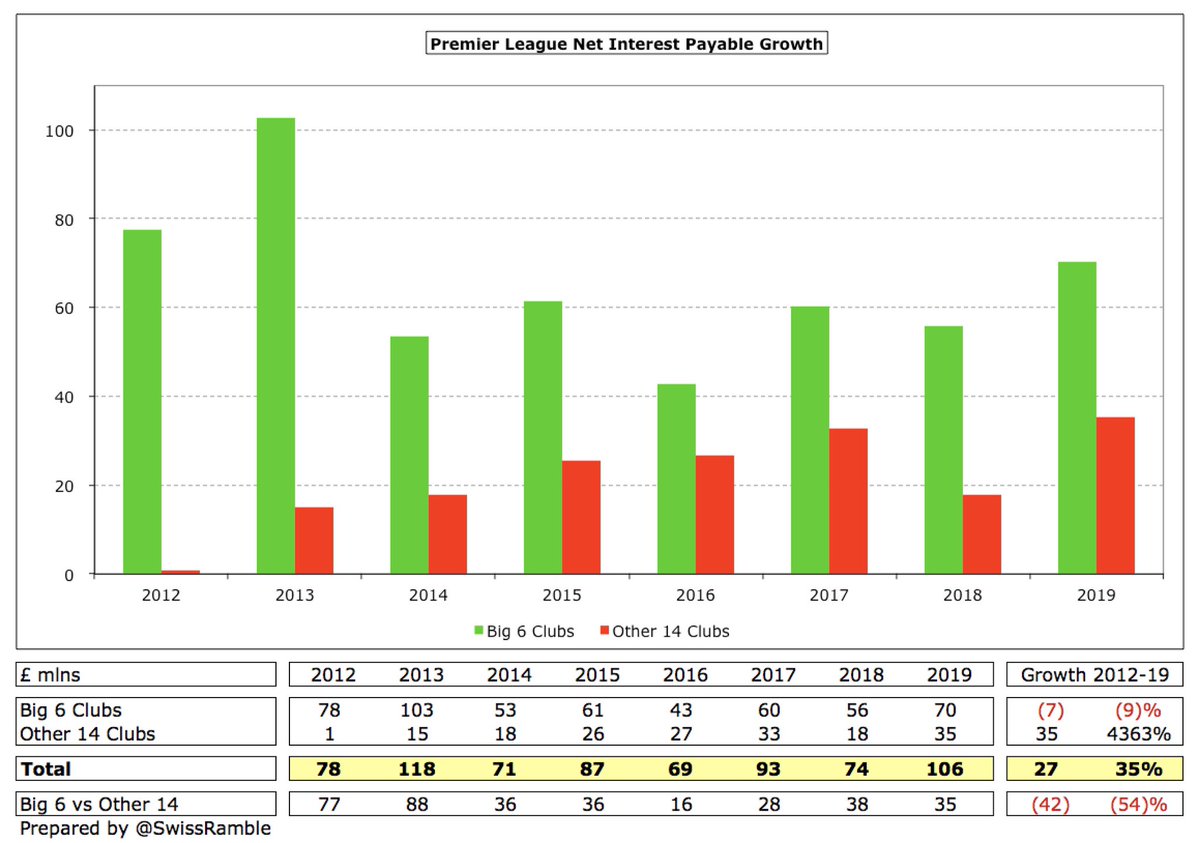
Big 6 clubs had twice as much net interest payable as Other 14 in 2019 (£70m vs £35m), mainly due to #THFC, #MUFC and #AFC, but this has actually fallen since 2012, while Other 14 has significantly risen in this period (partly due to #AVFC £20m write-off in 2012).
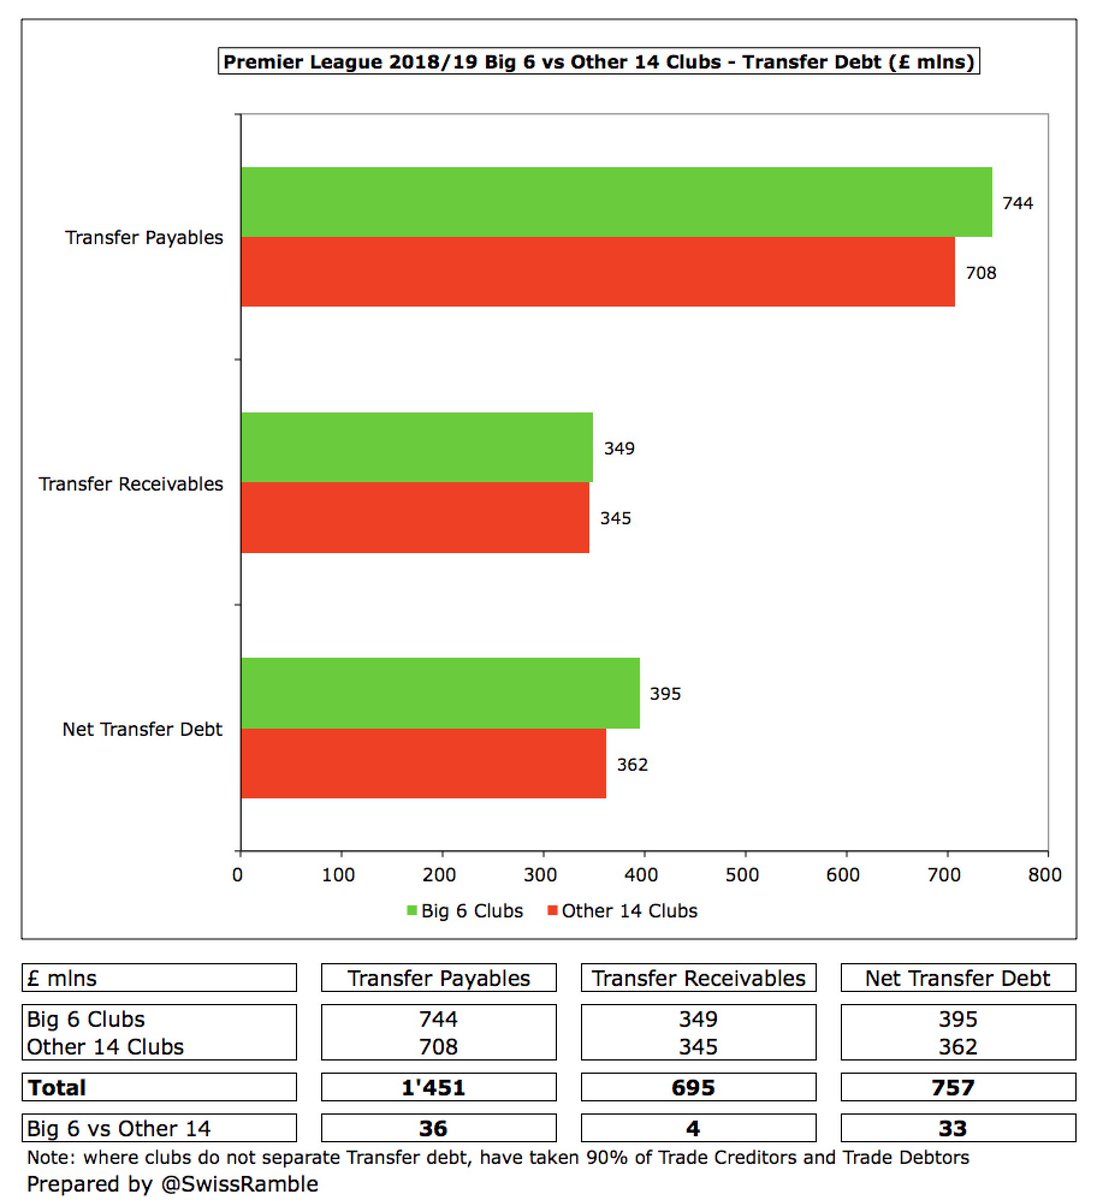
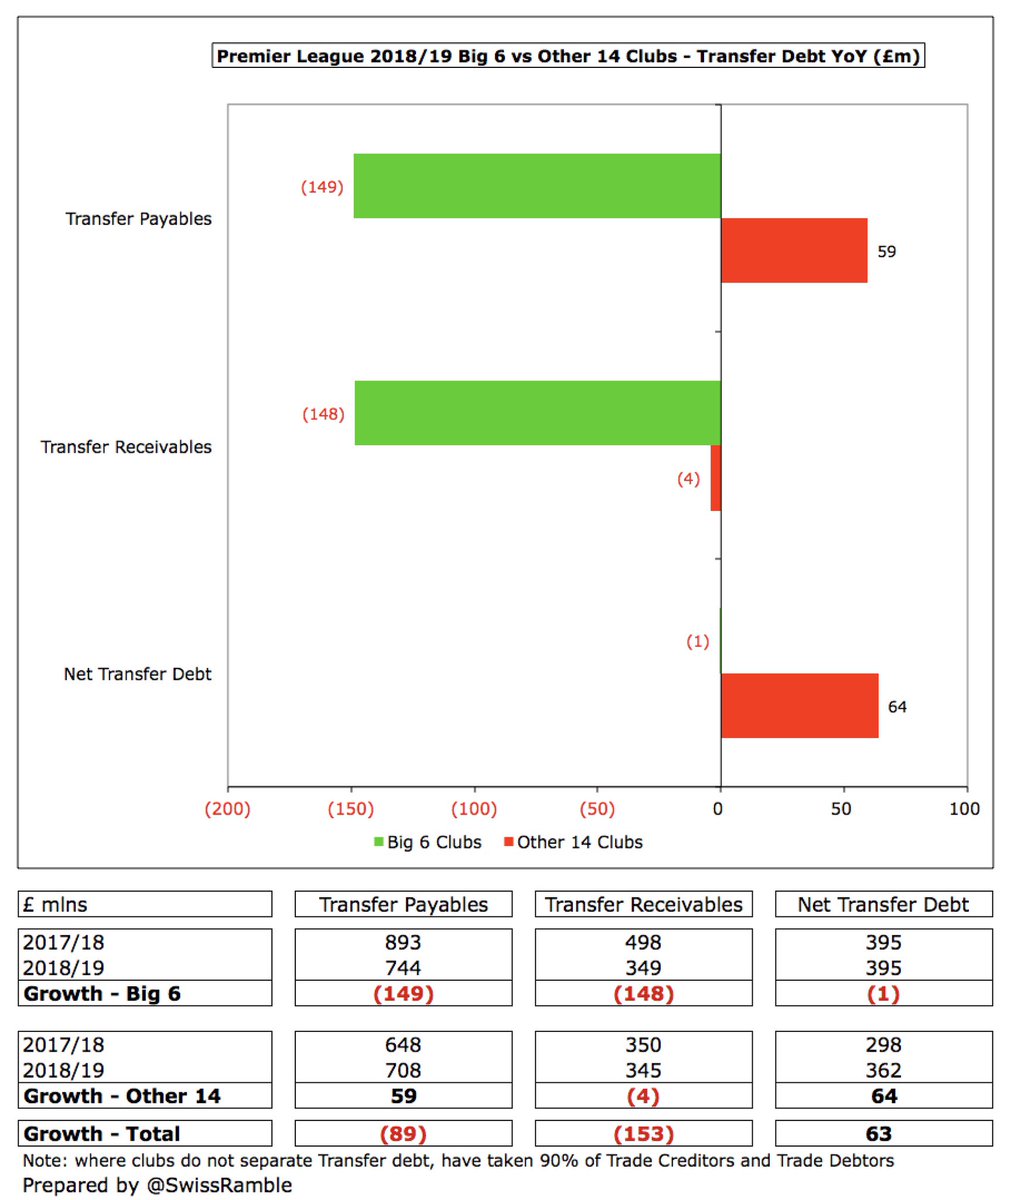
Transfer debt is remarkably similar between Big 6 and Other 14 in 2019 (payables £744m vs £708m, receivables £349m vs £345m, net £395m vs £362m). Big 6 net debt unchanged YoY, though £149m reduction in payables offset by lower receivables, while Other 14 up £64m.
As might be expected, the Big 6 Premier League clubs have more revenue and expenditure than Other 14 clubs, leading to better profitability. Revenue and wages growth year-on-year was also higher at the Big 6. Worryingly, debt growth, including transfers, is higher at Other 14.

 Read on Twitter