US Covid-19 deaths are falling while new confirmed cases have increased in recent days. The question regarding this is:
a) Is the virus mutating to be less deadly?
b) Treatment better?
c) Other changes?
a) Is the virus mutating to be less deadly?
b) Treatment better?
c) Other changes?
Let& #39;s talk about c, which some people say, well the declining of deaths despite rather sticky confirmed cases is due to "hiding of deaths."
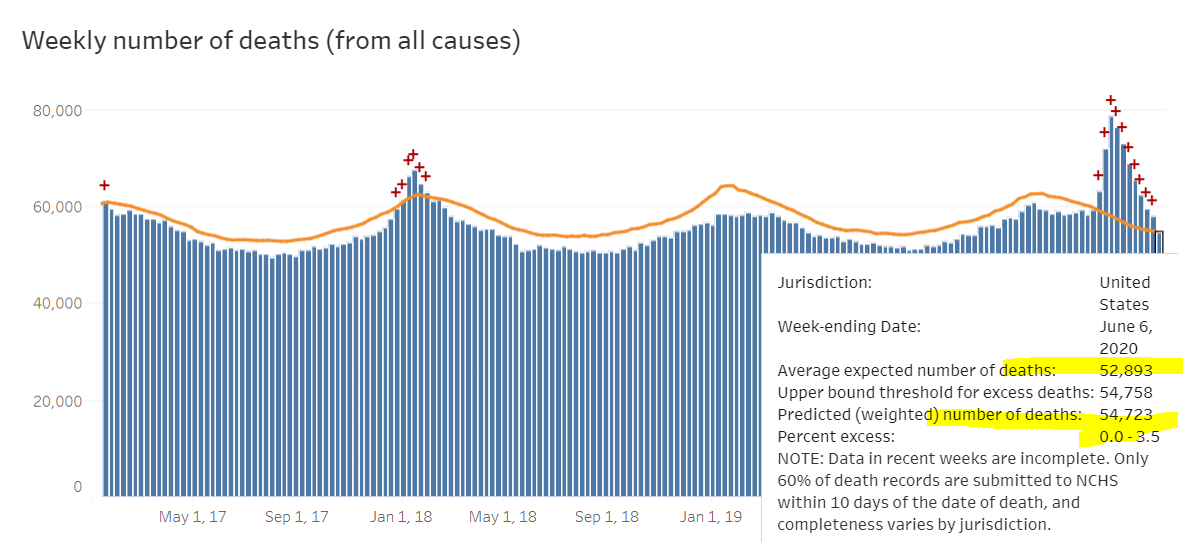
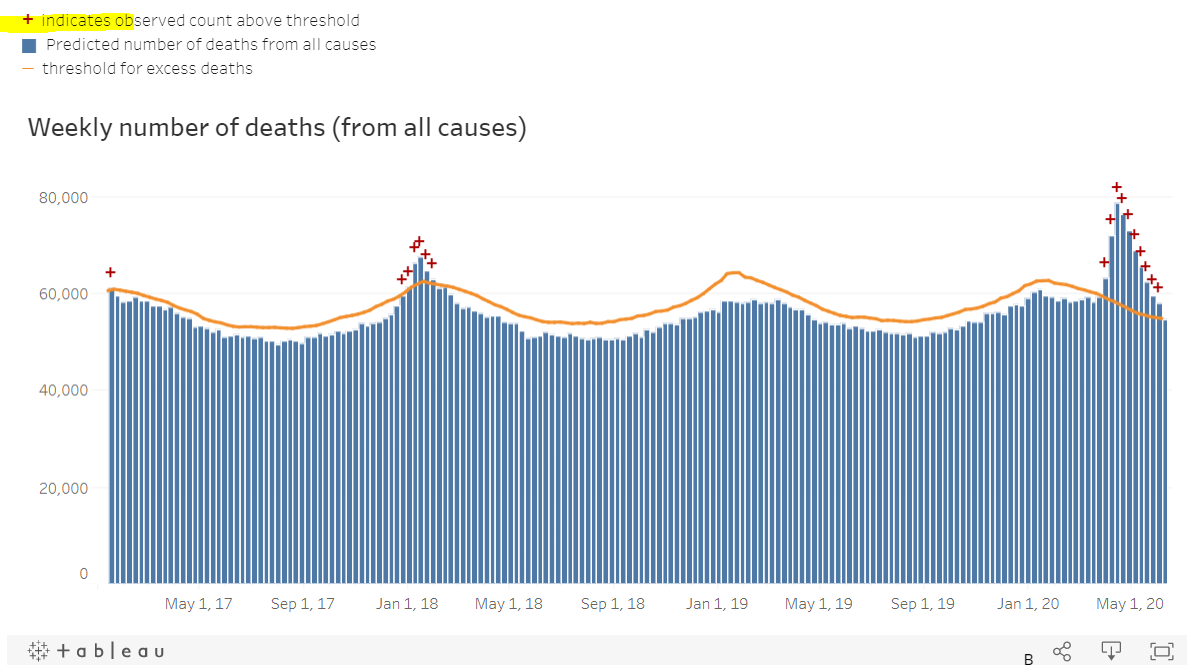
The CDC has excess deaths (deaths above the # expected of a period) & it was rather high in April & May but is now ZERO for W1 of June
The CDC has excess deaths (deaths above the # expected of a period) & it was rather high in April & May but is now ZERO for W1 of June
In the week of June, the number of excess deaths was zero to minus (see website to read about how it is calculated). Every year, you have excess deaths around winter depending on flu season & this yr excess deaths were high but has declined to ZERO by June
https://www.cdc.gov/nchs/nvss/vsrr/covid19/excess_deaths.htm">https://www.cdc.gov/nchs/nvss...
https://www.cdc.gov/nchs/nvss/vsrr/covid19/excess_deaths.htm">https://www.cdc.gov/nchs/nvss...
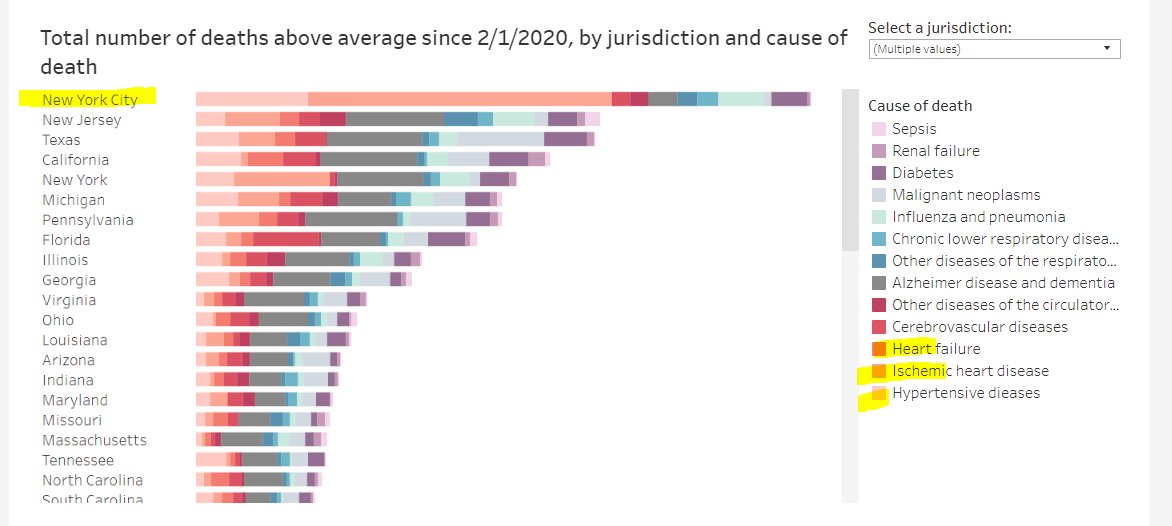
This is the distribution of excess deaths per state. Look at New York City, New Jersey & they also show New York w/o New York City & New York City excess deaths are super high!!!  https://abs.twimg.com/emoji/v2/... draggable="false" alt="⏫" title="Nach oben zeigendes doppeltes Dreieck" aria-label="Emoji: Nach oben zeigendes doppeltes Dreieck">
 https://abs.twimg.com/emoji/v2/... draggable="false" alt="⏫" title="Nach oben zeigendes doppeltes Dreieck" aria-label="Emoji: Nach oben zeigendes doppeltes Dreieck">
 https://abs.twimg.com/emoji/v2/... draggable="false" alt="⏫" title="Nach oben zeigendes doppeltes Dreieck" aria-label="Emoji: Nach oben zeigendes doppeltes Dreieck">
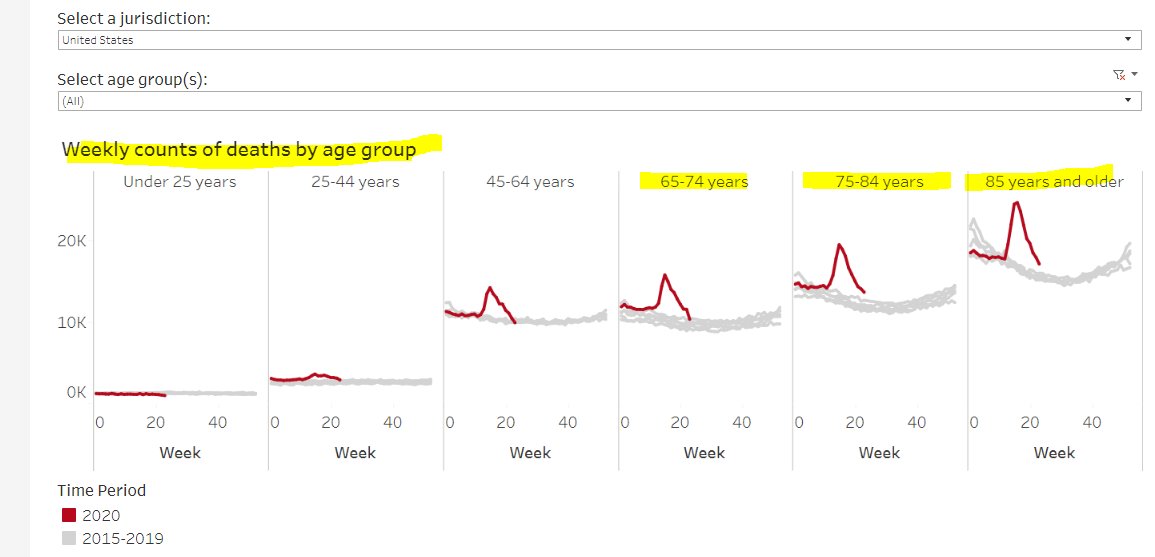
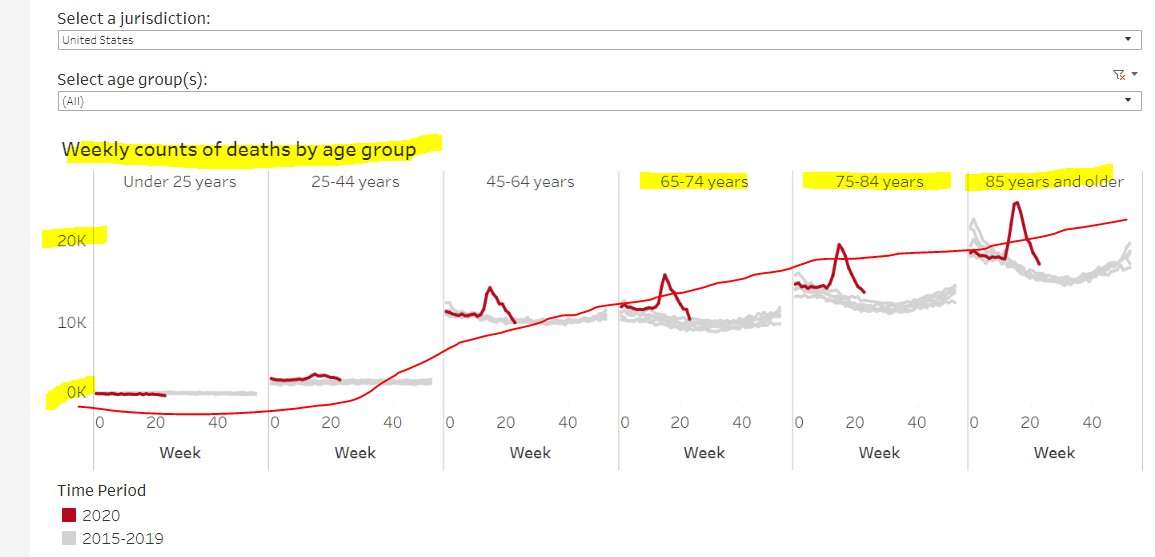
Excess deaths by age group:
Very very high for >85
Very high for 75 to 84
High for 65-74
Very low for 24-44
and almost none-existent for <25
Very very high for >85
Very high for 75 to 84
High for 65-74
Very low for 24-44
and almost none-existent for <25
If excess deaths for week ending 6 June 2020 was close to zero or negative then that means older people must be more careful.
So if new confirmed cases are mostly young people, then fatality would be rather low b/c the excess deaths for below 44 low.
So if new confirmed cases are mostly young people, then fatality would be rather low b/c the excess deaths for below 44 low.
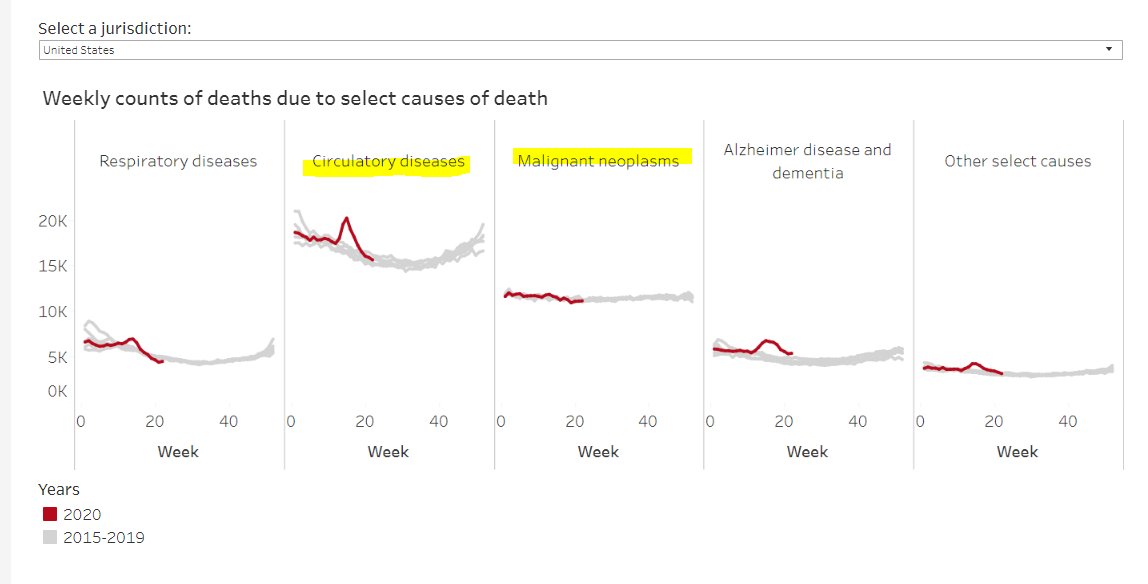
And Americans are still dying more of circulatory diseases than any other one so please take care of your respiratory system!!! Cancer still a 2nd leading cause of death!
Deaths in America by the numbers:
Alzheimer & dementia highest
Hypertensive diseases #1 (although as a group circulatory is #1)
Diabetes a huge problem.
Alzheimer & dementia highest
Hypertensive diseases #1 (although as a group circulatory is #1)
Diabetes a huge problem.
Total number of deaths above average since 2/1/2020 by city & state & New York City stands out by having so many deaths of circulatory diseases.
What happened in NYC???
What happened in NYC???
Good morning!!! Today, we will discuss many comments that this gap between confirmed/deaths is just because of lagged.
Here is the latest data of daily change of confirmed & deaths:
Here is the latest data of daily change of confirmed & deaths:
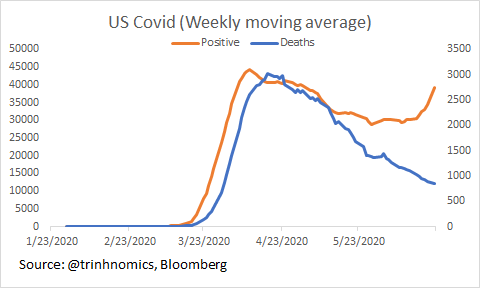
So when you see a data that is very messy like because Bloomberg adds up Saturday + Sunday to report for Monday then we get the spike & so we call this seasonality & it& #39;s rather noisy.
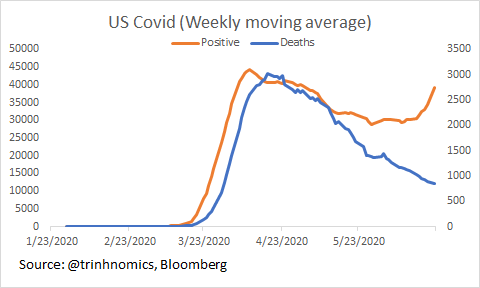
Let& #39;s fix it by smoothing it & I take a weekly moving average. Can see here the trends better
Let& #39;s fix it by smoothing it & I take a weekly moving average. Can see here the trends better
So already in this chart that you see a lag between confirmed & deaths (obviously) but less of that trend later on as the orange line continued to stay elevated but the blue line falls.
The question is whether the recent spike will push the blue upward!
The question is whether the recent spike will push the blue upward!
Here I fix the lag issue by lagging confirmed (so the number of confirmed previous week = the number of deaths this week). And you can see that instead of deaths lagging confirmed we are now seeing concurrent.
What do u do see? Gap of positive & deaths!
So not a lagging issue!
What do u do see? Gap of positive & deaths!
So not a lagging issue!
As in, we can discuss variables that cause a decline of deaths relative to positive cases but we can rule out lagging is the issue as I lagged the positive by one week & the gap persists. I can do it for 2 weeks if u like but it will not change the results).
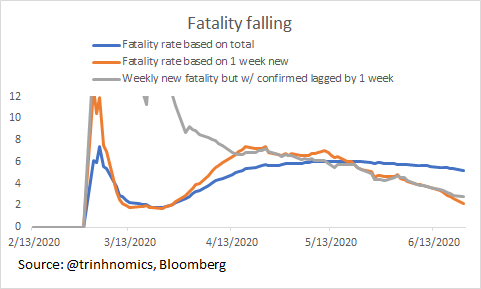
Fatality is falling.
Fatality is falling.
So let& #39;s look at fatality rate (deaths/confirmed) & I did it 3 ways to satisfy the "lagging" people:
* Cumulative deaths/total confirmed (Blue line)
* New weekly deaths/confirmed (Orange line)
*New week deaths/confirmed from 1 week ago (Grey)
All showing fatality falling https://abs.twimg.com/emoji/v2/... draggable="false" alt="👇🏻" title="Rückhand Zeigefinger nach unten (heller Hautton)" aria-label="Emoji: Rückhand Zeigefinger nach unten (heller Hautton)">
 https://abs.twimg.com/emoji/v2/... draggable="false" alt="👇🏻" title="Rückhand Zeigefinger nach unten (heller Hautton)" aria-label="Emoji: Rückhand Zeigefinger nach unten (heller Hautton)">
 https://abs.twimg.com/emoji/v2/... draggable="false" alt="👇🏻" title="Rückhand Zeigefinger nach unten (heller Hautton)" aria-label="Emoji: Rückhand Zeigefinger nach unten (heller Hautton)">
* Cumulative deaths/total confirmed (Blue line)
* New weekly deaths/confirmed (Orange line)
*New week deaths/confirmed from 1 week ago (Grey)
All showing fatality falling
The latest fatality ratios are:
*Cumulative = 5.2%
* New weekly = 2.2%
* New weekly deaths but confirmed from 1 week ago = 2.8%
This virus fatality rate differs depending on age, healthy, how early the treatment etc.
Whatever the case, absolute & relative new deaths falling https://abs.twimg.com/emoji/v2/... draggable="false" alt="👇🏻" title="Rückhand Zeigefinger nach unten (heller Hautton)" aria-label="Emoji: Rückhand Zeigefinger nach unten (heller Hautton)">.
*Cumulative = 5.2%
* New weekly = 2.2%
* New weekly deaths but confirmed from 1 week ago = 2.8%
This virus fatality rate differs depending on age, healthy, how early the treatment etc.
Whatever the case, absolute & relative new deaths falling

 Read on Twitter
 https://abs.twimg.com/emoji/v2/... draggable="false" alt="⏫" title="Nach oben zeigendes doppeltes Dreieck" aria-label="Emoji: Nach oben zeigendes doppeltes Dreieck">https://abs.twimg.com/emoji/v2/... draggable="false" alt="⏫" title="Nach oben zeigendes doppeltes Dreieck" aria-label="Emoji: Nach oben zeigendes doppeltes Dreieck">" title="This is the distribution of excess deaths per state. Look at New York City, New Jersey & they also show New York w/o New York City & New York City excess deaths are super high!!! https://abs.twimg.com/emoji/v2/... draggable="false" alt="⏫" title="Nach oben zeigendes doppeltes Dreieck" aria-label="Emoji: Nach oben zeigendes doppeltes Dreieck">https://abs.twimg.com/emoji/v2/... draggable="false" alt="⏫" title="Nach oben zeigendes doppeltes Dreieck" aria-label="Emoji: Nach oben zeigendes doppeltes Dreieck">https://abs.twimg.com/emoji/v2/... draggable="false" alt="⏫" title="Nach oben zeigendes doppeltes Dreieck" aria-label="Emoji: Nach oben zeigendes doppeltes Dreieck">" class="img-responsive" style="max-width:100%;"/>




 https://abs.twimg.com/emoji/v2/... draggable="false" alt="👇🏻" title="Rückhand Zeigefinger nach unten (heller Hautton)" aria-label="Emoji: Rückhand Zeigefinger nach unten (heller Hautton)">https://abs.twimg.com/emoji/v2/... draggable="false" alt="👇🏻" title="Rückhand Zeigefinger nach unten (heller Hautton)" aria-label="Emoji: Rückhand Zeigefinger nach unten (heller Hautton)">" title="So let& #39;s look at fatality rate (deaths/confirmed) & I did it 3 ways to satisfy the "lagging" people:* Cumulative deaths/total confirmed (Blue line)* New weekly deaths/confirmed (Orange line)*New week deaths/confirmed from 1 week ago (Grey)All showing fatality falling https://abs.twimg.com/emoji/v2/... draggable="false" alt="👇🏻" title="Rückhand Zeigefinger nach unten (heller Hautton)" aria-label="Emoji: Rückhand Zeigefinger nach unten (heller Hautton)">https://abs.twimg.com/emoji/v2/... draggable="false" alt="👇🏻" title="Rückhand Zeigefinger nach unten (heller Hautton)" aria-label="Emoji: Rückhand Zeigefinger nach unten (heller Hautton)">https://abs.twimg.com/emoji/v2/... draggable="false" alt="👇🏻" title="Rückhand Zeigefinger nach unten (heller Hautton)" aria-label="Emoji: Rückhand Zeigefinger nach unten (heller Hautton)">" class="img-responsive" style="max-width:100%;"/>
 ." title="The latest fatality ratios are:*Cumulative = 5.2%* New weekly = 2.2%* New weekly deaths but confirmed from 1 week ago = 2.8%This virus fatality rate differs depending on age, healthy, how early the treatment etc. Whatever the case, absolute & relative new deaths fallinghttps://abs.twimg.com/emoji/v2/... draggable="false" alt="👇🏻" title="Rückhand Zeigefinger nach unten (heller Hautton)" aria-label="Emoji: Rückhand Zeigefinger nach unten (heller Hautton)">." class="img-responsive" style="max-width:100%;"/>


