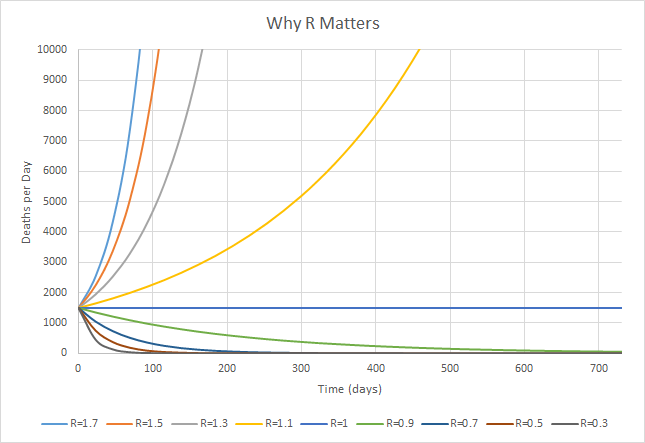
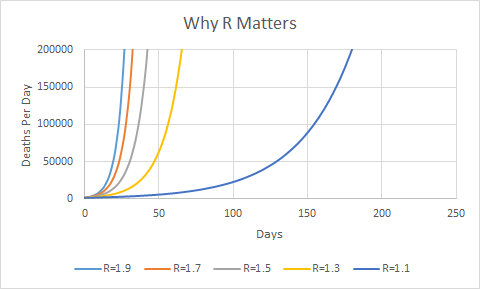
Because some people still don& #39;t get it. Why R matters. Projecting deaths from outset of lockdown (now we know that to have been around 1500 deaths per day) with varying R values.
If you project the death rate we had at peak growth rather than what I& #39;ve projected (based on just shy of three weeks after lockdown when social distancing advice started to kick in) it instead looks like this.
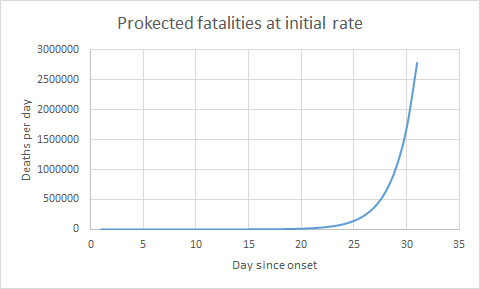
Brass tacks - until the 10th of April we were seeing an average daily rise in fatalities of times 1.64. That looked like this:
...want to see what that looks like? If the disease is killing 1 in 100 people who catch it, at that rate of increase we would have run out of people who could catch it, in the UK, at 36 days - over 600k fatalities at that point.
So - you all get it now, right?

 Read on Twitter


