Latest @ICNARC report on intensive care admissions and outcomes was released last night.
Report includes 9,949 patients, with outcomes for 9,217 of them.
Most of the breakdowns of admissions and outcomes are stable at this stage, so this week I want to focus on ethnicity. /1 https://twitter.com/icnarc/status/1274086308680433666">https://twitter.com/icnarc/st...
Report includes 9,949 patients, with outcomes for 9,217 of them.
Most of the breakdowns of admissions and outcomes are stable at this stage, so this week I want to focus on ethnicity. /1 https://twitter.com/icnarc/status/1274086308680433666">https://twitter.com/icnarc/st...
COVID-19 is hitting some groups harder than others. It is shining a light on existing inequalities in life and health outcomes and, in some instances, worsening inequality.
We had great existing UK data on health inequality by socioeconomic group, but much less on ethnicity. /2
We had great existing UK data on health inequality by socioeconomic group, but much less on ethnicity. /2
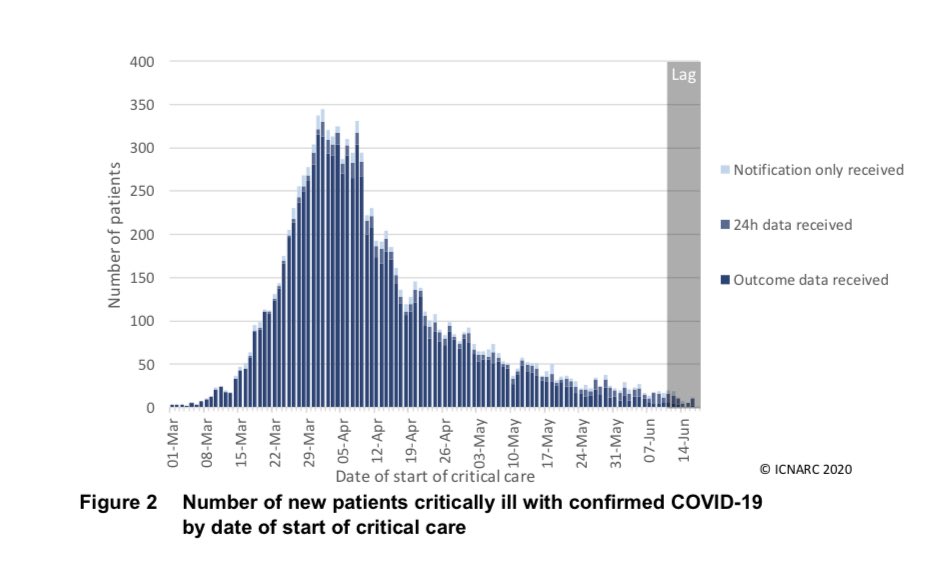
Daily admissions are low but there are 172 new patients included this week. That’s a small INCREASE on the 154 that @NicolaMedical noted last week. Hopefully just a blip but we’ll be watching closely next week  https://abs.twimg.com/emoji/v2/... draggable="false" alt="👀" title="Augen" aria-label="Emoji: Augen"> /3
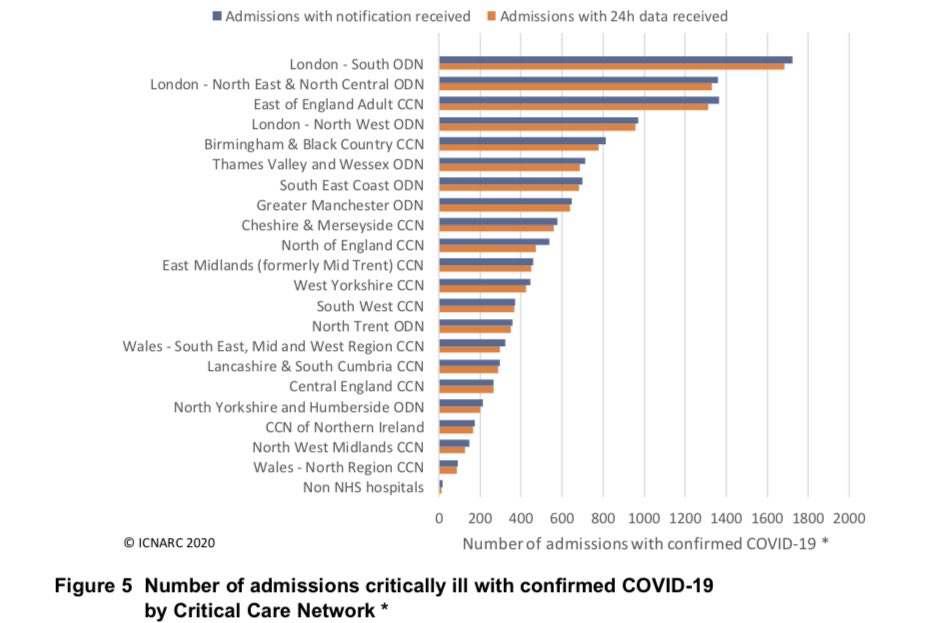
Location distribution largely unchanged. London makes up three of the top four networks with most COVID-19 admissions. /4
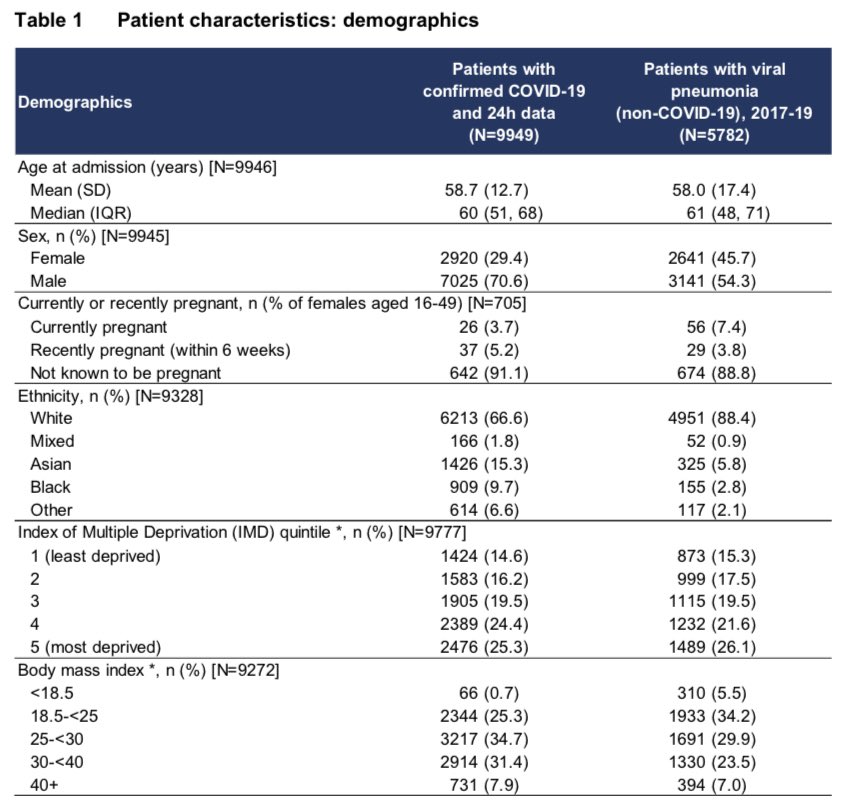
Table 1 shows demographic characteristics, compared to pneumonia caused by other viruses.
A few year’s worth of admissions in just 3 months!
Groups at higher risk of needing ICU care include:
- males
- non-whites
- more deprived groups (poorest 40%)
- overweight/obese. /5
A few year’s worth of admissions in just 3 months!
Groups at higher risk of needing ICU care include:
- males
- non-whites
- more deprived groups (poorest 40%)
- overweight/obese. /5
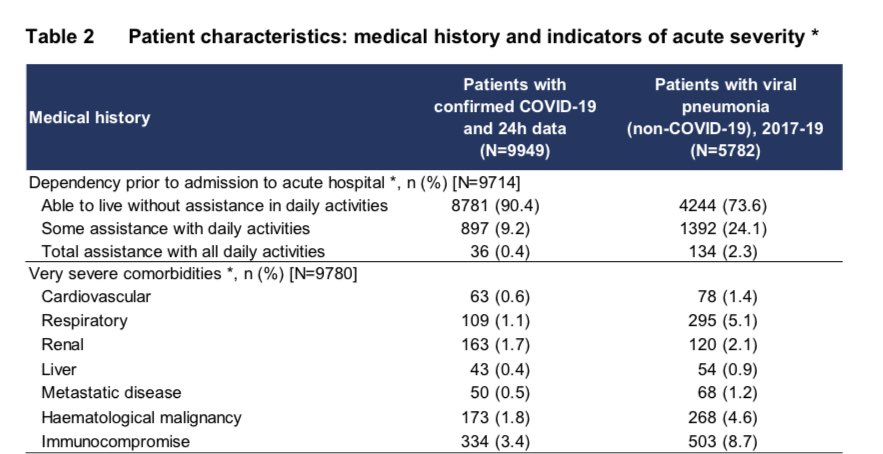
Table 2 shows medical history. Compared to viral pneumonia patients, ICU admissions for COVID-19 are three times LESS likely to need assistance with daily living (90% don’t) or have very severe comorbidities (10% do).
It is not just people “at death’s door” falling victim. /6
It is not just people “at death’s door” falling victim. /6
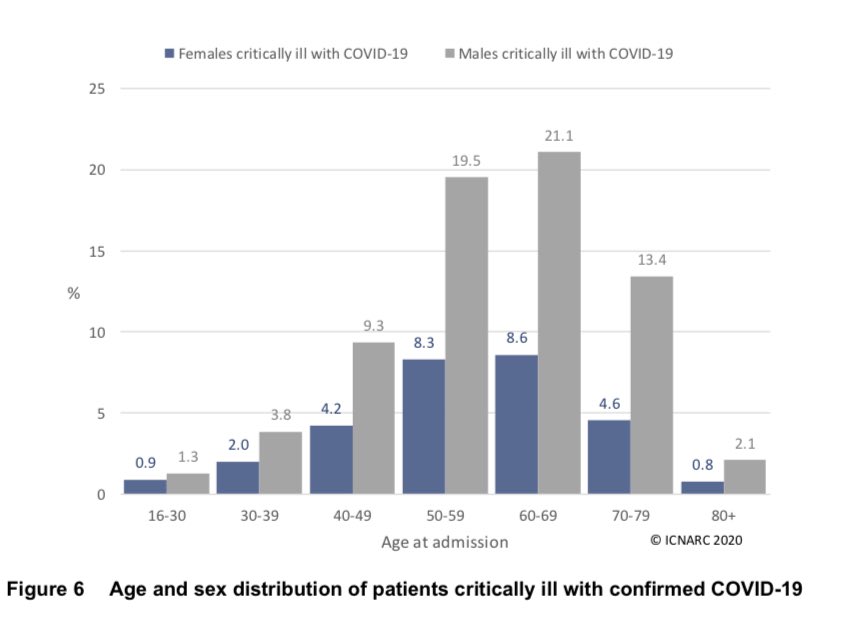
The age and sex distribution remains striking. Two thirds of the ICU patients are men aged 40-80. Men are more at risk than women in every age group. /7
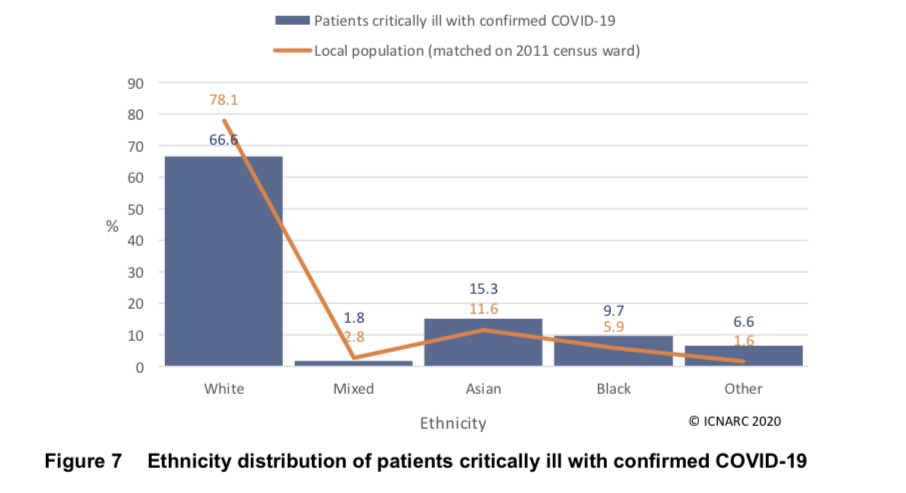
It remains clear that Asians, black and other ethnicities are over-represented.
Compared to white ethnicity, ICU admission is
- 50% more likely for Asians
- 90% more likely for black ethnicity
- over four times as likely for other ethnicity. /8
Compared to white ethnicity, ICU admission is
- 50% more likely for Asians
- 90% more likely for black ethnicity
- over four times as likely for other ethnicity. /8
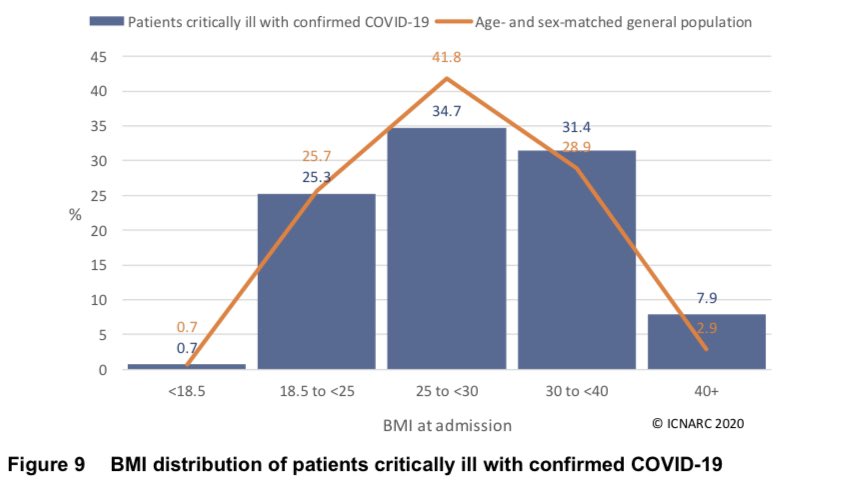
BMI picture is little changed. ICU admissions are about what we’d expect for healthy weight or under. There are fewer ICU admissions than expected for the ‘overweight but not obese’ group and more for obese, especially very obese. /9
Let’s look closer at ethnic differences in admissions.
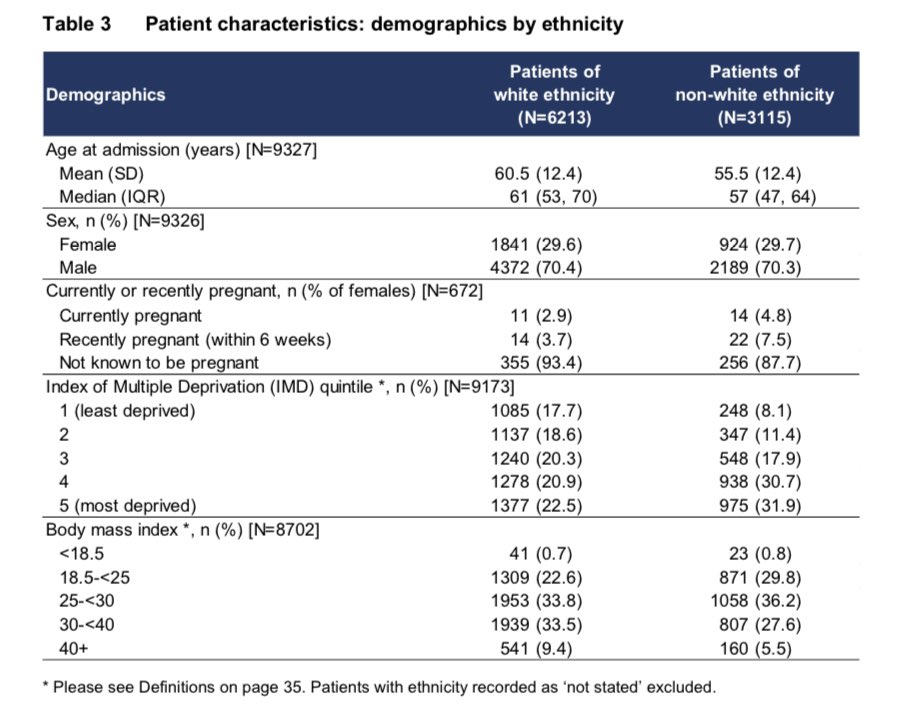
Non-white ICU patients are:
- significantly younger; 5 years on average!
- 44% more likely to belong to the two most deprived socioeconomic groups.
- more likely to be a healthy weight; much less likely to be obese. /10
Non-white ICU patients are:
- significantly younger; 5 years on average!
- 44% more likely to belong to the two most deprived socioeconomic groups.
- more likely to be a healthy weight; much less likely to be obese. /10
Looking at the medical indicators, non-white patients are;
- less likely to need assistance with daily living
- less likely to have severe comorbidities
- needing quicker admission to ICU
- much more likely to need mechanical ventilation within the first 24 hours. /11
- less likely to need assistance with daily living
- less likely to have severe comorbidities
- needing quicker admission to ICU
- much more likely to need mechanical ventilation within the first 24 hours. /11
Some worrying indicators when considered together. On paper the non-white patients look like they should have better prospects. They are younger, less-obese and with fewer health conditions. They are however more likely to be deprived. Are they seeking medical help later? /12
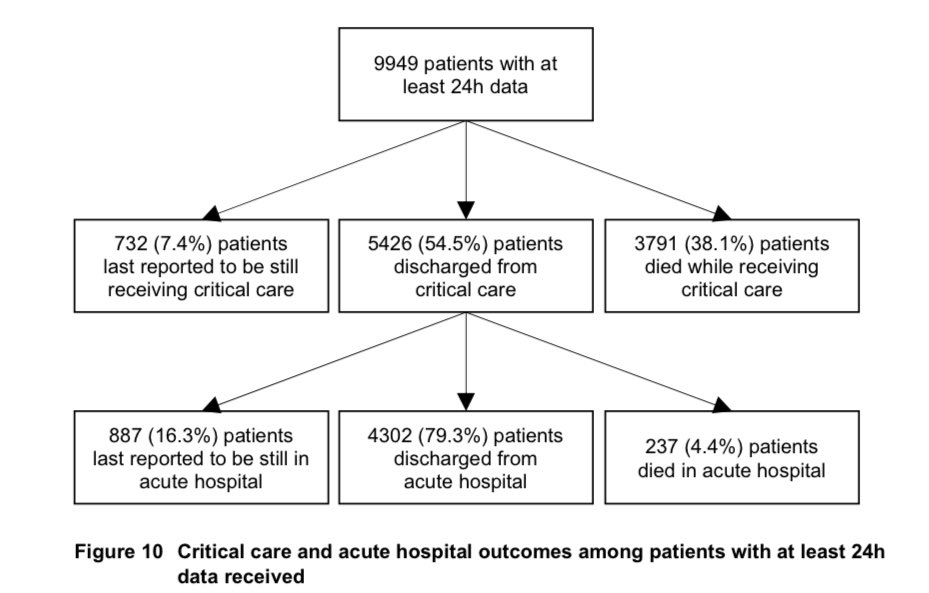
We’re getting more information on outcomes as the weeks go by. This helpful chart gives us more data on the patients discharged from ICU. Of admissions to date:
- 43% discharged from hospital
- 40% died (in ICU or hospital)
- 7% still in ICU
- 9% elsewhere in hospital. /13
- 43% discharged from hospital
- 40% died (in ICU or hospital)
- 7% still in ICU
- 9% elsewhere in hospital. /13
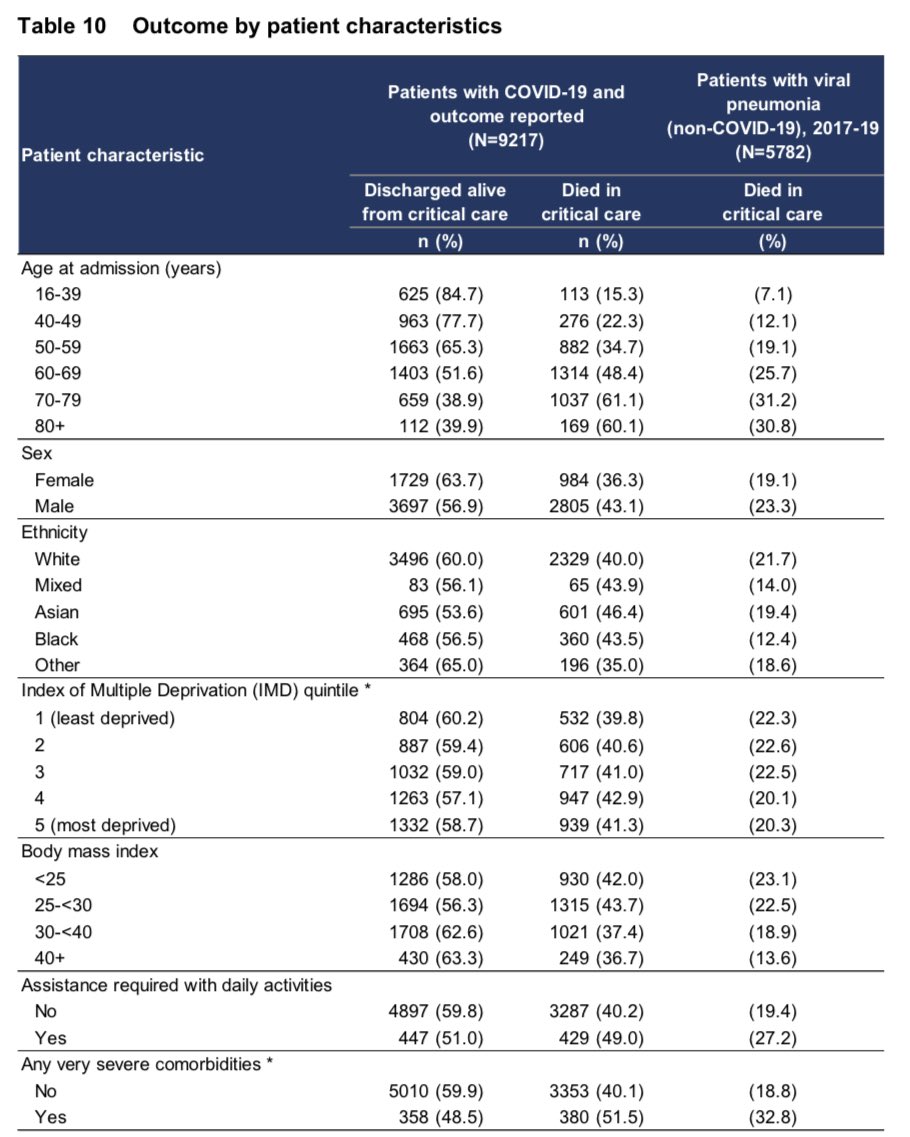
Table 10 shows gives a good summary of outcomes data by individual variables. Survival is worse for:
- older patients
- males
- Asian, black and mixed ethnicity
- more deprived groups
- those who are NOT obese
- people with comorbidities. /14
- older patients
- males
- Asian, black and mixed ethnicity
- more deprived groups
- those who are NOT obese
- people with comorbidities. /14
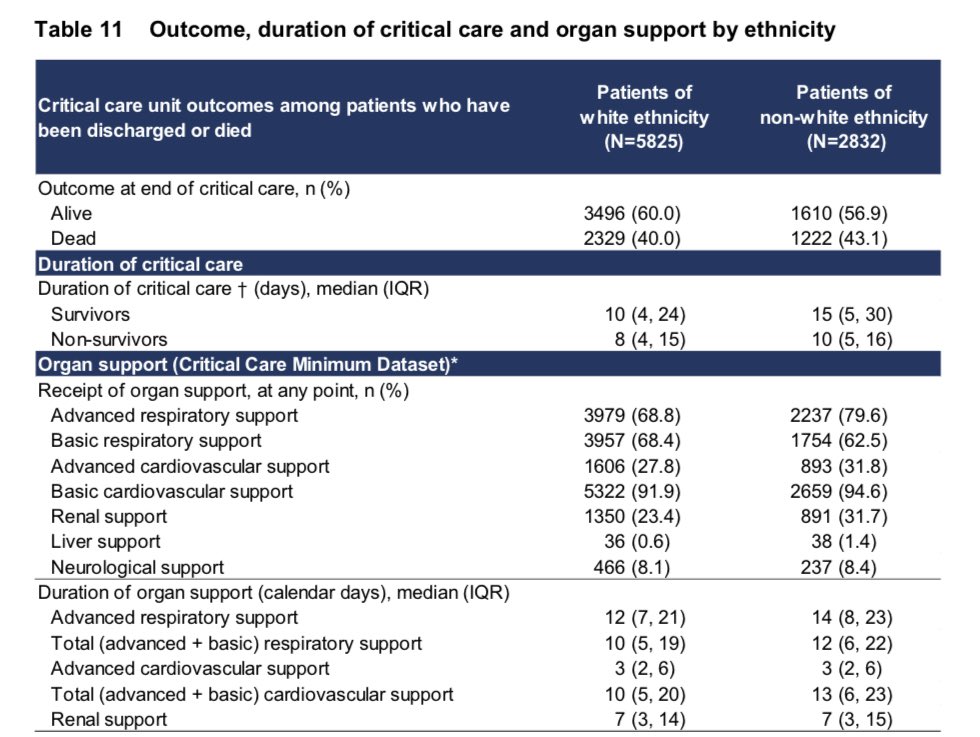
Looking closer at outcomes by ethnicity we see that non-whites need significantly longer in ICU on average, an extra 5 days for the survivors. They are much more likely to need renal (kidney) support. Ultimately, they are about 8% more likely to die. /15
A reminder that, as noted above https://abs.twimg.com/emoji/v2/... draggable="false" alt="👆" title="Rückhand Zeigefinger nach oben" aria-label="Emoji: Rückhand Zeigefinger nach oben">, this is a non-white population who are younger, less-obese and with fewer health conditions. Even so they need longer in ICU, more organ support and are less likely to survive. /16
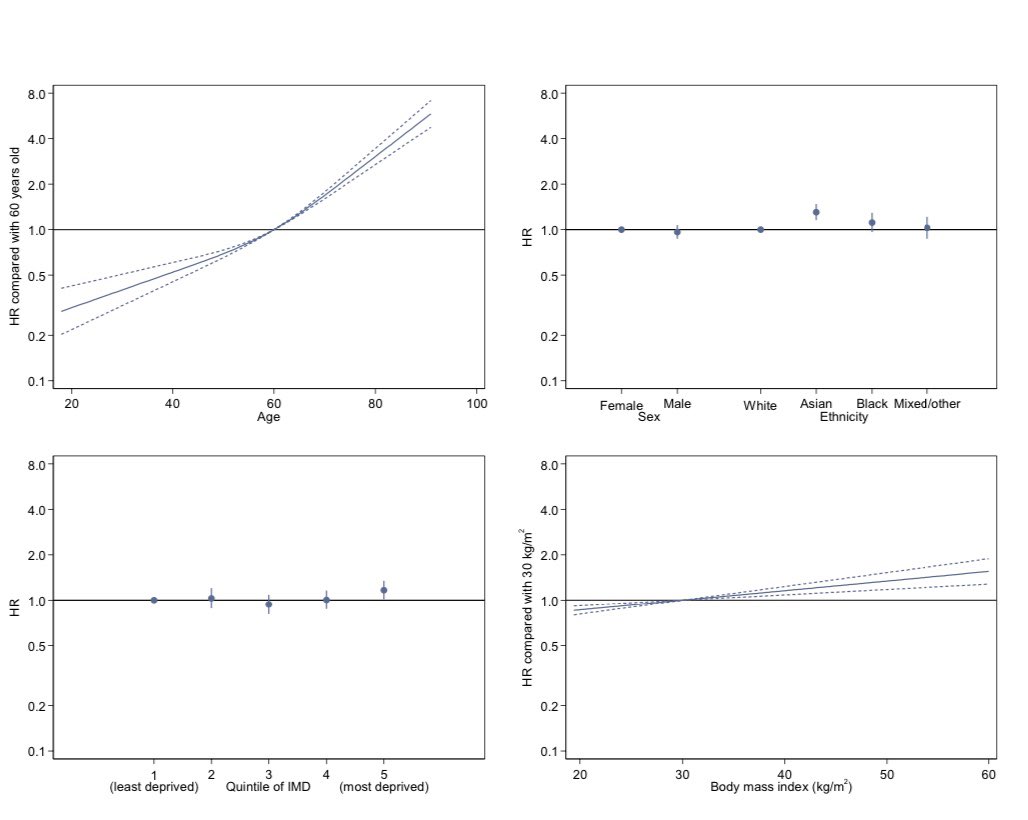
The multivariate analysis in Fig 18 onwards allows us to see how characteristics combine to give the overall risk of dying in ICU.
In each chart comparison is to a reference group where risk is 1.0 by definition.
So a patient aged 40 is half as likely to die as one aged 60. /17
In each chart comparison is to a reference group where risk is 1.0 by definition.
So a patient aged 40 is half as likely to die as one aged 60. /17
Age is by far the strongest predictor of survival!
Once we control for other characteristics, the survival difference between the sexes goes away.
Only the most deprived 20% have statistically significant extra risk after we control for other characteristics. /18
Once we control for other characteristics, the survival difference between the sexes goes away.
Only the most deprived 20% have statistically significant extra risk after we control for other characteristics. /18
Looking at individual ethnicities we can see that:
- mixed/other ethnicities have similar survival to whites
- once we control for other characteristics, worse survival for black ethnicity is no longer statistically significant
- Asians have significantly poorer survival. /19
- mixed/other ethnicities have similar survival to whites
- once we control for other characteristics, worse survival for black ethnicity is no longer statistically significant
- Asians have significantly poorer survival. /19
So what appears to be the characteristic that explains ethnic differences in survival? It is surely poverty.
Asians and Blacks are 75% more likely to belong to the most deprived 10% overall, and over twice as likely to be most income-deprived. /20 https://www.ethnicity-facts-figures.service.gov.uk/uk-population-by-ethnicity/demographics/people-living-in-deprived-neighbourhoods/latest">https://www.ethnicity-facts-figures.service.gov.uk/uk-popula...
Asians and Blacks are 75% more likely to belong to the most deprived 10% overall, and over twice as likely to be most income-deprived. /20 https://www.ethnicity-facts-figures.service.gov.uk/uk-population-by-ethnicity/demographics/people-living-in-deprived-neighbourhoods/latest">https://www.ethnicity-facts-figures.service.gov.uk/uk-popula...
COVID-19 and #blacklivesmatter  https://abs.twimg.com/hashflags... draggable="false" alt=""> are throwing much needed light on the inequalities in society, here in the UK and elsewhere. History tells us the pandemics, like wars, have been catalysts for change. We need to #BuildBackBetter. /end

 Read on Twitter
 /3" title="Daily admissions are low but there are 172 new patients included this week. That’s a small INCREASE on the 154 that @NicolaMedical noted last week. Hopefully just a blip but we’ll be watching closely next week https://abs.twimg.com/emoji/v2/... draggable="false" alt="👀" title="Augen" aria-label="Emoji: Augen"> /3" class="img-responsive" style="max-width:100%;"/>
