Thread on new, preliminary paper on what is happening to distribution of income in UK through the coronavirus crisis. Brilliant work from my co-author @IvaTasseva using UKMOD @EUROMOD_ @CeMPAEssex @iseressex https://www.euromod.ac.uk/publications/did-uk-policy-response-covid-19-protect-household-incomes">https://www.euromod.ac.uk/publicati... (1/12)
We simulate household incomes in April 2020, accounting for the JRS, extra spending on UC and LHA, and detailed information from @usociety& #39;s Covid-19 data on how jobs and earnings have been affected across the distribution. (2/n)
The results depend heavily on various assumptions or data limitations. For example, we don& #39;t know which workers on JRS get top-ups over the 80% - we assumed none. We also ignored the SEISS (since noone had received it in April!) - we will update the analysis later. (3/n).
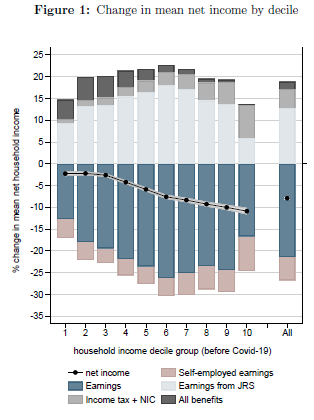
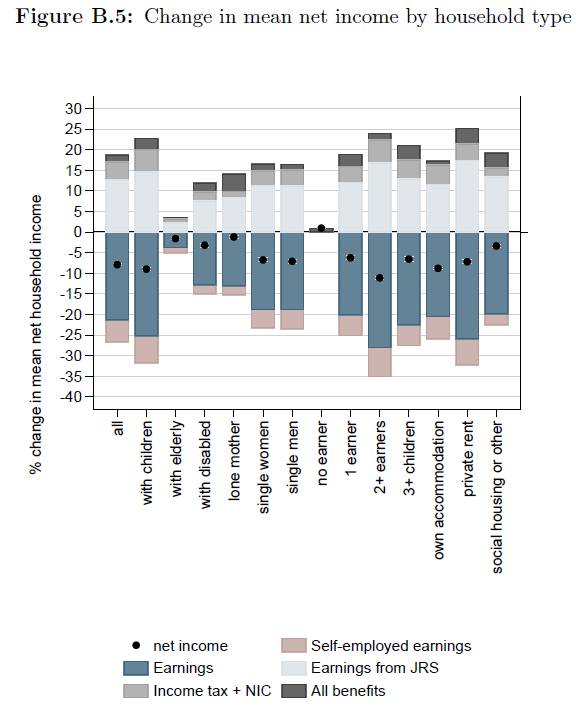
Our initial, provisional simulations are that net household incomes in April were 8% lower than they would have been, on average. As a % of income, the simulated income falls are greatest among those who would have been in the top income decile. (4/n)
This is across the entire income distribution. Remember that those over state pension age are hardly affected financially by the goings-on in the labour market, which is one reason why the impact on those previously on a low income is muted (5/n)
In April 2020, we simulate that (pre-tax) JRS payments made up 13% of (post-tax) household income, on average. As a contribution to household income, pre-tax JRS payments are most important in in the sixth decile (NB our detailed sums account for JRS being taxable) (6/n)
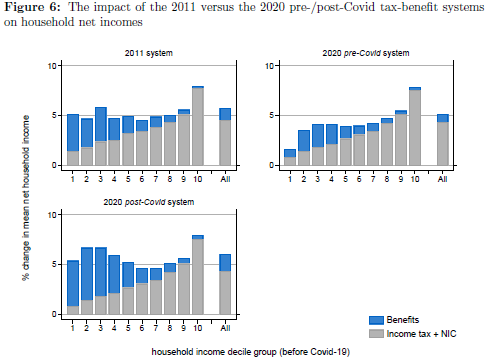
We also look at what austerity did to the ability of the tax-benefit system to protect people from unemployment. Were it not for the £8bn emergency spend on UC, WTC and LHA, the system in 2020 would have offered much less income replacement than that from 2011. (7/n)
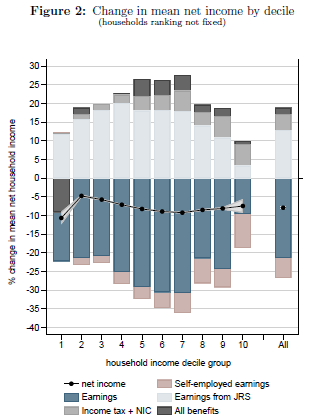
(Subtle point alert). The charts above showed income changes as a % of the income people would have had had there been no crisis. We can also compare our post-crisis simulated income distribution for April 2020 to what it would have been with no crisis. (8/n)
This shows big fall in incomes at the bottom - this is driven by increased number of people with no earned income, some of whom get no or very little income from benefits (non take-up, capital rules). (Remember no SEISS payments in April 2020, although we do simulate UC) (9/n)
So the hit to incomes is biggest as a % amongst those who would have had high incomes pre-crisis, but many people (are simulated to) fall a long way down the income distribution.
Unsurprisingly, rates of poverty (with a fixed line) are simulated to rise by 2.4 ppts. (10/n)
Unsurprisingly, rates of poverty (with a fixed line) are simulated to rise by 2.4 ppts. (10/n)
Although we have used some of the best data available on the nature of the labour market hit, and this should all be seen as provisional: in part, these exercises serve to show what we don& #39;t know. So v happy to hear questions, feedback or criticism (11/n)
And PS this is not a @resfoundation output - I have dual affiliation with Univ of Essex. @adamcorlett and others at RF will be building on this work in our July Living Standards Audit.
We used UKMOD, which is supported by @NuffieldFound.
https://www.iser.essex.ac.uk/research/projects/ukmod
(12/12)">https://www.iser.essex.ac.uk/research/...
We used UKMOD, which is supported by @NuffieldFound.
https://www.iser.essex.ac.uk/research/projects/ukmod
(12/12)">https://www.iser.essex.ac.uk/research/...
PS Different work by me found that 37% in the bottom 2 (pre-crisis) income quintiles reported income falls, as did 35% of adults in the top 2. But that ignored those over working-age, and didn& #39;t ask about the size. So not necessarily inconsistent. (13/12) https://www.resolutionfoundation.org/publications/return-to-spender/">https://www.resolutionfoundation.org/publicati...

 Read on Twitter


