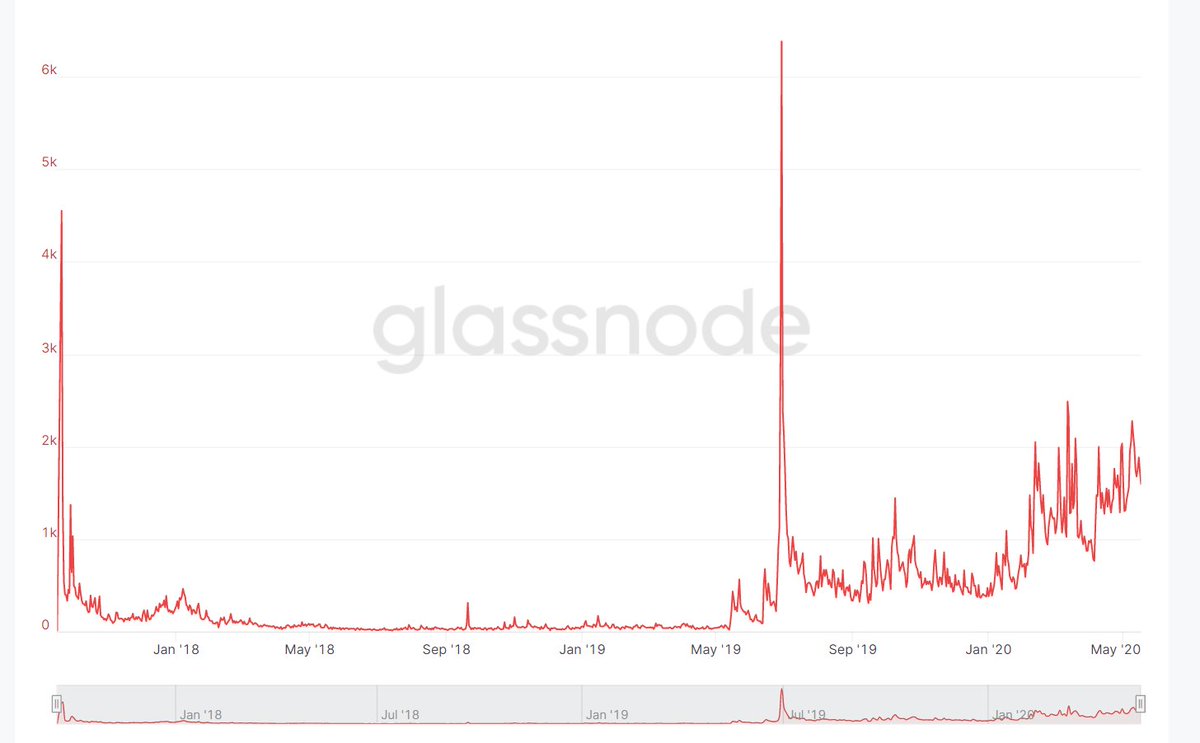
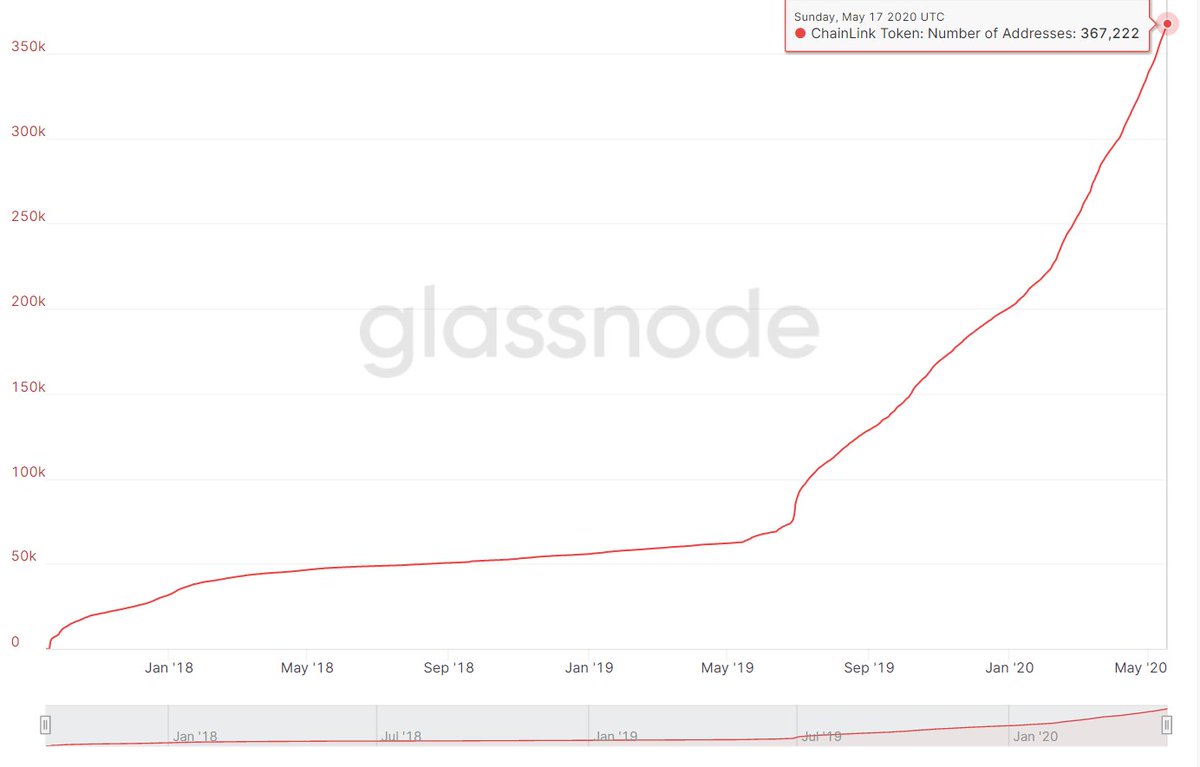
Number of non-zero $LINK addresses on the rise
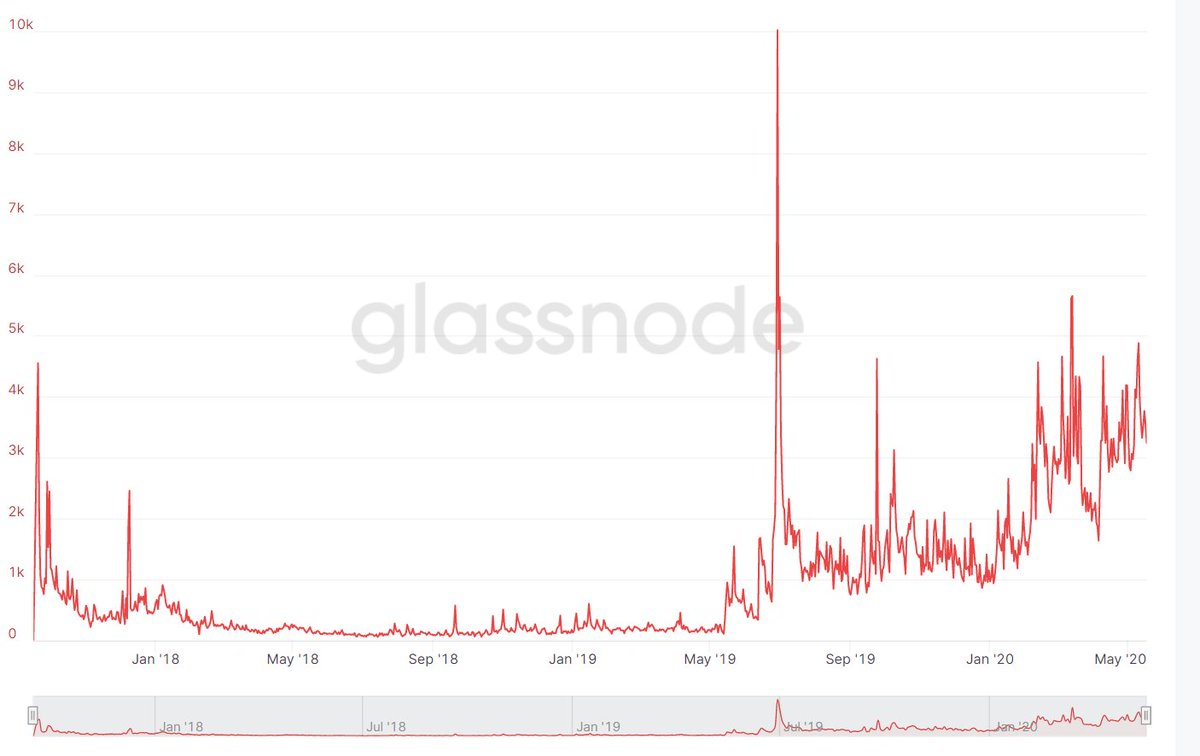
Number of NEW $LINK addresses on the increase
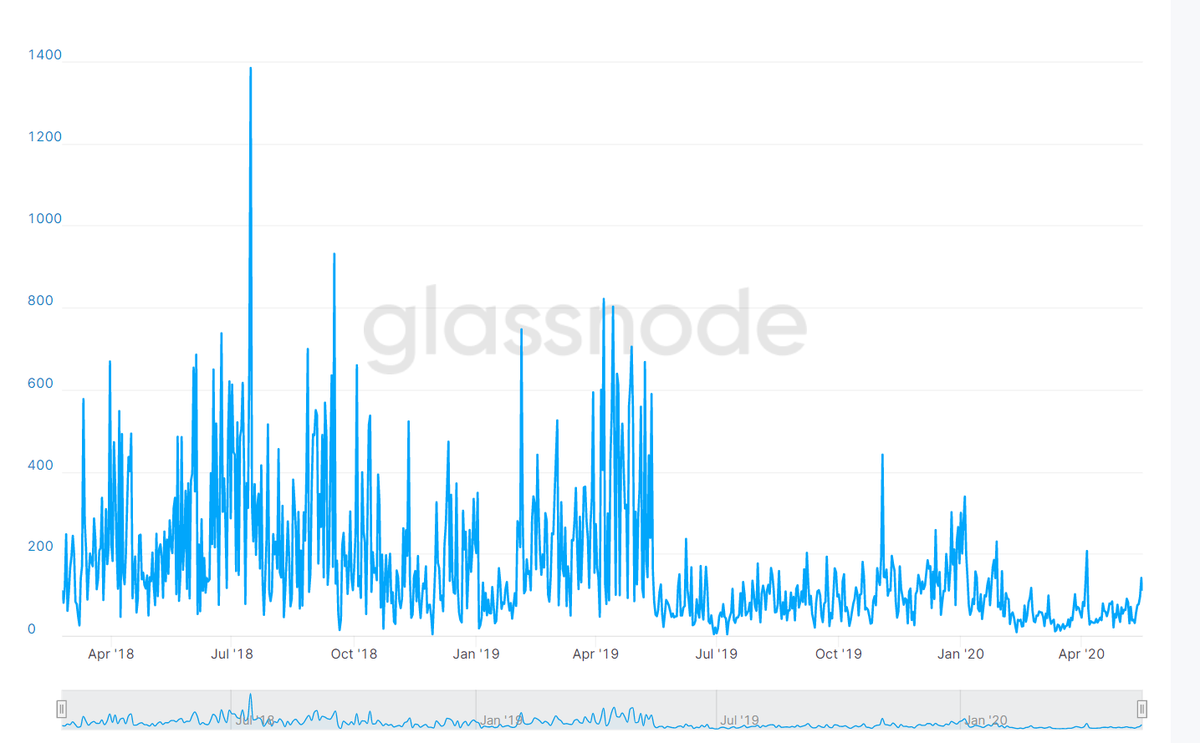
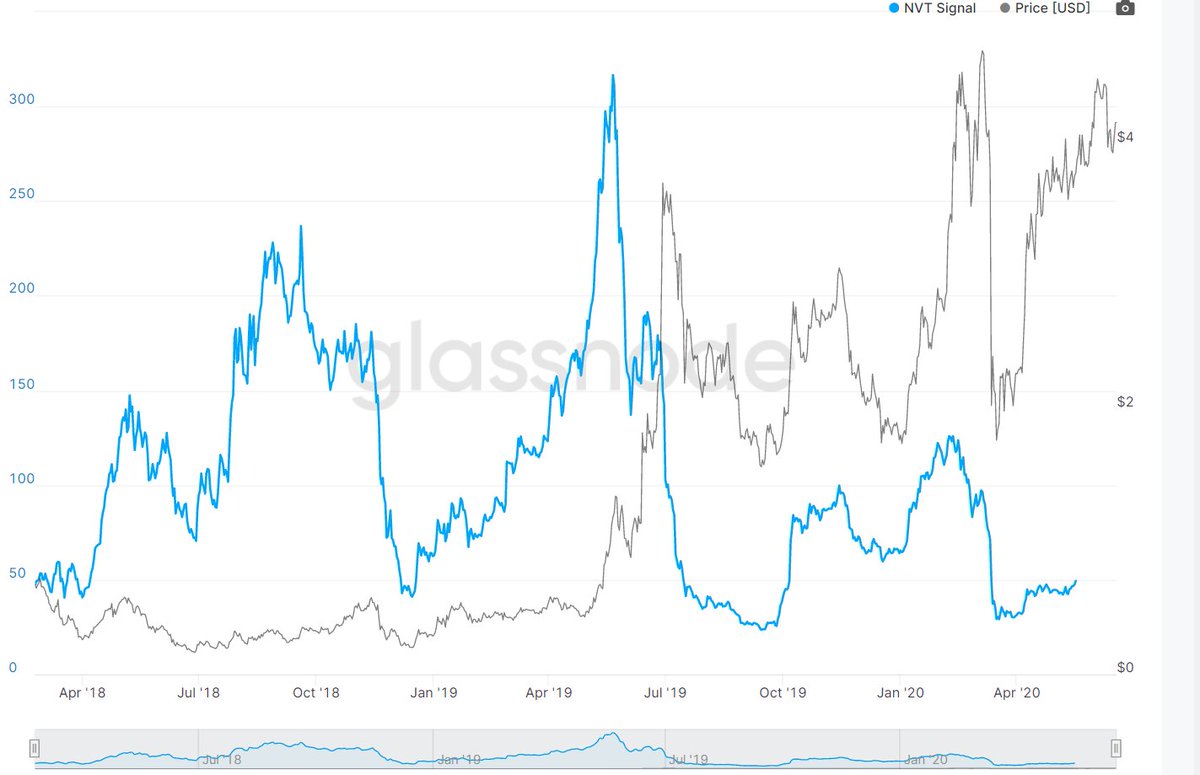
NVT ratio of $LINK (Network Value to Transactions)
(Market cap/ transferred on-chain volume in USD)
TL;DR: $LINK is undervalued
(further reading: https://www.norupp.com/nvt-ratio-and-nvt-signal-ratio-detect-bitcoin-bubbles/#:~:text=The%20NVT%20ratio%20is%20also,the%20stock%20price%20against%20earnings.)">https://www.norupp.com/nvt-ratio...
(Market cap/ transferred on-chain volume in USD)
TL;DR: $LINK is undervalued
(further reading: https://www.norupp.com/nvt-ratio-and-nvt-signal-ratio-detect-bitcoin-bubbles/#:~:text=The%20NVT%20ratio%20is%20also,the%20stock%20price%20against%20earnings.)">https://www.norupp.com/nvt-ratio...
$LINK NVT signal (NVT ratio except it uses 90 moving average of $ daily transaction volume)
When NVT signal (blue) Is below $USD (grey) it is a "Good time to buy"
Bear in mind mainnet went live end of May & #39;19 which is where transaction volume really began
b4 was speculation
When NVT signal (blue) Is below $USD (grey) it is a "Good time to buy"
Bear in mind mainnet went live end of May & #39;19 which is where transaction volume really began
b4 was speculation
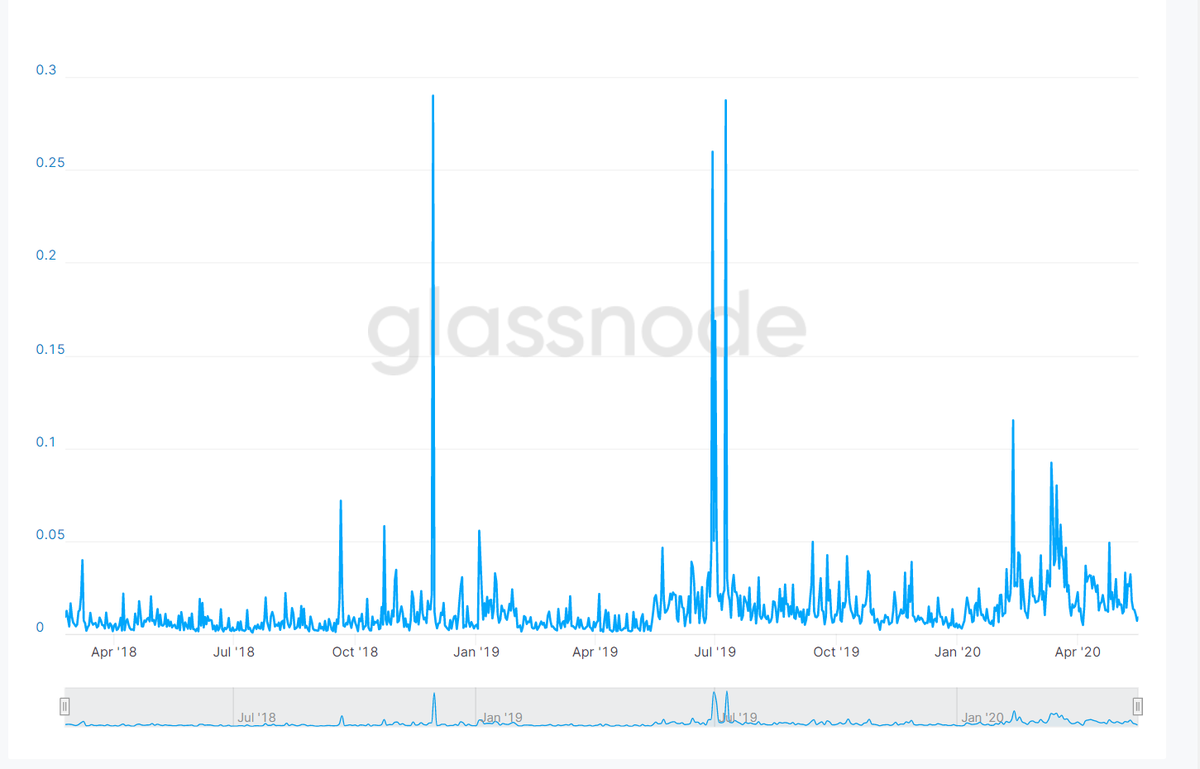
$LINK token velocity indicates people holding
Not much $LINK (in usd) is moving relative to market cap (in usd)
Most projects don& #39;t incentivise token holders to hold for more than a few minutes. High velocity tokens struggle to maintain long-term price appreciation
Not much $LINK (in usd) is moving relative to market cap (in usd)
Most projects don& #39;t incentivise token holders to hold for more than a few minutes. High velocity tokens struggle to maintain long-term price appreciation
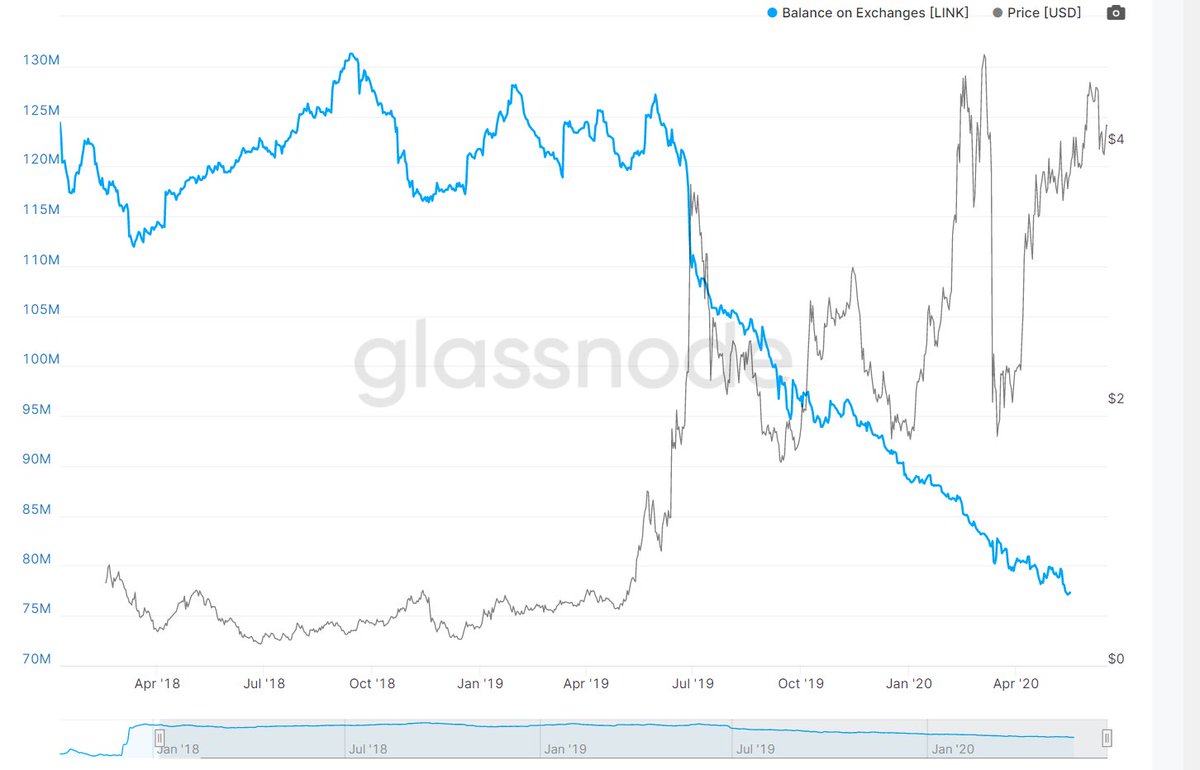
$LINK balance on exchanges slowly decreasing, this metric is for the exchanges shown in fig 2
^They have publicly known wallet address& #39;s
^They have publicly known wallet address& #39;s
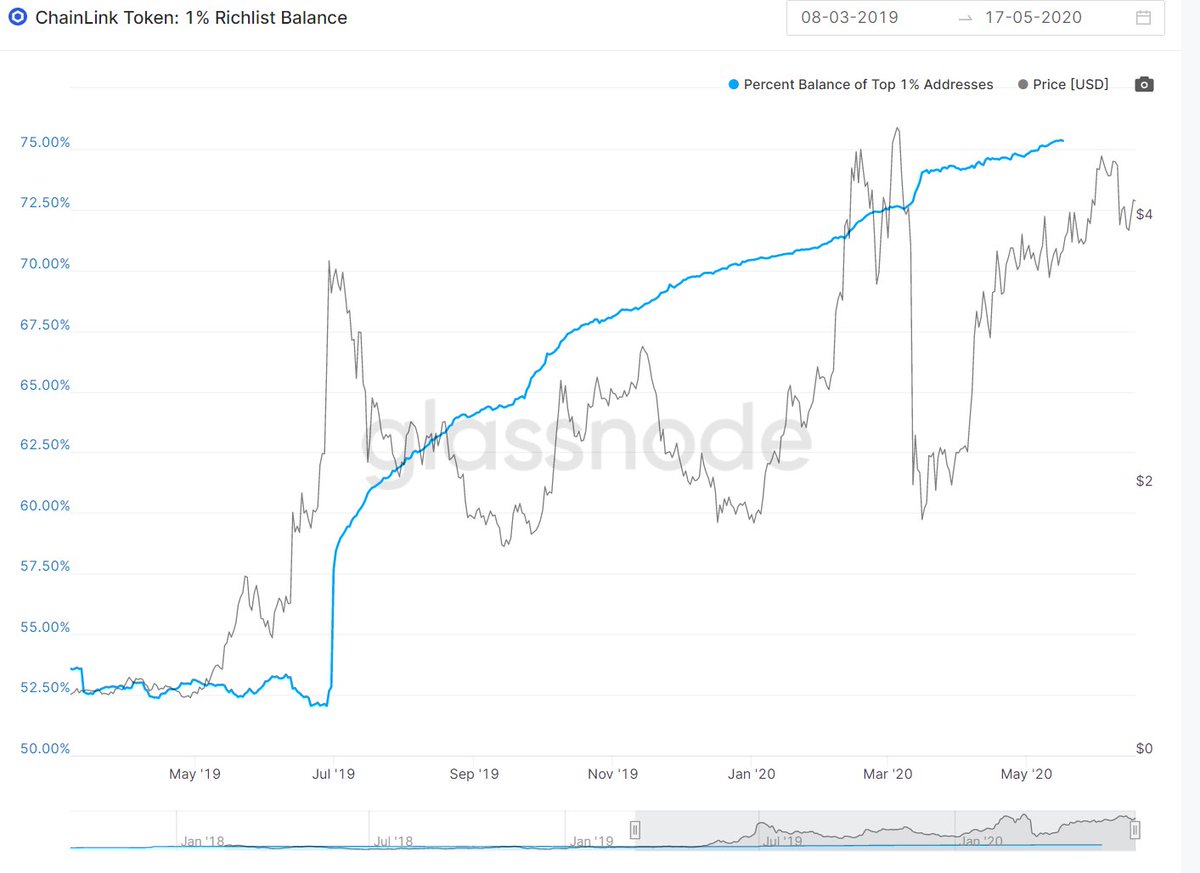
$LINK Richlist balance /$USD price
Whales are accumulating. Going from 52.1% in June 19 to 75.3% end of May (irrespective of price action)
(rich list is defined as the % of supply held by the top 1% addresses)
NOTE: this EXCLUDES the addresses of:
-Team funds
-Exchanges
Whales are accumulating. Going from 52.1% in June 19 to 75.3% end of May (irrespective of price action)
(rich list is defined as the % of supply held by the top 1% addresses)
NOTE: this EXCLUDES the addresses of:
-Team funds
-Exchanges

 Read on Twitter