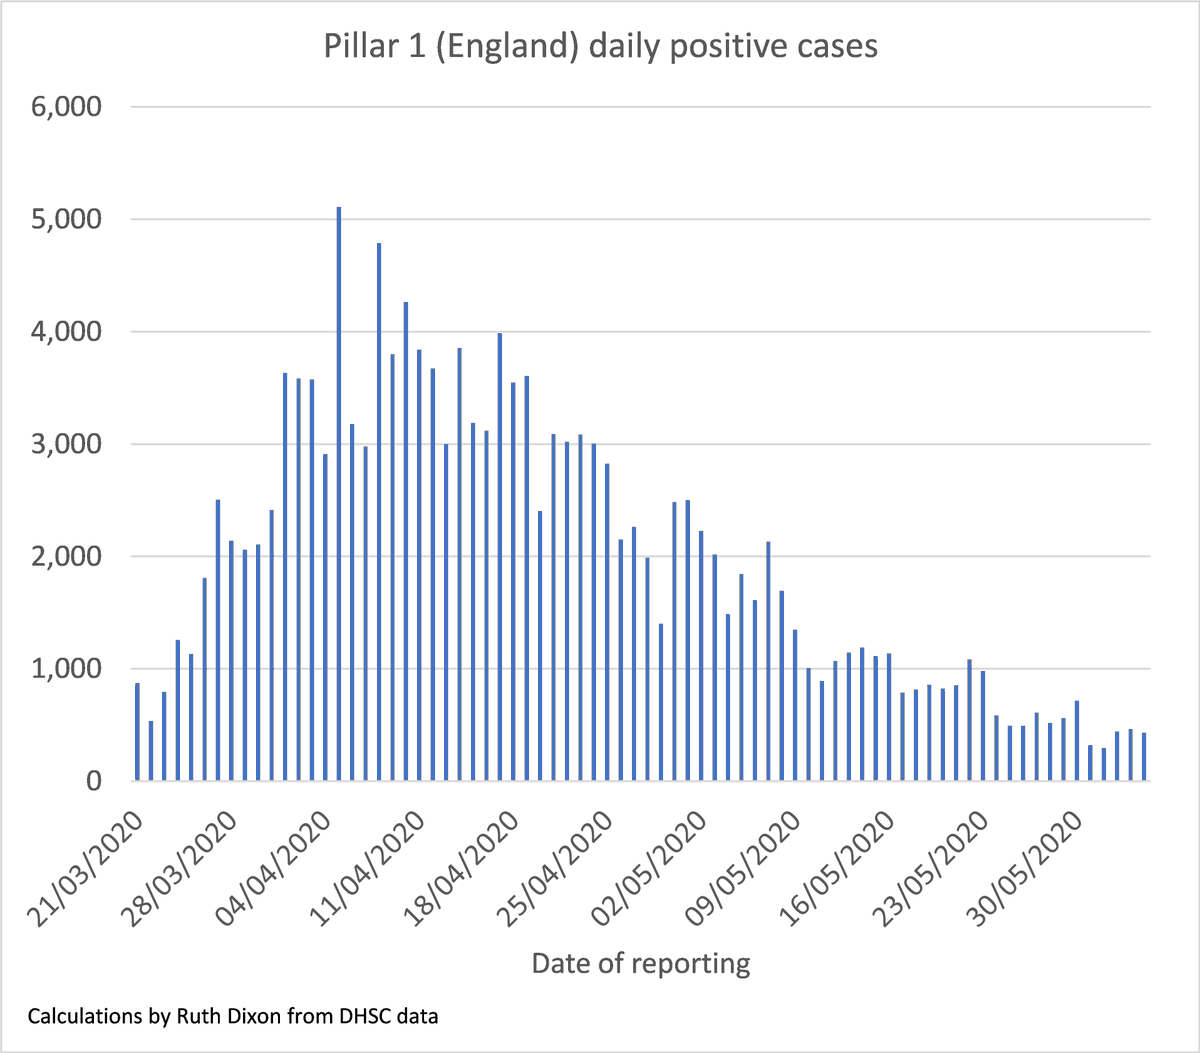
1/4 A short thread where I try to disentangle the @DHSCgovuk testing numbers. Data is from a csv linked here https://www.gov.uk/guidance/coronavirus-covid-19-information-for-the-public.">https://www.gov.uk/guidance/... Pillar 1 tests are mostly tests done in hospitals. These cases in England rose rapidly until mid-April, then started to fall.
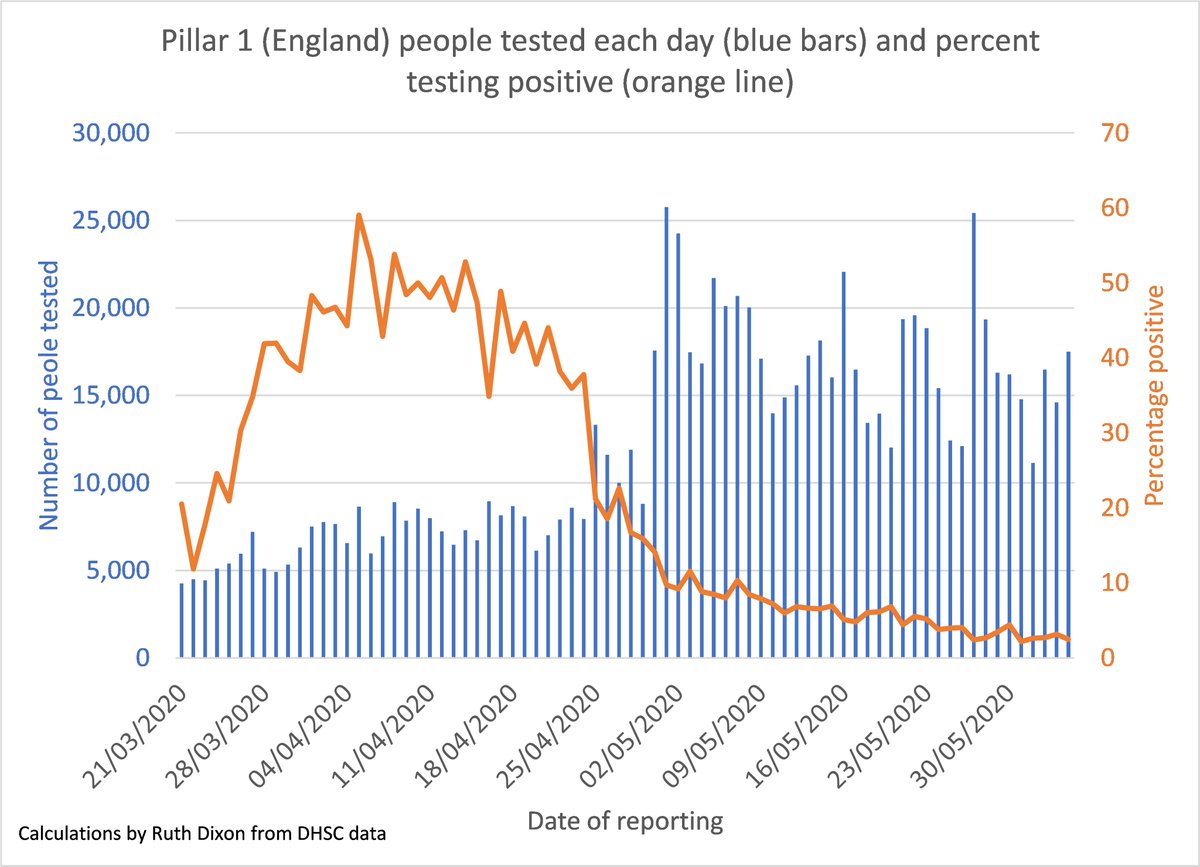
2/4 The “percentage positive” rate was apparently already falling before the sharp increase in Pillar 1 tests at the end of April. Data: https://www.gov.uk/guidance/coronavirus-covid-19-information-for-the-public">https://www.gov.uk/guidance/...
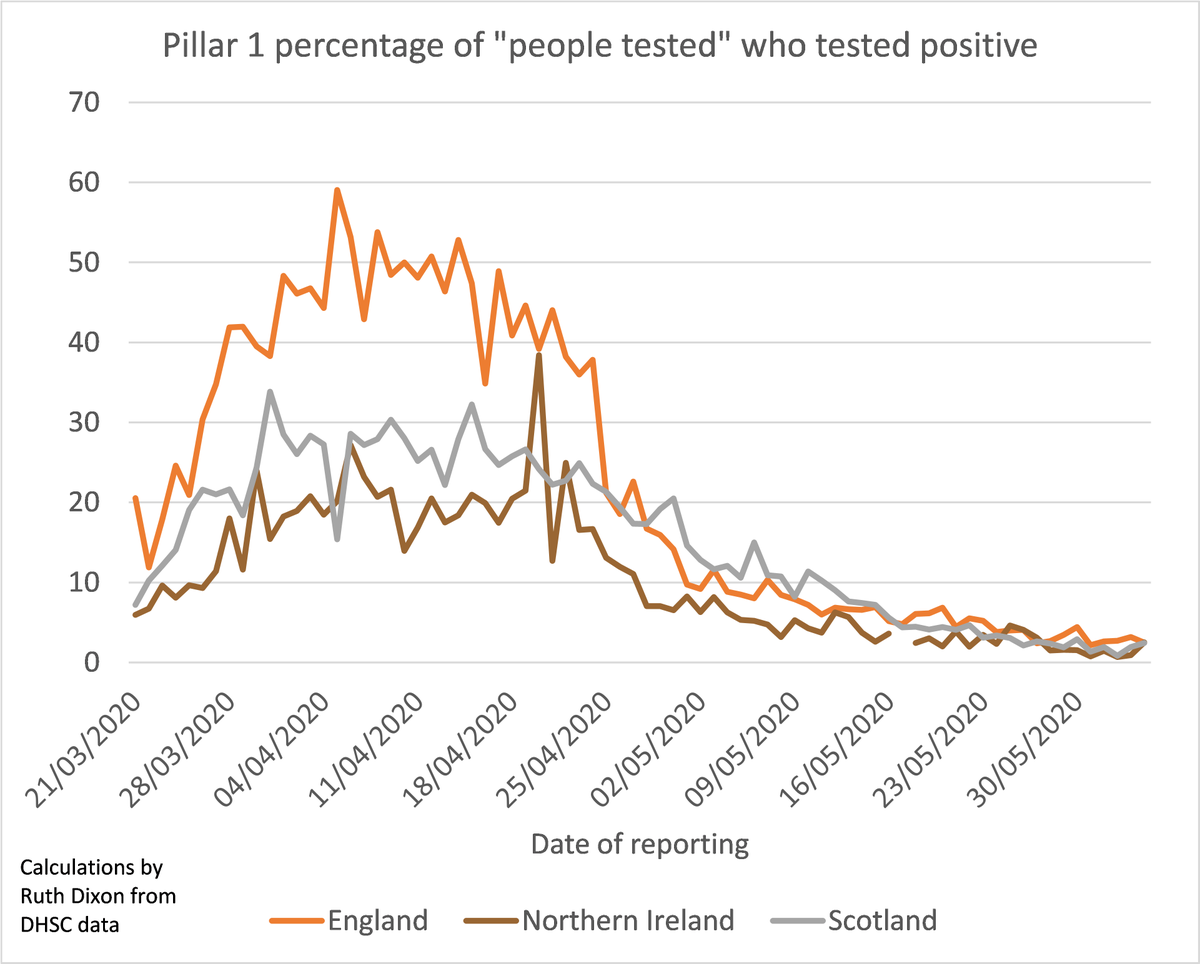
3/4 Similar timecourses are seen for Pillar 1 in Scotland and Northern Ireland, though they reach lower max percentages of positive cases than England. (Pillars 1 and 2 are combined in Wales so the numbers are incompatible.) Source of data: https://www.gov.uk/guidance/coronavirus-covid-19-information-for-the-public.">https://www.gov.uk/guidance/...
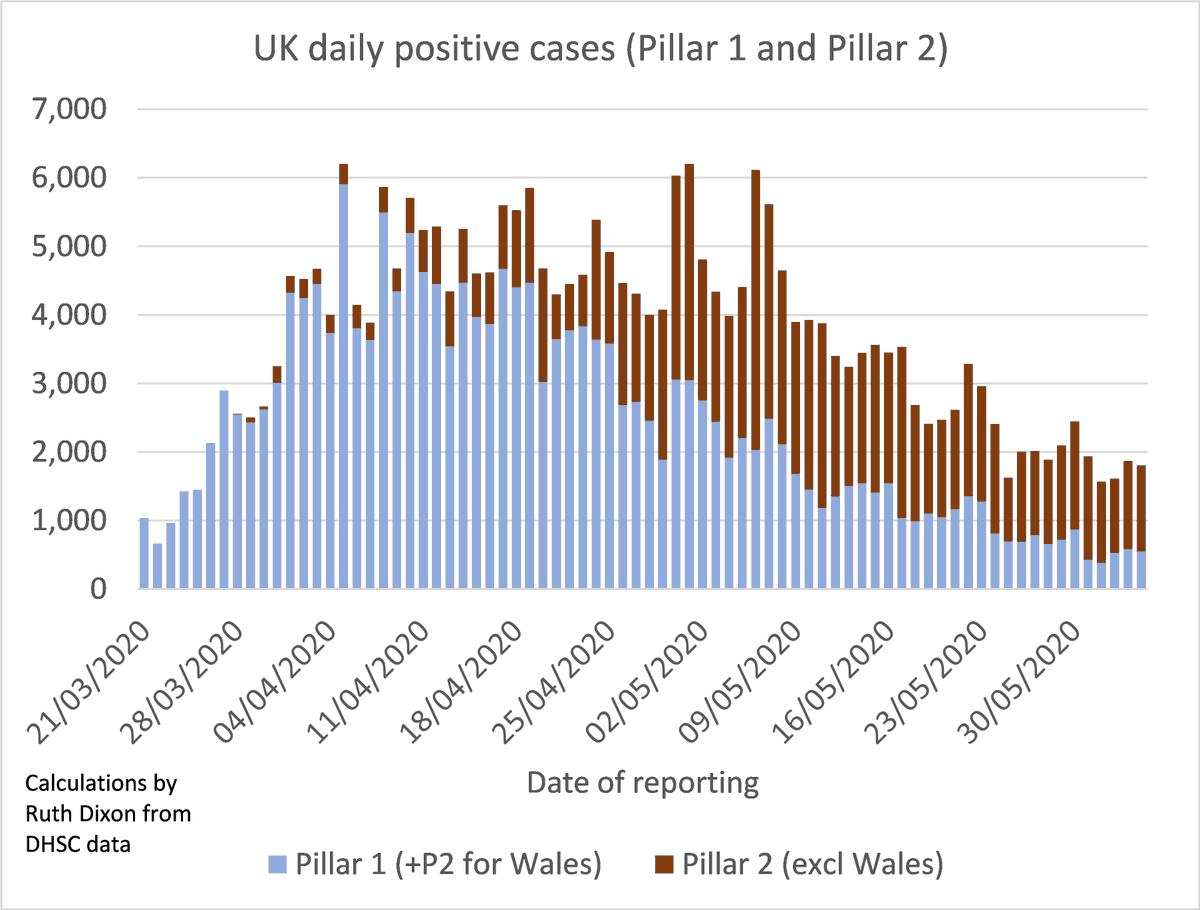
4/4 Most positive cases are now found in Pillar 2 (testing in the community). But as we don’t know how many people are tested each day under Pillar 2, nor the breakdown by country, it is hard to draw firm conclusions from these numbers. Source of data: https://www.gov.uk/guidance/coronavirus-covid-19-information-for-the-public.">https://www.gov.uk/guidance/...
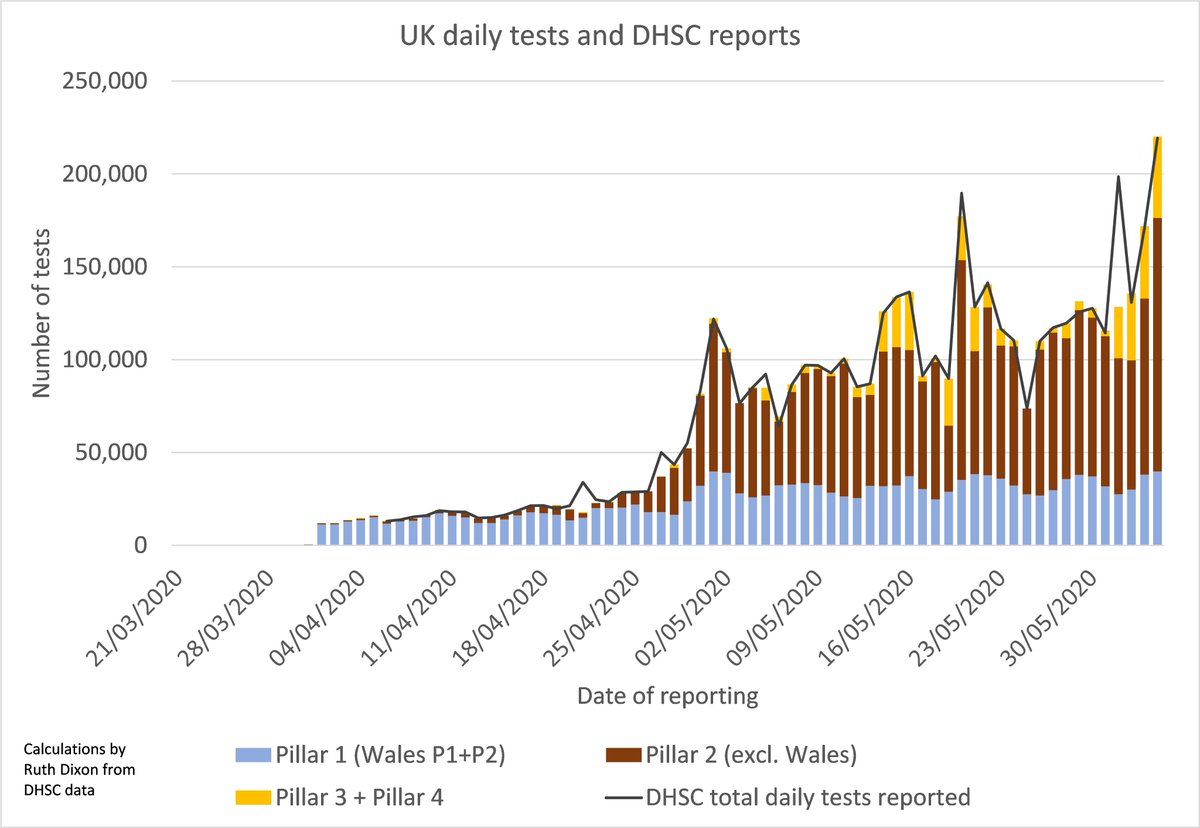
One more graph! Majority of tests are now Pillar 2 and more recently Pillars 3 and 4. P2 includes tests sent out and tests processed (with ways of avoiding double counting). P3 and P4 are long-term studies and no results are shown in the DHSC spreadsheet. https://www.gov.uk/guidance/coronavirus-covid-19-information-for-the-public">https://www.gov.uk/guidance/...
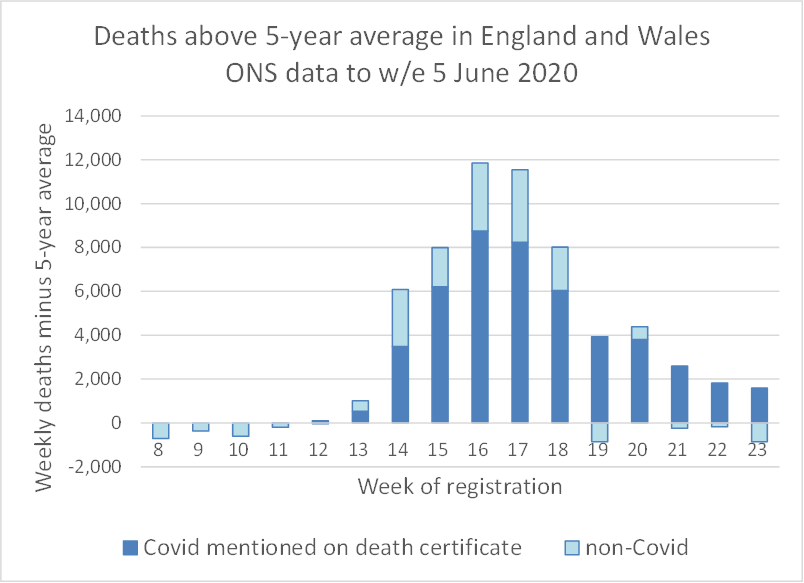
It is (very slightly) encouraging to see that there are no longer thousands of & #39;excess& #39; deaths in addition to those related to Covid. ONS data here https://www.ons.gov.uk/peoplepopulationandcommunity/birthsdeathsandmarriages/deaths/datasets/weeklyprovisionalfiguresondeathsregisteredinenglandandwales">https://www.ons.gov.uk/peoplepop...

 Read on Twitter