Benchmark all-in-one-metrics for NBA
Thanks to @knarsu3 who collect different NBA all-in-one metrics (e.g. RPM, PIPM) from 2013 to now, we now can benchmark them properly.
But first of all: how we can determine if it& #39;s a good benchmark? (1/n)
Thanks to @knarsu3 who collect different NBA all-in-one metrics (e.g. RPM, PIPM) from 2013 to now, we now can benchmark them properly.
But first of all: how we can determine if it& #39;s a good benchmark? (1/n)
For different NBA metrics, their methodology is vastly different with different objective function and variables/features used, and some of them aren& #39;t even having the methodology available publicly. You may ask: can we just model after teams win/loss and call it a day? (2/n)
e.g. previous work here: #p15334">http://apbr.org/metrics/viewtopic.php?f=2&t=8196&start=15 #p15334
The">https://apbr.org/metrics/v... answer is no, mainly due to the fact that there are only 30 teams in a season and with the addition of rookies and subtraction of free agent/retired players, W/L benchmark is filled by noise and hardly can tell anything (3/n)
The">https://apbr.org/metrics/v... answer is no, mainly due to the fact that there are only 30 teams in a season and with the addition of rookies and subtraction of free agent/retired players, W/L benchmark is filled by noise and hardly can tell anything (3/n)
Using Win/Loss We can tell bad metrics (e.g. PER, WS) from a good one, but not among those which are good (e.g. BPM, RPM).
Therefore we need another way to benchmark the data. Before talking about why we choose that as a benchmark let& #39;s have the data first... (4/n)
Therefore we need another way to benchmark the data. Before talking about why we choose that as a benchmark let& #39;s have the data first... (4/n)
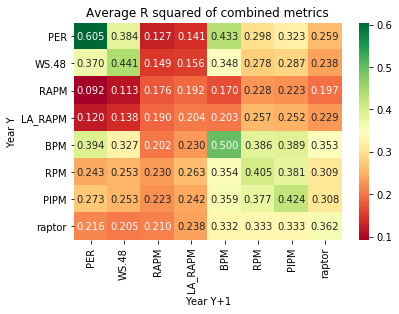
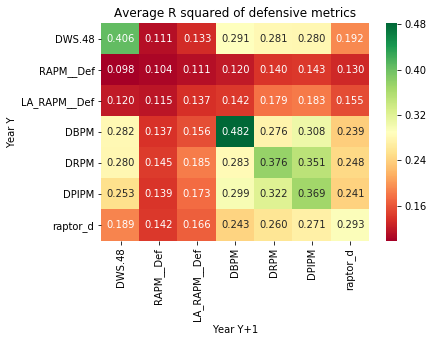
Here is the average R^2 value of year Y vs year Y+1 (i.e. compare 2014 data to 2015, 2015 to 2016... etc.).
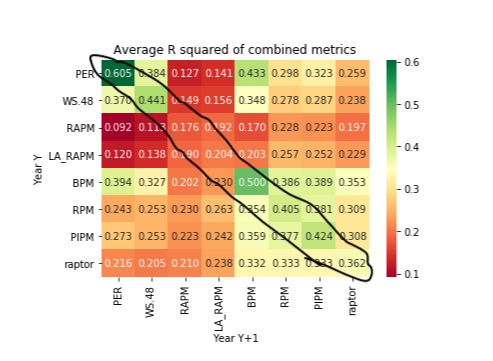
The data can be confusing, but first let& #39;s focus at the diagonal axis of the data: you will find diagonal axis has the highest value except for RAPM and LA-RAPM... (5/n)
The data can be confusing, but first let& #39;s focus at the diagonal axis of the data: you will find diagonal axis has the highest value except for RAPM and LA-RAPM... (5/n)
RAPM (regularized adjusted plus-minus) or LA-RAPM (lucked adjusted RAPM) are using ridge regression to find coefficient of each player, hence don& #39;t use any box score data and agnostic to the individual player. As a result every year are independent and diagonal term is low (6/n)
Whereas other metrics do utilize box score data, and due to bias in model building, they& #39;re highly correlated to itself more than any other metrics over different seasons.
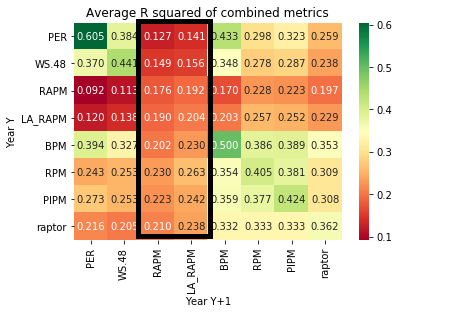
As a result, to get an accurate benchmark, we& #39;ve to rely on how good it& #39;s correlating to future RAPM (7/n)
As a result, to get an accurate benchmark, we& #39;ve to rely on how good it& #39;s correlating to future RAPM (7/n)
Back to the data, we now look at different metrics correlation to future (year Y+1) RAPM and LA-RAPM. Using LA-RAPM is slightly more accurate due to adjusting 3PT and FT luck, but conclusion is the same:
RPM > PIPM > 538 Raptor > BPM 2.0 > LA-RAPM > RAPM > WS/48 > PER (8/n)
RPM > PIPM > 538 Raptor > BPM 2.0 > LA-RAPM > RAPM > WS/48 > PER (8/n)
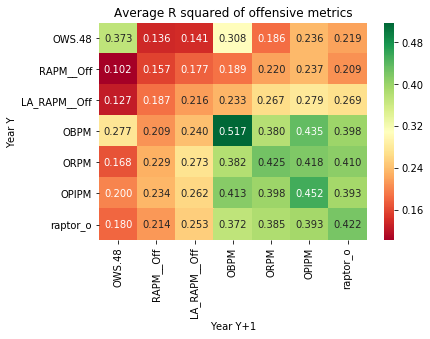
Similarly, such matrix can be generated for offense and defense as well, and the result is still pretty similar, except offense has a higher correlation since we can measure it better
Going forward, it& #39;d be good for creating different metrics to give out some sort of benchmark as this is the only way to judge your model. The data and code to reproduce the figure above are available on github: https://github.com/903124/NBA_data_benchmark">https://github.com/903124/NB... (n/n)

 Read on Twitter