Shortly, NFL teams will be voting on an alternative to the onside kick – a 4th-and-15 scrimmage play.
Ironing out the equity of an onside kick alternative is notably more difficult than it sounds.
In this thread, I’m going to share how our @NFLFootballOps group went about it
Ironing out the equity of an onside kick alternative is notably more difficult than it sounds.
In this thread, I’m going to share how our @NFLFootballOps group went about it
Impetus for an onside kick alternative stems from the 2018 kickoff rule change, which limited the number of players on each side of the kicker (5, instead of 6) and the running start to teams attempting an onsides attempt.
One important estimand is the probability of recovering an onside kick. However, the overall recovery rate is misleading – it’s 3x to 4x easier to recover surprise onside kicks. And the number of surprise onside kicks has dropped by about 70% since 2018. We have to drop surprises
So, our estimand should be the likelihood of recovering an expected onside kick. But it’s still not that easy. There could be a penalty that negates a recovery/failed recovery with the teams starting over. We have to drop plays negated by penalty.
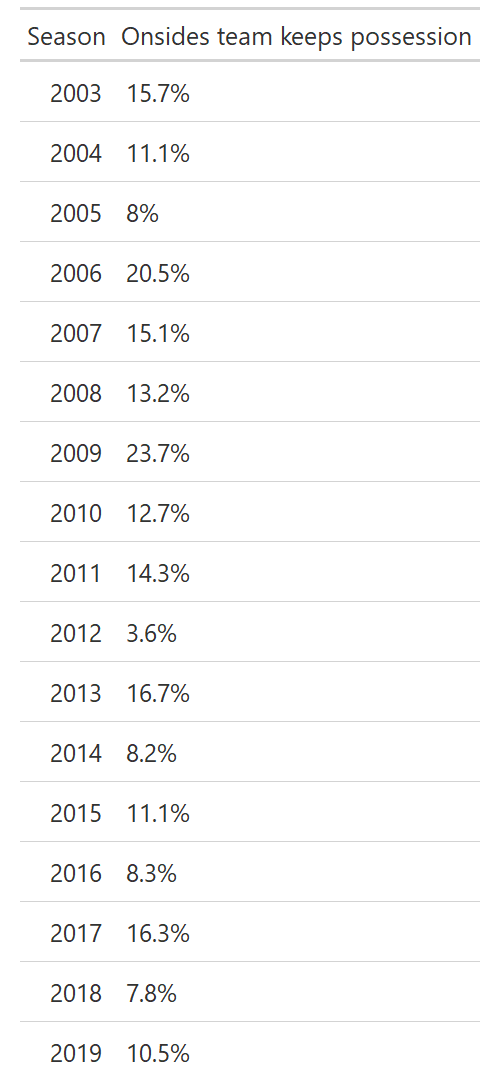
So, our new estimand is the probability of keeping possession after an expected onside kick. There& #39;s also selective endpoints. Want to make the estimand look higher? Include 2009. Here are probabilities by year
Our best estimate of the pre-2017 rate for the possession team keeping the ball is around 13%. Last two years? About 9%. This equates to between 2 and 3 fewer recoveries per year.
On its own, uncertainty about binary events may not be conclusive that the rate has dropped. But let’s look at the kickoff team players – using @nextgenstats data, they’re notably slower getting downfield in 2017 compared to 2018 https://twitter.com/i/status/1263892959545745415">https://twitter.com/i/status/...
Now, for the alternative. What& #39;s an equivalent scrimmage play? This also isn& #39;t obvious.
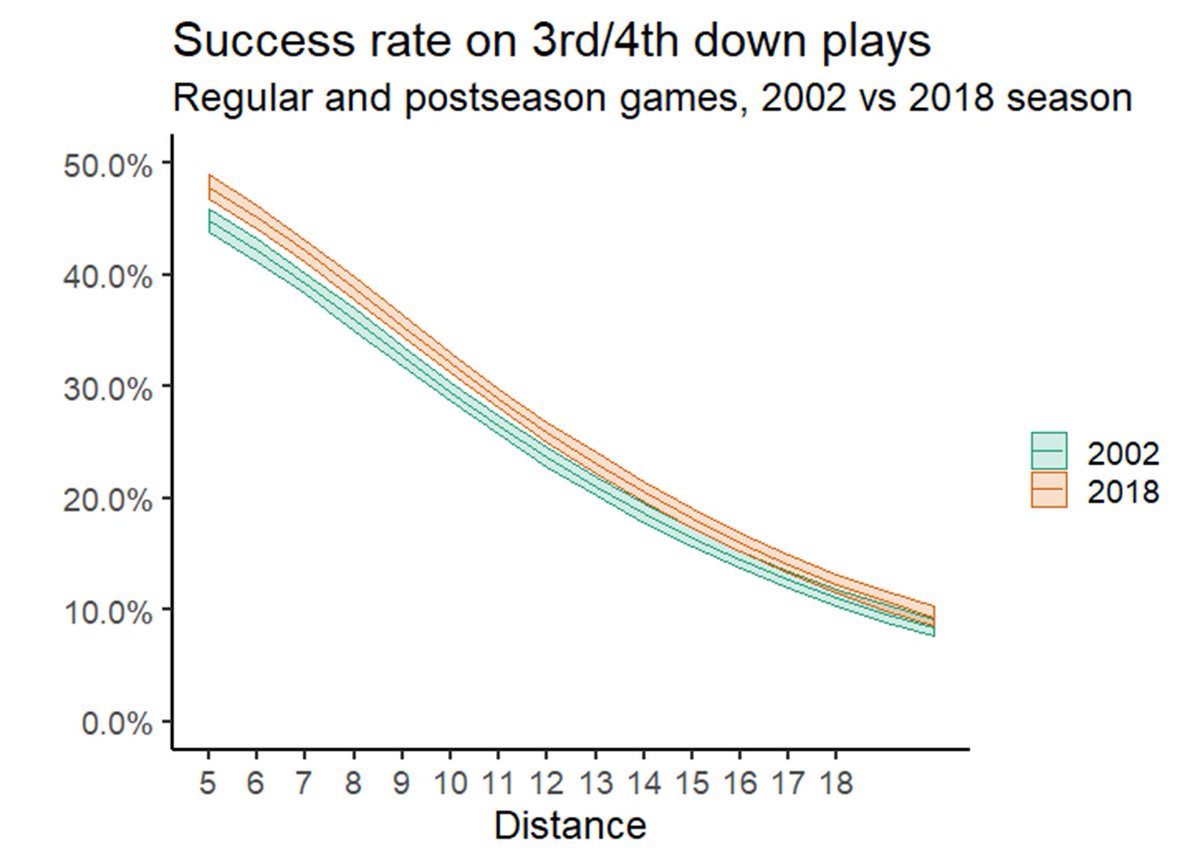
- Teams more likely to convert in recent seasons
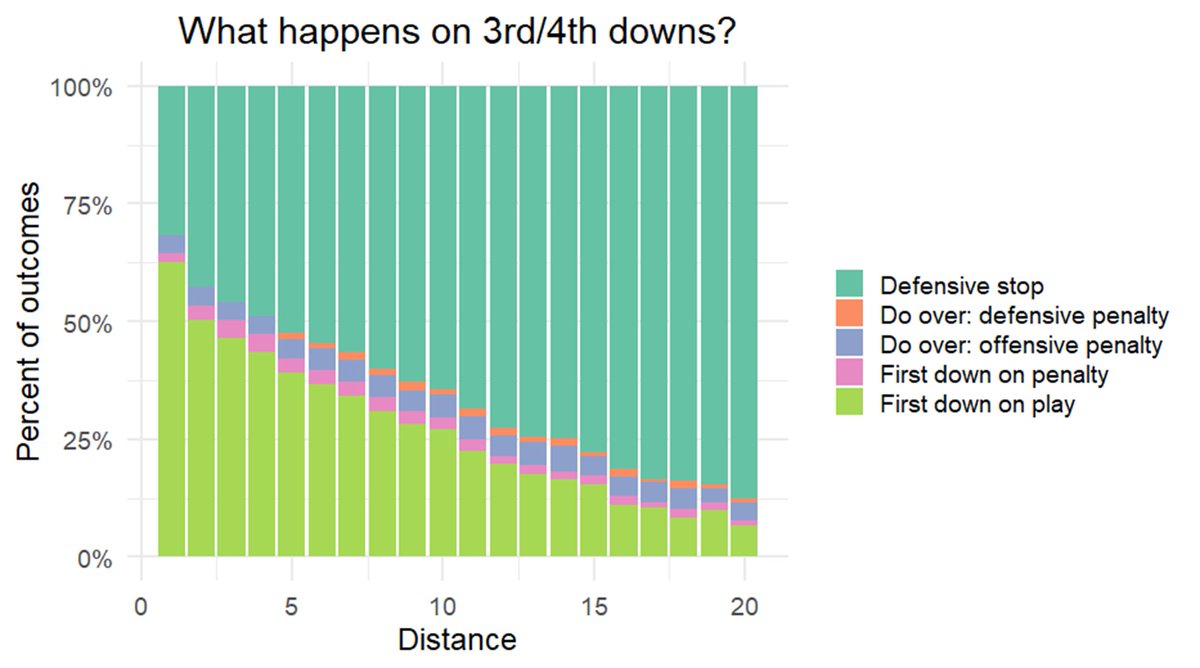
- Penalties rear their ugly head
- Focus should be on one-score games
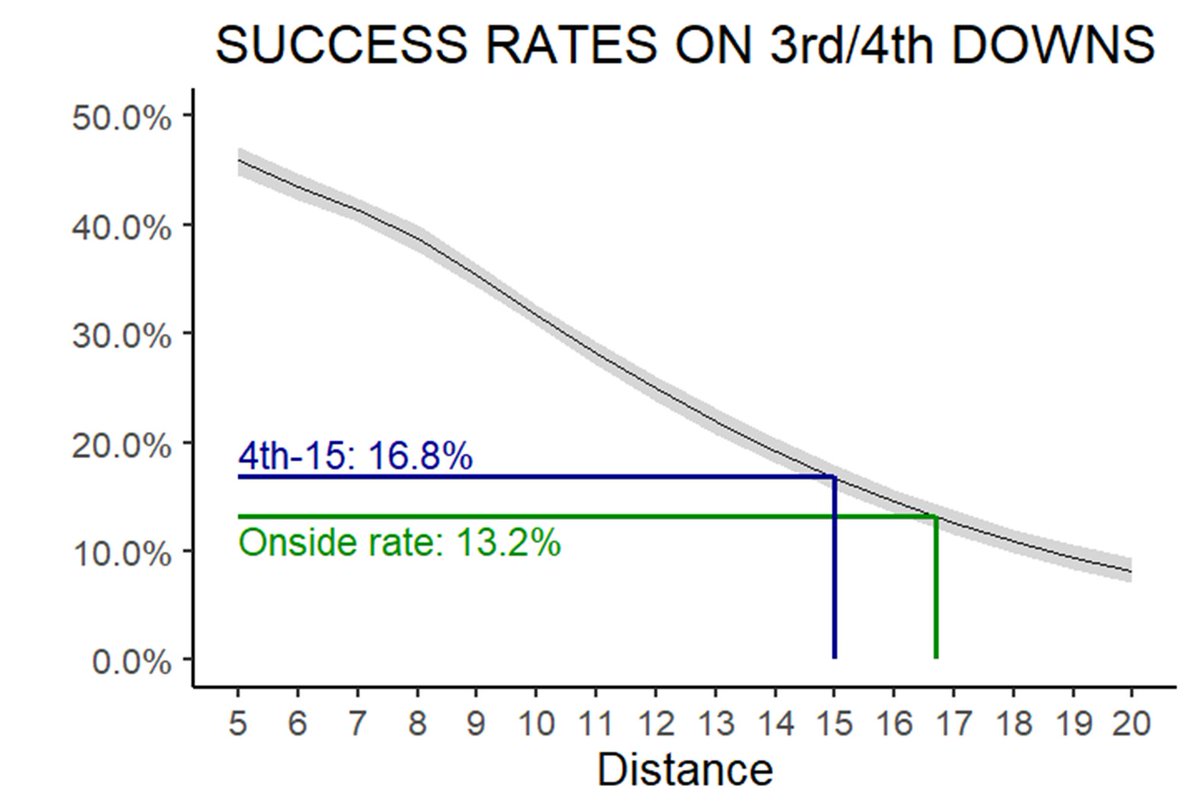
We settled that 4th-and-15 would be slightly easier (third chart)
- Teams more likely to convert in recent seasons
- Penalties rear their ugly head
- Focus should be on one-score games
We settled that 4th-and-15 would be slightly easier (third chart)
Other notes:
- There& #39;s a penalty on about 18% of onside kicks, by far the highest rate of all play types
- Teams attempting an onsides kick have won about 2% of the time since 2003. In last two years, teams are 0-and-104 when attempting an expected onside kick
- There& #39;s a penalty on about 18% of onside kicks, by far the highest rate of all play types
- Teams attempting an onsides kick have won about 2% of the time since 2003. In last two years, teams are 0-and-104 when attempting an expected onside kick
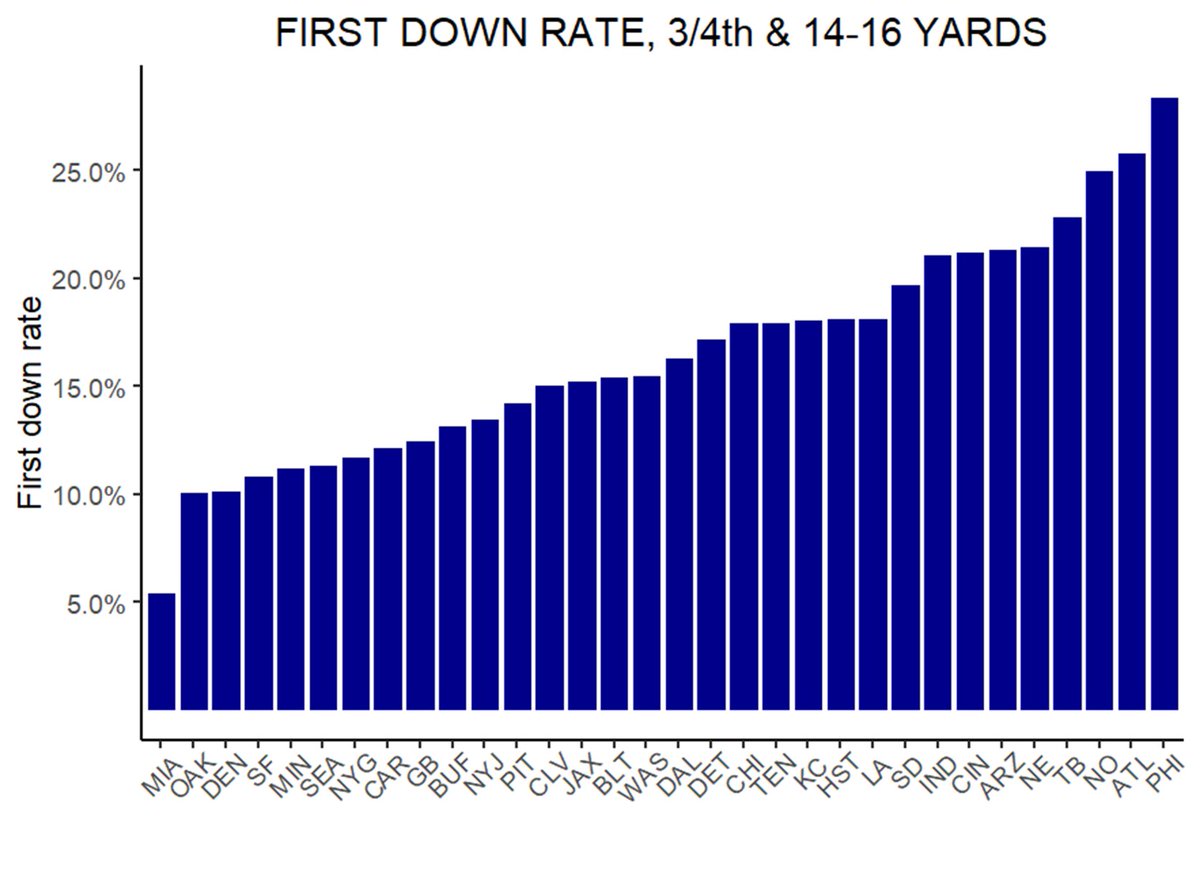
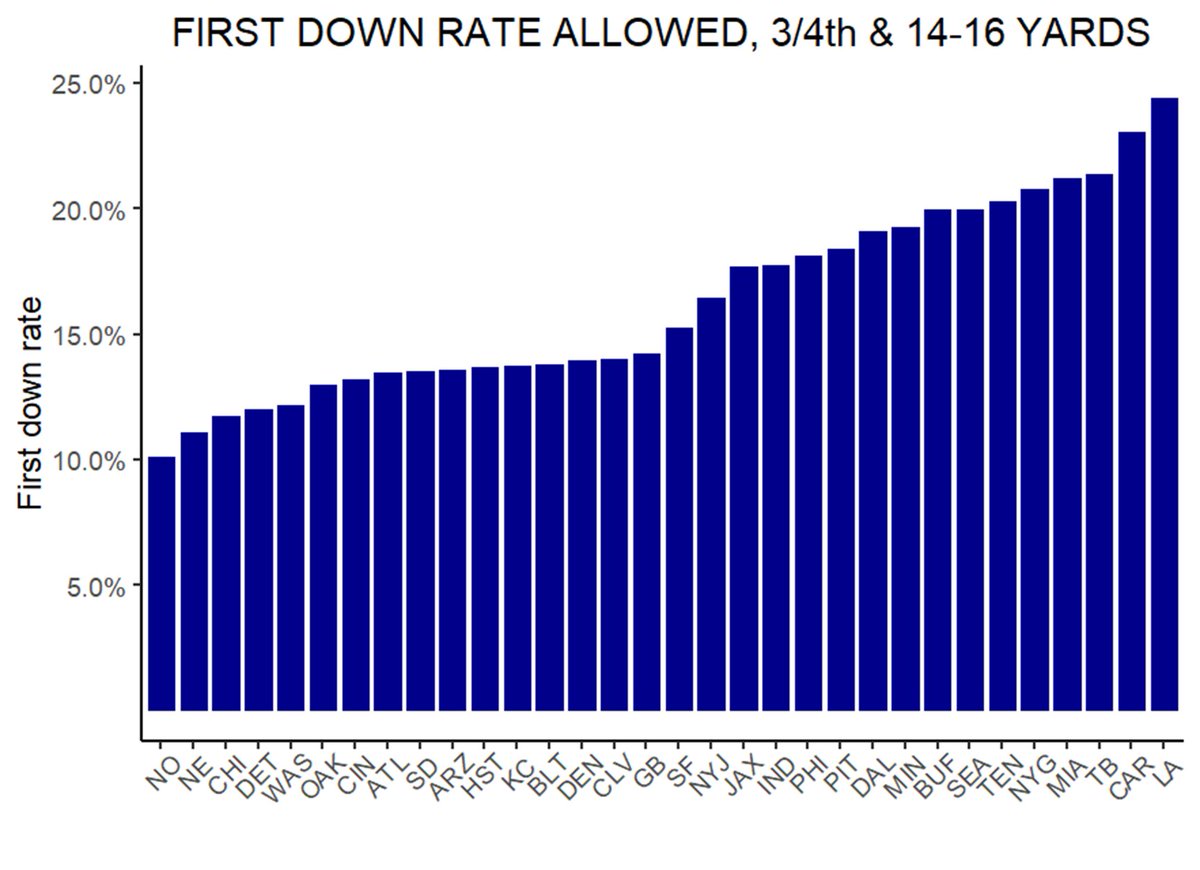
There are also non-negligible team-level differences in converting and preventing long scrimmage plays (data from 2010-2018)
Last point -- as shown here, the reason the 25 yard-line is being considered is that it roughly equates where teams successful on a scrimmage play would finish and where teams successful on an onsides kick would finish https://twitter.com/StatsbyLopez/status/1263896044586373120">https://twitter.com/StatsbyLo...
This thread is already too long. But as always, football data is more challenging that it initially seems. Penalties, surprise attempts, and changes over time are three complexities mentioned above that folks may have missed. Hope it helps
PS -- My favorite onside kick anecdote -- between 2002 and 2017, teams recovered 43% (!!!!) of surprise onside kicks. Holy shit.

 Read on Twitter