This tweet/replies below encapsulate the nightmare of Twitter, esp now. Spread of misleading info that confirms existing biases, to the point of suggesting a conspiracy.
Just bc Republicans are incalculably worse doesn& #39;t mean you& #39;re not susceptible to misinformation!
THREAD 1/ https://twitter.com/SquireForYou/status/1265553065056362497">https://twitter.com/SquireFor...
Just bc Republicans are incalculably worse doesn& #39;t mean you& #39;re not susceptible to misinformation!
THREAD 1/ https://twitter.com/SquireForYou/status/1265553065056362497">https://twitter.com/SquireFor...
If you don& #39;t want to read all of this, basic summary:
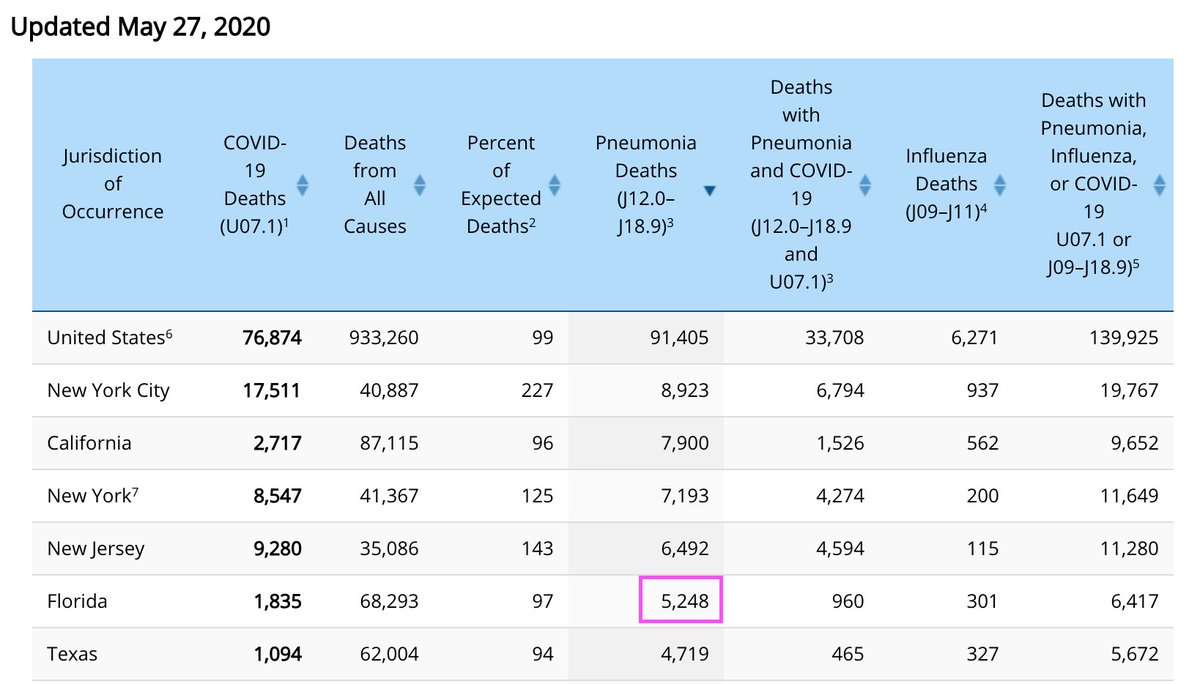
- NO, there is NOT a giant unaccounted surplus of pneumonia deaths in Florida, at least not to the extent described here. There is no reason to doubt FL& #39;s reporting based on this (supposed) gap
2/
- NO, there is NOT a giant unaccounted surplus of pneumonia deaths in Florida, at least not to the extent described here. There is no reason to doubt FL& #39;s reporting based on this (supposed) gap
2/
The source OP uses (linked in replies) does not compare apples to apples.
Some databases track a single underlying (leading) cause of death. Other databases account for multiple causes of death. (Thanks to this tweet which first pointed this out.)
https://twitter.com/FT__Dan/status/1265771908882104320
3/">https://twitter.com/FT__Dan/s...
Some databases track a single underlying (leading) cause of death. Other databases account for multiple causes of death. (Thanks to this tweet which first pointed this out.)
https://twitter.com/FT__Dan/status/1265771908882104320
3/">https://twitter.com/FT__Dan/s...
To dive deeper, here& #39;s the source for the 5185 (now 5248) pneumonia deaths in Florida this year. https://www.cdc.gov/nchs/nvss/vsrr/covid19/index.htm
4/">https://www.cdc.gov/nchs/nvss...
4/">https://www.cdc.gov/nchs/nvss...
Does this number of pneumonia deaths come from the underlying cause of death (UCD) listings (in which case we would expect the number to be lower, since you can only have a single UCD).
Or does it also count people whose death certificates listed it as one of multiple causes?
5/
Or does it also count people whose death certificates listed it as one of multiple causes?
5/
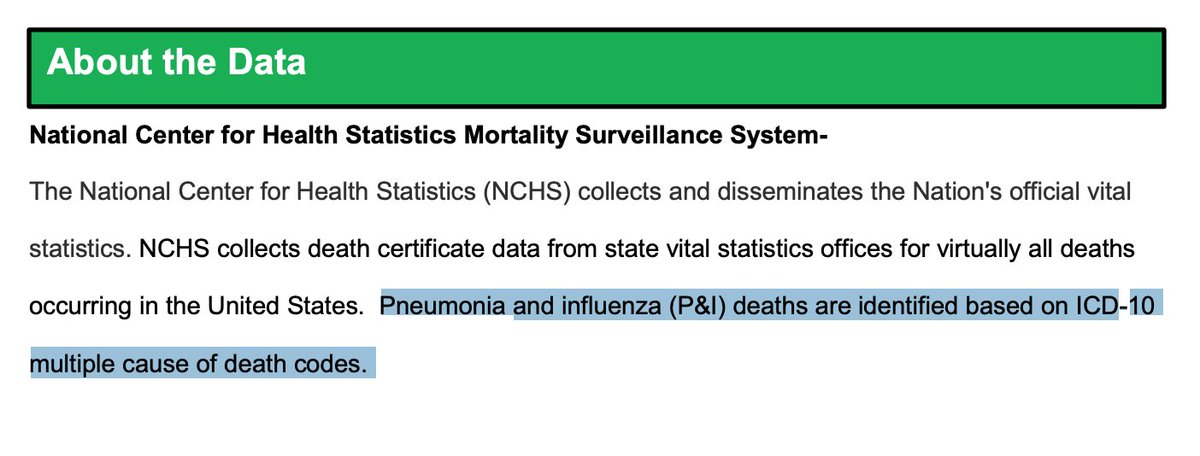
Conveniently, there& #39;s a link on this page called "Technical Notes" that gives us the answer. Pneumonia death counts come from multiple cause-of-death codes.
https://cdc.gov/nchs/nvss/vsrr/covid19/tech_notes.htm
6/">https://cdc.gov/nchs/nvss...
https://cdc.gov/nchs/nvss/vsrr/covid19/tech_notes.htm
6/">https://cdc.gov/nchs/nvss...
Holding that to move onto the origin of the 918 figure for 2013-2018. When asked for a source, OP linked this Reddit thread (not this specific comment but it appears to be what they were referring to, since it& #39;s the only place with 918).
7/ https://www.reddit.com/r/Coronavirus/comments/gqypwx/kentucky_has_had_913_more_pneumonia_deaths_than/frw4vie?utm_source=share&utm_medium=web2x">https://www.reddit.com/r/Coronav...
7/ https://www.reddit.com/r/Coronavirus/comments/gqypwx/kentucky_has_had_913_more_pneumonia_deaths_than/frw4vie?utm_source=share&utm_medium=web2x">https://www.reddit.com/r/Coronav...
The person who wrote this comment used the CDC Wonder UCD database to get the 918 average.
But there& #39;s only one UCD on a death certificate, so we expect those stats to be lower than stats that include pneumonia as one of multiple causes.
https://wonder.cdc.gov/ucd-icd10.html ">https://wonder.cdc.gov/ucd-icd10...
But there& #39;s only one UCD on a death certificate, so we expect those stats to be lower than stats that include pneumonia as one of multiple causes.
https://wonder.cdc.gov/ucd-icd10.html ">https://wonder.cdc.gov/ucd-icd10...
(It *does* look like 918 is accurate for UCD-- didn& #39;t check all of the years bc I didn& #39;t see a way to query multiple non-contiguous time periods at once/I& #39;d have to manually average them. But looks in the ballpark from 2017/18.
But doesn& #39;t matter bc data isn& #39;t comparable!)
9/
But doesn& #39;t matter bc data isn& #39;t comparable!)
9/
Now, that& #39;s sufficient reason why this is extremely misleading/a bad comparison.
But what is the typical number of deaths from pneumonia in Florida *when you include multiple cause-of-death codes*?
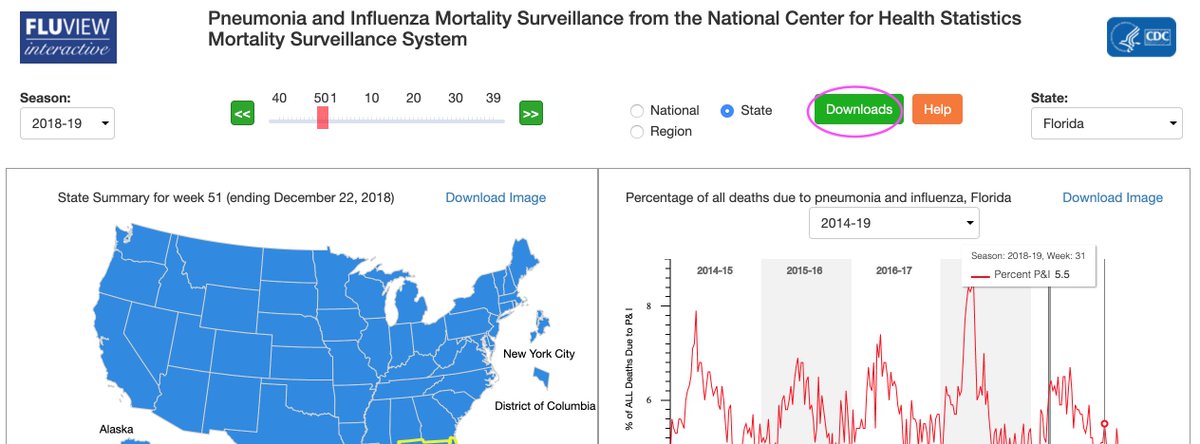
Here& #39;s where you can look up that data: https://gis.cdc.gov/grasp/fluview/mortality.html
10/">https://gis.cdc.gov/grasp/flu...
But what is the typical number of deaths from pneumonia in Florida *when you include multiple cause-of-death codes*?
Here& #39;s where you can look up that data: https://gis.cdc.gov/grasp/fluview/mortality.html
10/">https://gis.cdc.gov/grasp/flu...
Step 0 (before you download the data, look at what you& #39;re downloading): click the "Help" button on the top right. It links to this PDF that gives more info about the data.
Here we can verify that these numbers are based on multiple cause-of-death codes. https://abs.twimg.com/emoji/v2/... draggable="false" alt="✅" title="White heavy check mark" aria-label="Emoji: White heavy check mark">
https://gis.cdc.gov/grasp/fluview/FluViewPhase7QuickReferenceGuide.pdf">https://gis.cdc.gov/grasp/flu...
Here we can verify that these numbers are based on multiple cause-of-death codes.
https://gis.cdc.gov/grasp/fluview/FluViewPhase7QuickReferenceGuide.pdf">https://gis.cdc.gov/grasp/flu...
Now...
Step 1: click the "Downloads" button
Step 2: select the options you want ("Custom data," and you want State-level data for all the seasons/years)
Step 3: click "Download data" and you will get a CSV
Step 1: click the "Downloads" button
Step 2: select the options you want ("Custom data," and you want State-level data for all the seasons/years)
Step 3: click "Download data" and you will get a CSV
The next part mostly involves spreadsheet manipulation. But before you do that, note relevant column names:
* WEEK (gives you which week out of the year, 1-52)
* SEASON (gives you which season, as a range of 2 yrs, e.g. 2018-19 since flu season is in winter)
* WEEK (gives you which week out of the year, 1-52)
* SEASON (gives you which season, as a range of 2 yrs, e.g. 2018-19 since flu season is in winter)
(WEEK still tracks w/ calendar year though!)
* NUM INFLUENZA DEATHS
* NUM PNEUMONIA DEATHS (pneumonia & flu numbers are often combined, so it& #39;s helpful they& #39;re separate here)
* NUM INFLUENZA DEATHS
* NUM PNEUMONIA DEATHS (pneumonia & flu numbers are often combined, so it& #39;s helpful they& #39;re separate here)
And there& #39;s also
* SUB AREA (which state)
* PERCENT COMPLETE (is there any missing data/unknown deaths? Data are often incomplete, especially if recent! But also reporting isn& #39;t always perfect, and you do the best you can w/ what you have.)
* SUB AREA (which state)
* PERCENT COMPLETE (is there any missing data/unknown deaths? Data are often incomplete, especially if recent! But also reporting isn& #39;t always perfect, and you do the best you can w/ what you have.)
Bearing in mind the CDC& #39;s caveat on comparing their COVID-19 data to other sources (at the same "Technical Notes page linked above -- basically, you might find discrepancies w/ other sources bc of state/local differences in reporting, their data is generally 1-2 wks behind)...

 Read on Twitter


 https://gis.cdc.gov/grasp/flu..." title="Step 0 (before you download the data, look at what you& #39;re downloading): click the "Help" button on the top right. It links to this PDF that gives more info about the data.Here we can verify that these numbers are based on multiple cause-of-death codes. https://abs.twimg.com/emoji/v2/... draggable="false" alt="✅" title="White heavy check mark" aria-label="Emoji: White heavy check mark"> https://gis.cdc.gov/grasp/flu..." class="img-responsive" style="max-width:100%;"/>


