How to understand the basics of DWI-ADC in MRI?
(without dying from the physics of it!)
A shot at a tweetorial.
1/20
(without dying from the physics of it!)
A shot at a tweetorial.
1/20
Even the basics of DWI-ADC always scare me. Now that I THINK I understand some of it, I have decided to make a tweetorial on it. Please feel free to correct me wherever I mess up and if it somehow ends up being helpful, let& #39;s just pretend I planned it that way!
2/20
2/20
Diffusion is the random movement of particles due to thermal energy. In our body, water is distributed in the intra and extra-cellular compartments in a rough ratio of 1:3. The water in the ECF diffuses more as they don& #39;t run into cell walls and intra-cellular organelles.
3/20
3/20
Any disease process can increase or decrease the normal diffusion of water. Damaged tissues with loss of cellular architecture tend to have more ECF compared to ICF and thus contain more water with increased diffusion.
4/20
4/20
On the other hand, tissues can have reduced diffusion like in case of infarcts or abscesses or even certain neoplasms. The mechanism causing reduction in diffusion is specific to the pathology in question.
5/20
5/20
Infarction results in cellular swelling leading to decreased ECF (and more water in ICF) as well as cellular rupture spreading the intra-cellular components in the ECF increasing the viscosity of the fluid. That ultimately leads to reduced diffusion.
6/20
6/20
Something like an abscess also shows reduced diffusion because it is essentially a walled off area off viscous fluid with cellular debris, bacteria and inflammatory cells where water cannot move freely.
Case courtesy of Radswiki, http://Radiopaedia.org"> http://Radiopaedia.org , rID: 11857
7/20
Case courtesy of Radswiki, http://Radiopaedia.org"> http://Radiopaedia.org , rID: 11857
7/20
Tumours as a rule do not restrict diffusion but some tumours which are VERY cellular like lymphoma or malignant gliomas can obstruc the diffusion of water with cell walls which act as barriers. Increased mass of cells also decreases the ECF.
8/20
8/20
Diffusion-weighted imaging (DWI) is the technique which measures the random brownian motion of water molecules within a single unit of volume of the tissue (called a voxel). ADC (Apparent Diffusion Coefficient) is the observed diffusion coefficient.
9/20
9/20
We can get discrete values of the signal from a particular tissue using an ADC map which calculates the mean diffusion. The process of acquiring DWI-ADC images can be broken down into these steps.
10/20
10/20
Two sets of images are acquired. The first set of images (called b=0 images) are taken WITHOUT application of a Diffusion Gradient. This image is similar to a T2 WI. The next set of images (with b=1000, called DW source images) are acquired WITH a diffusion gradient.
11/20
11/20
The DW Source images generate the DW images that we use clinically. Using these two sets of images, the ADC map is generated. DWI shows restriction as bright areas while ADC map shows them as dark areas.
Let’s understand why this happens.
12/20
Let’s understand why this happens.
12/20
During the acquisition of the second set of images, two pulse gradients cause signal loss from protons that are diffusing freely like in normal brain but not from stationary protons as in an abscess or infarct. Let’s delve a bit deeper.
13/20
13/20
The strong gradient causes the protons to dephase and when the same gradient is reapplied, the protons rephase and give HIGH SIGNAL if their movement is RESTRICTED. Thus, any phase accumulation from the first gradient is reversed by the second.
14/20
14/20
But if the protons move in between the application of the two gradient pulses, they are going to experience different gradients and are going to fall out of phase leading to LOSS of SIGNAL. That is why normal brain which does not restrict is dark.
15/20
15/20
This image Courtesy of Allen D. Elster, http://MRIquestions.com"> http://MRIquestions.com , illustrates the difference between the signal from the stationary and moving protons.
16/20
16/20
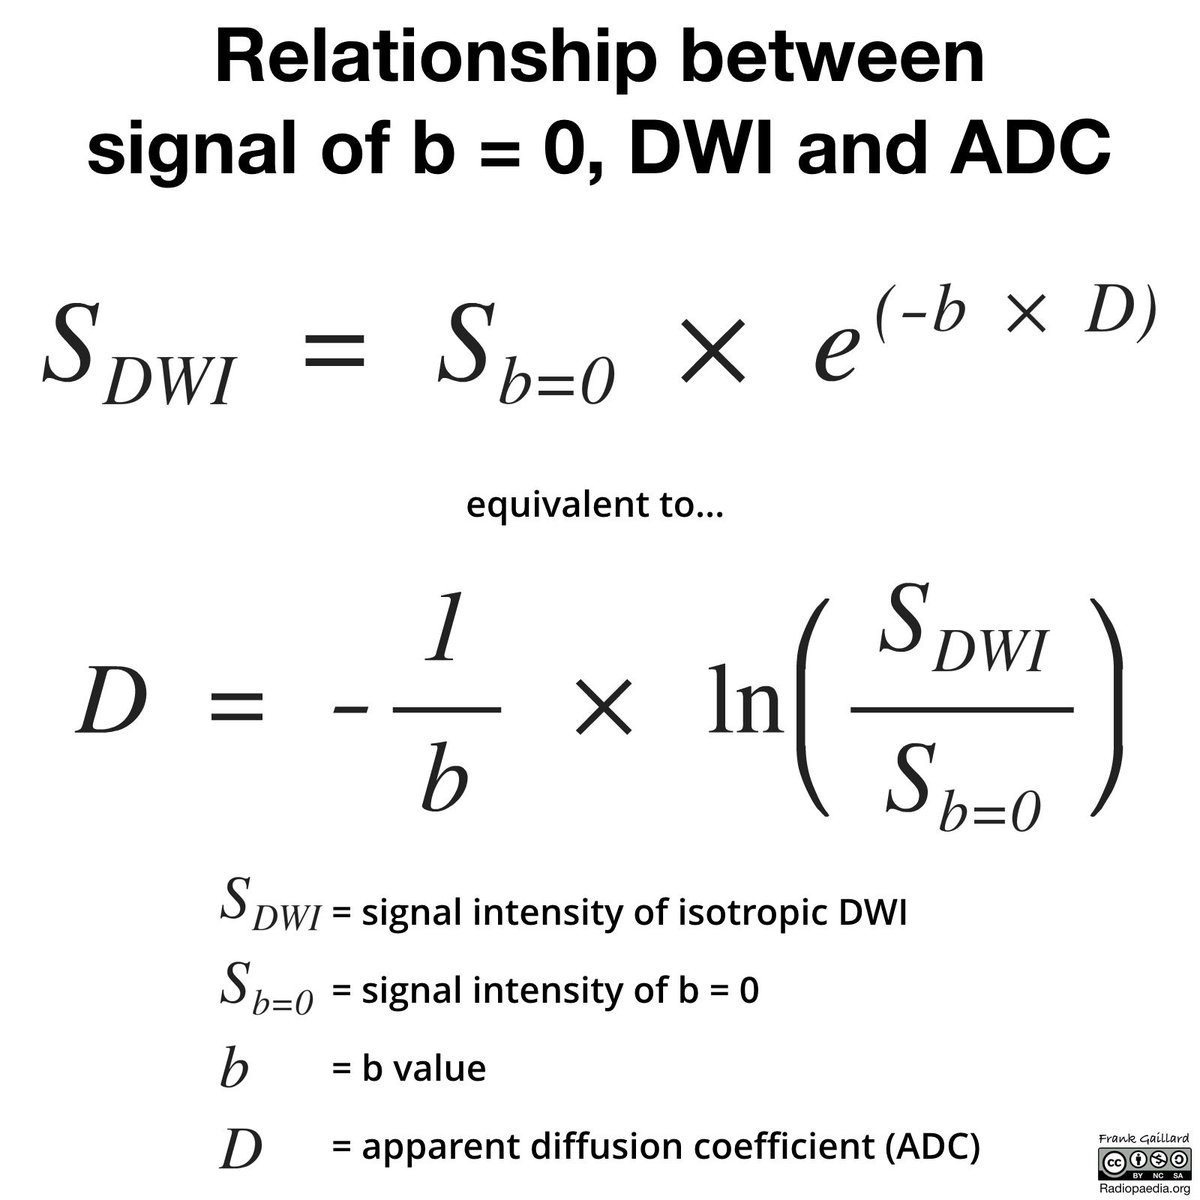
How do we get ADC values? Imagine that in a normal part of the brain, the first set of images give us a signal value of 10. The second set of images give us a VALUE OF 3. The ratio of the two is 0.3 and the negative logarithm of 0.3 is 0.5.
17/20
17/20
In a part of the brain with restricted diffusion, the first set of images give us a signal value of 10. The second set of images give us a VALUE OF 5 (Higher in restriction). The ratio of the two has a value of 0.5 (the negative logarithm of 0.5 is 0.3).
18/20
18/20
The ADC value is thus lower in restricted diffusion. This calculation isn& #39;t needed to interpret ADC maps! But to understand why ADC shows restricted diffusion as dark areas it is important to understand the ADC values are scaled to the negative logarithm of the ratio.
19/20
19/20
Did this tweetorial make sense to any of you? To know more about this, I heavily recommend watching @frankgaillard & #39;s video on DWI in radiopedia, reading from http://mriquestions.com/ ">https://mriquestions.com/">... and going through this free radiographics article https://pubs.rsna.org/doi/pdf/10.1148/rg.262055063
The">https://pubs.rsna.org/doi/pdf/1... end.
20/20
The">https://pubs.rsna.org/doi/pdf/1... end.
20/20

 Read on Twitter


