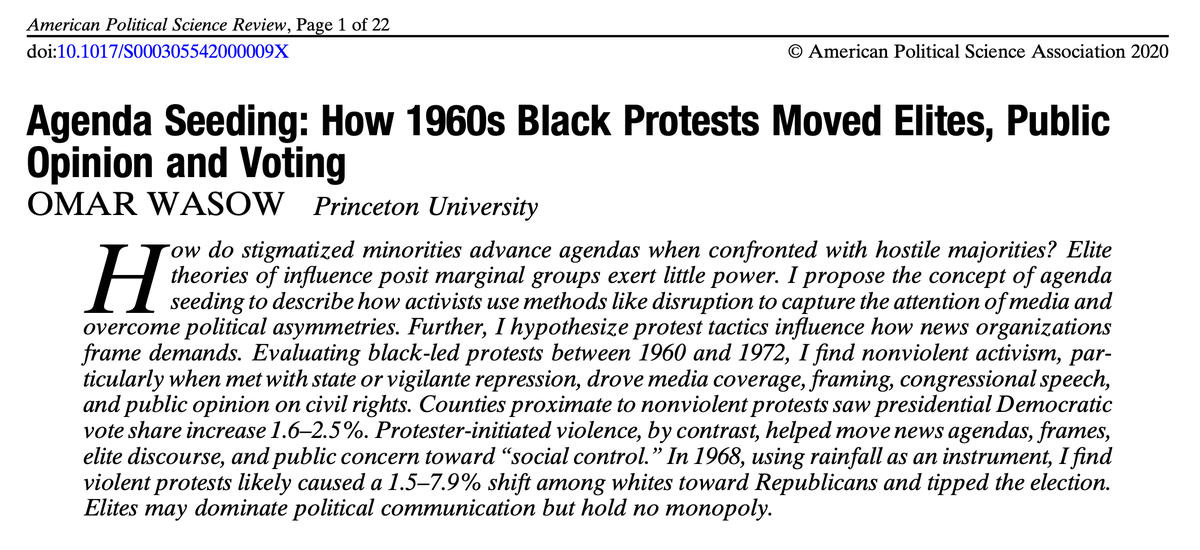
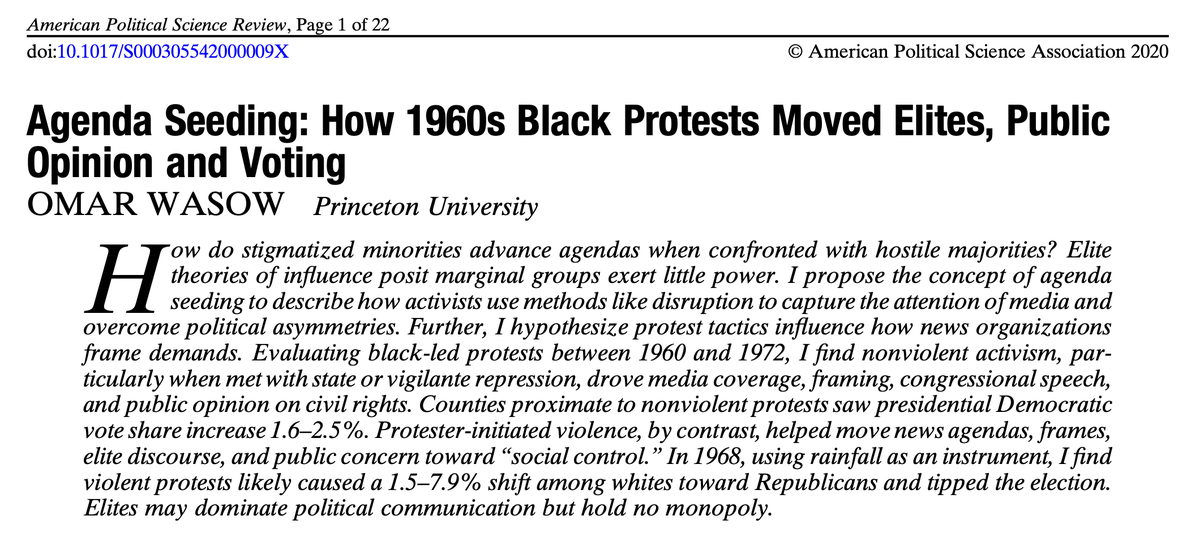
For 15 years, I’ve been studying 1960s civil rights protests with particular attention to how nonviolent and violent actions by activists & police influence media, elites, public opinion & voters. I& #39;m thrilled some of that work was published last week. 1/
https://www.cambridge.org/core/journals/american-political-science-review/article/agenda-seeding-how-1960s-black-protests-moved-elites-public-opinion-and-voting/136610C8C040C3D92F041BB2EFC3034C">https://www.cambridge.org/core/jour...
https://www.cambridge.org/core/journals/american-political-science-review/article/agenda-seeding-how-1960s-black-protests-moved-elites-public-opinion-and-voting/136610C8C040C3D92F041BB2EFC3034C">https://www.cambridge.org/core/jour...
These striking from photos from yesterday’s protests evoke some of the surprising lessons of 1960s. Consider the narrative these images construct for the larger public. How do these images fit our ideas of who is a “good guy” or who is a “bad guy”? 2/ https://twitter.com/StarTribune/status/1265458175530004481">https://twitter.com/StarTribu...
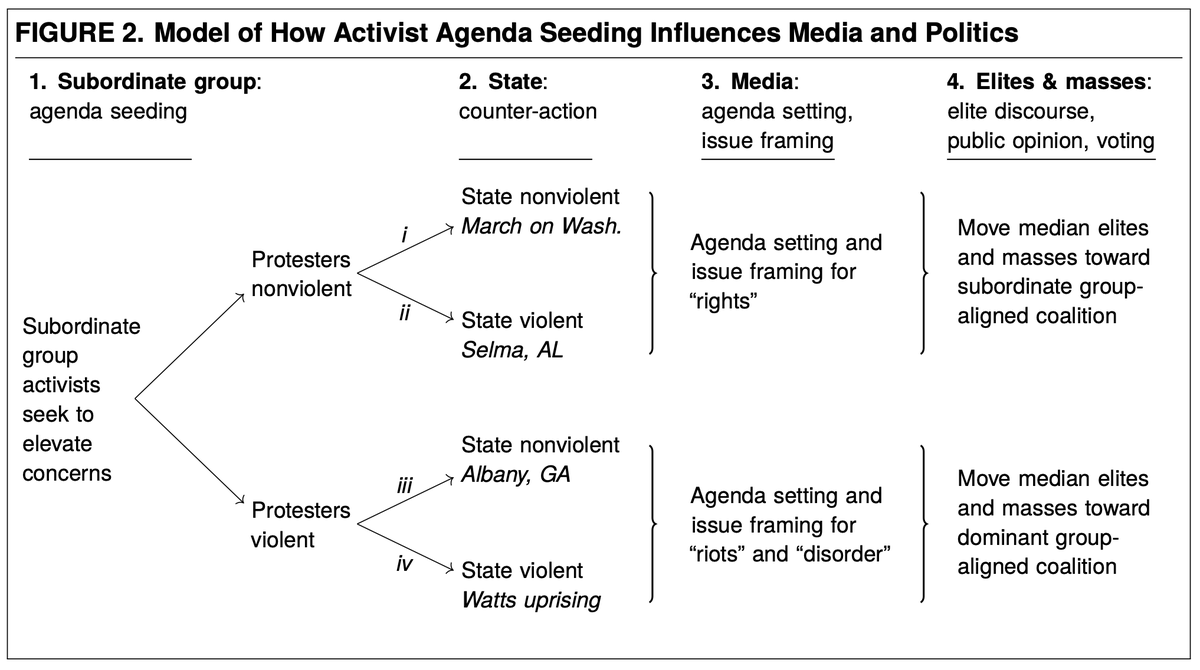
Now, imagine a simple model in which activists opt to engage in nonviolent or violent resistance and then the state responds with typical or excess force. (To be clear, the world is more complicated but these simplifying assumptions helps us describe some common patterns.) 3/
What was surprising was that while nonviolence could be an effective tactic, the best outcomes for the civil rights movement came when nonviolent protesters were met with brutal state repression that was broadcast around the world. See @repjohnlewis on Bloody Sunday in Selma. 4/
Events in which both protesters and the state are relatively peaceful could be effective. But, as one reporter noted about a nonviolent civil rights protest in Hattiesburg, MS, “…even an unprecedented picket line was a dull story. In such situations, blood and guts are news.” 5/
1960s activists understood this: “movement leaders & some segregationist leaders were studying the press: how it reacted, what made news & what did not. One thing was unambiguous: the greater the violence, the bigger the news, especially if it could be photographed or filmed.” 6/
I looked at @nytimes coverage of black-led protests in the 1960s and, consistent with what movement leaders intuited & scholars like @EricaChenoweth & Dan Gillion have shown, more violence was associated with more coverage, longer articles & articles closer to front page. 7/
So, violence by either side (or both) helped to generate more media but news coverage can portray a movement sympathetically or unsympathetically. This is where the combination of activist tactics and state response really matters. 8/
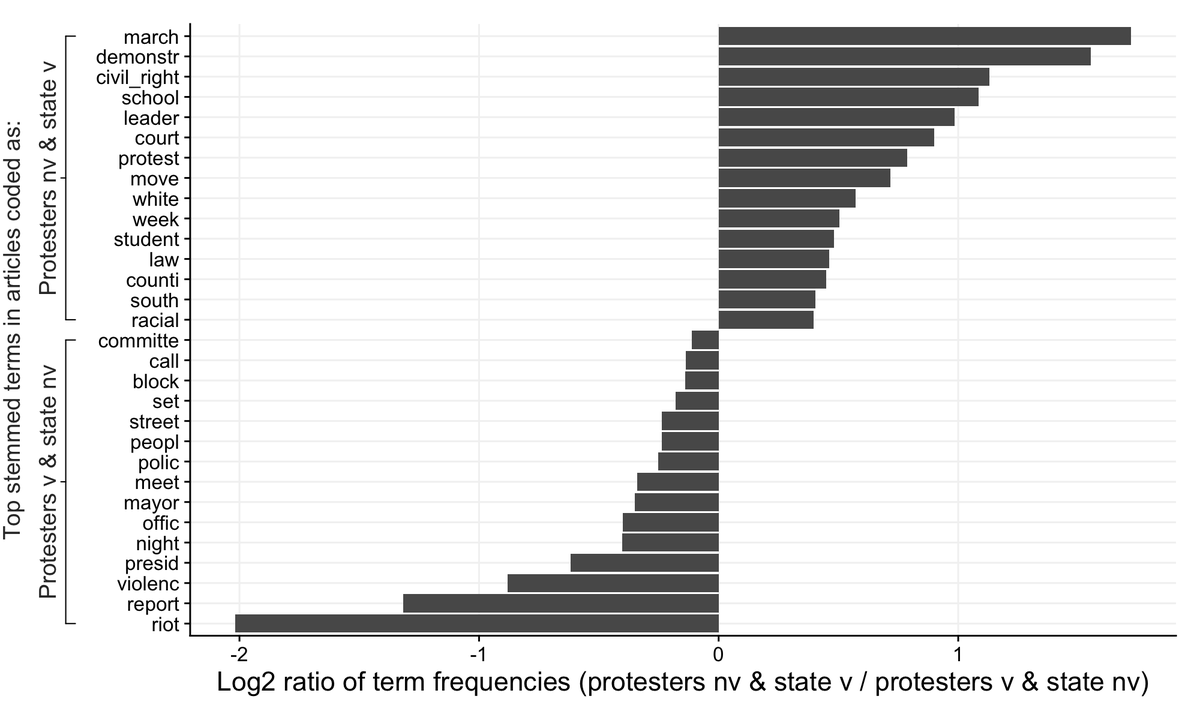
Comparing the most common terms used in thousands of news articles about 1960s civil rights protests, what I found was terms like march, demonstration & civil rights were used much more frequently when protesters were nonviolent and the state was violent (relative to reverse). 9/
When protesters initiated violence & the state was relatively restrained, however, terms like riot, violence & night were much more common. One example of this type occurred in Albany, GA where the Chief of Police used mass arrests while trying to minimize violent repression. 10/
In July 1962 an initially nonviolent protest escalated to include protester-initiated violence. The @nytimes ran a front page story about how a “crowd of 2,000 angry Negroes” had been dispersed after “[b]ricks, bottles & rocks were thrown towards more than 100 city policemen” 11/
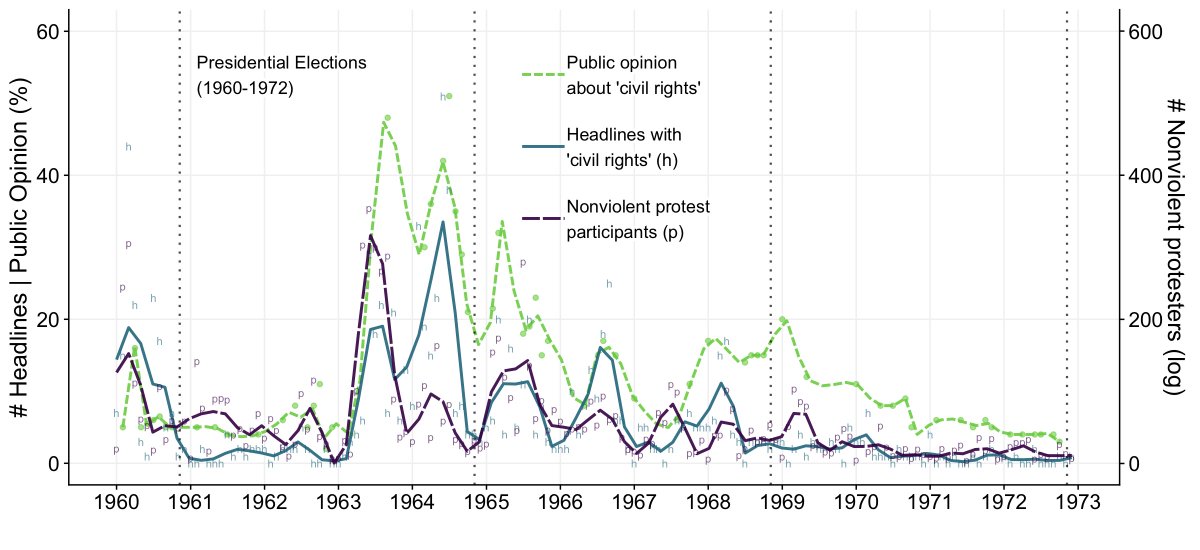
Of course, sympathetic press might not be enough to move a bigoted mass public. Did nonviolent civil rights protests shift media coverage *and* public opinion? To test this I compared trends in protest activity, front page headlines that mention civil rights & public opinion. 12/
The plot above shows as nonviolent protest activity increases, we see spikes in front page headlines that mention civil rights (and related terms like voting rights) and we also observe significantly more people respond the “most important problem” in America is civil rights. 13/
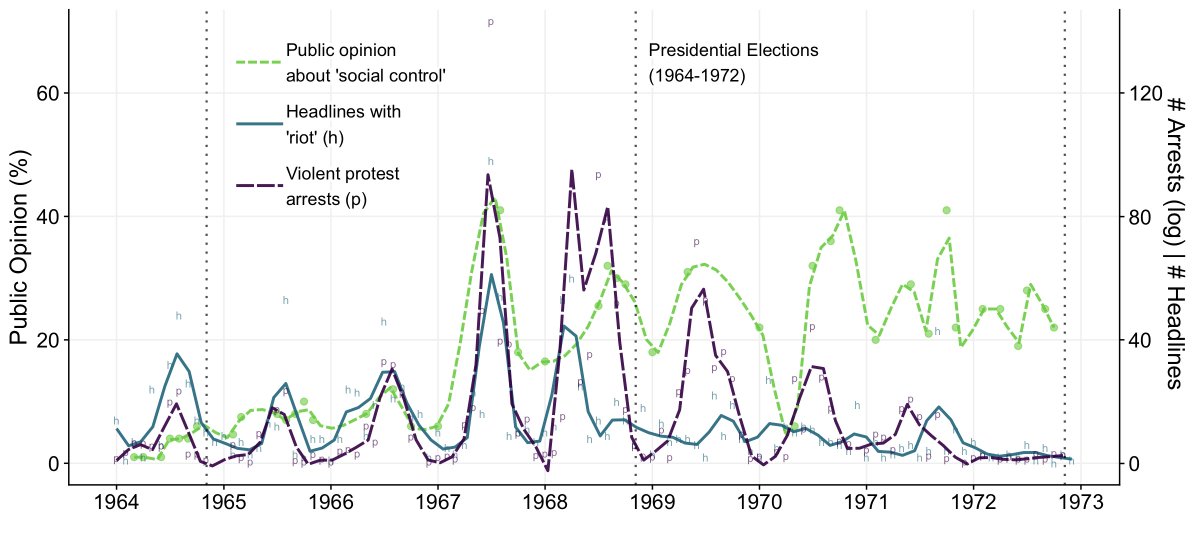
Similarly, with significant protester-initiated violence (whether or not the police are violent), we see increases in protest activity associated with headlines that mention “riots” and more people answer that the “most important problem” in America is crime and riots. 14/
The shifts in public opinion, also influenced voting. Running a variety of statistical tests on presidential elections from 1964 to 1972, I found counties close to nonviolent protests saw presidential Democratic vote share among whites increase 1.3-1.6%. /15
Protester-initiated violence (again, irrespective of police violence), helped move public towards concern for “social control.” In 1968, I find violent protests likely caused a 1.6-7.9% shift among whites towards Nixon’s “law & order” campaign and helped tipped the election. 16/
In sum, I find violent tactics by the state or protesters operate as a double-edged sword. State repression subjugates activists but focuses media attention on the concerns of nonviolent protesters. 17/
In contrast, violence by protesters can powerfully express discontent and offers a means of self-defense but, in the glare of mass media, is expected to strengthen the coalition of those looking to thwart minority demands. 18/
Returning to the protest photos from @CarlosGphoto, one unnerving but maybe encouraging lesson from the 1960s is that while state repression can result in injury & death, images of police SWAT teams vs images of fleeing children likely helps the movement seeking #JusticeForFloyd.
For the full analysis, below are links to the final paper and an ungated pre-print:
Final version: https://www.cambridge.org/core/journals/american-political-science-review/article/agenda-seeding-how-1960s-black-protests-moved-elites-public-opinion-and-voting/136610C8C040C3D92F041BB2EFC3034C
Ungated">https://www.cambridge.org/core/jour... pre-print: http://j.mp/agenda_seeding ">https://j.mp/agenda_se...
Finally, for a glimpse into the backstory of this research and some of what helped me persevere when times were tough, see this thread from last week. https://twitter.com/owasow/status/1263873855333888005">https://twitter.com/owasow/st...
Note: Nonviolent protest can work without repression, it’s just harder to generate media without drama. Big events like March on Washington or telegenic events like ACT-UP putting a giant condom over Jesse Helms’ home are examples of direct action generating sympathetic coverage.
Addendum: There have been some question about correlation vs causation in the estimated relationships btwn protests & voting. We obviously can’t randomly assign some counties to have protests so I try a variety of methods to approximate something like that with historical data.
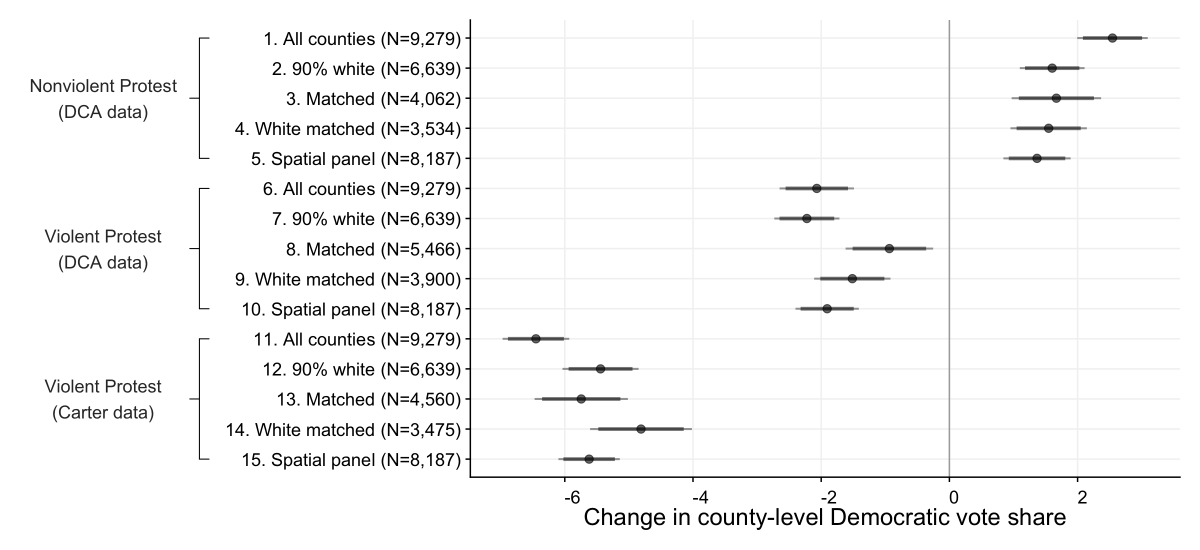
The figure above shows estimates from 15 statistical models. First, these are called fixed effect models. What’s powerful is that anything that doesn’t change much between 1964 & 1972, such as institutions or culture, is controlled for by comparing a county to itself.
Second, there are 3 different clusters & each cluster has 5 models:
— for all counties
— 90% white counties
— counties with matched “twins” that look very similar on variety of traits except one had protests
— 90% white matched counties
— spatial models accounting for “neighbors”
— for all counties
— 90% white counties
— counties with matched “twins” that look very similar on variety of traits except one had protests
— 90% white matched counties
— spatial models accounting for “neighbors”
To summarize, counties within 100 miles of a nonviolent protest in models 1-5 vote for the more egalitarian coalition. Conversely, for counties near violent protest activity, measured by participants 6-10 or arrests 11-15, we see voters shift toward the “law & order” coalition.
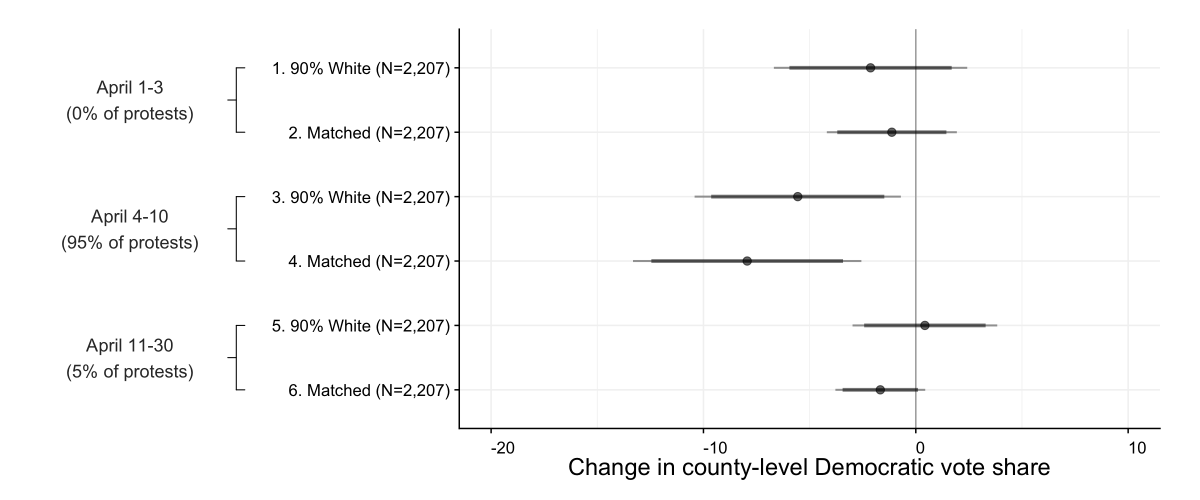
Further, to try and approximate random assignment of violent protests, I use rainfall in April of 1968. Why April? Martin Luther King, Jr is assassinated on April 4 & 137 violent protests follow his murder. Prior work shows rainfall predicts uprisings (↑ rain, ↓ protest).
I use rainfall in April to predict protests & then voting in 1968. The week before Apr 4, rainfall does not predict voting. In latter half of April, also no effect. Only in week following King& #39;s assassination (with 95% of protests) does rain in April predict voting in November.
Rainfall is acting like a coin toss, some counties got rainfall & others were dry. Without an alternate explanation for why rainfall in only one week in April predicts voting in November, the best explanation is violent protest *caused* some white voters to shift vote to Nixon.
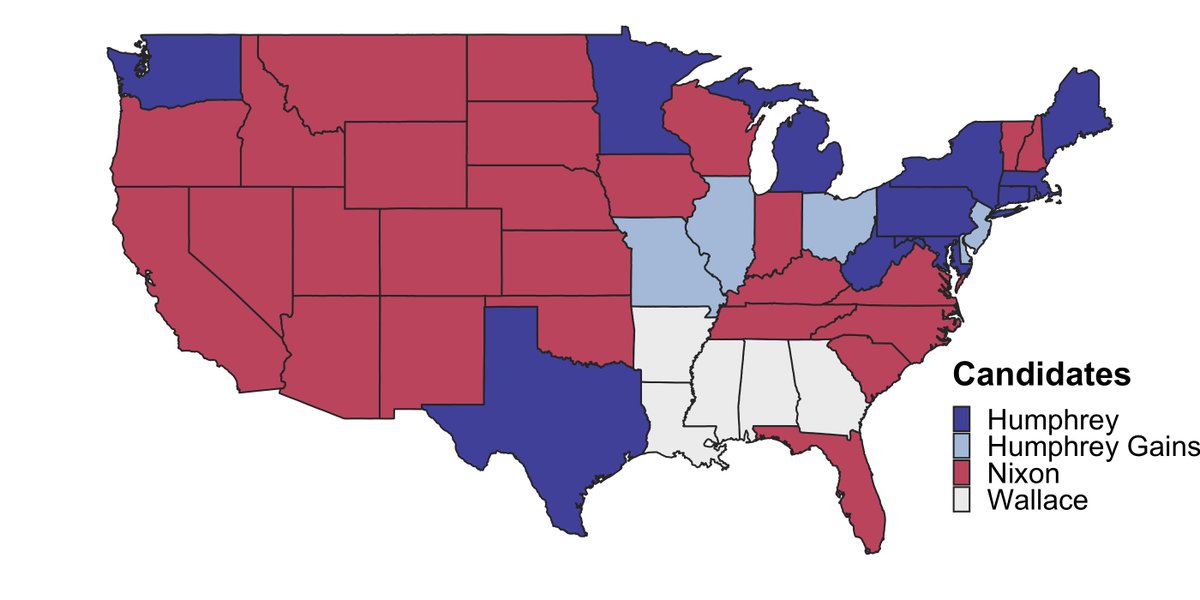
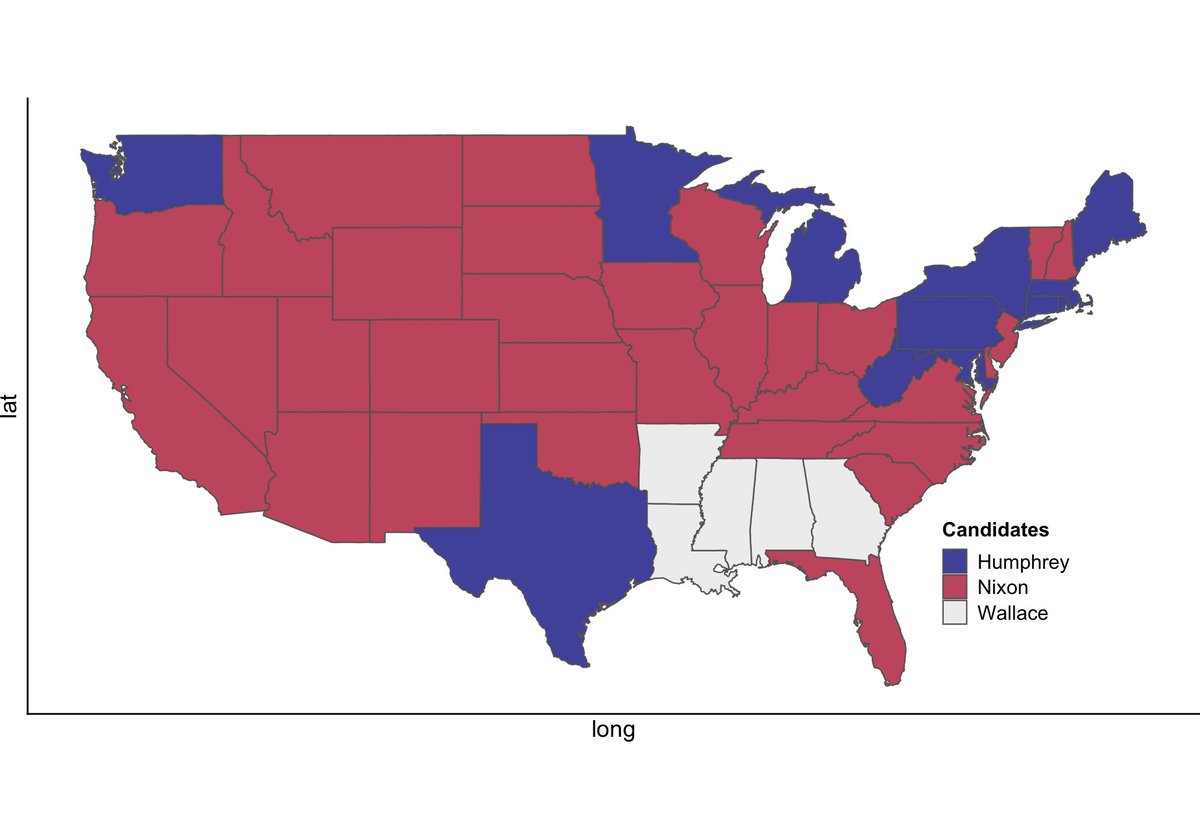
As we know, with the electoral college system, what matters is not individual voters or even counties but states. This is the actual electoral college map in 1968 that Nixon won. Note, George Wallace, an avowed segregationist, ran as a third party candidate.
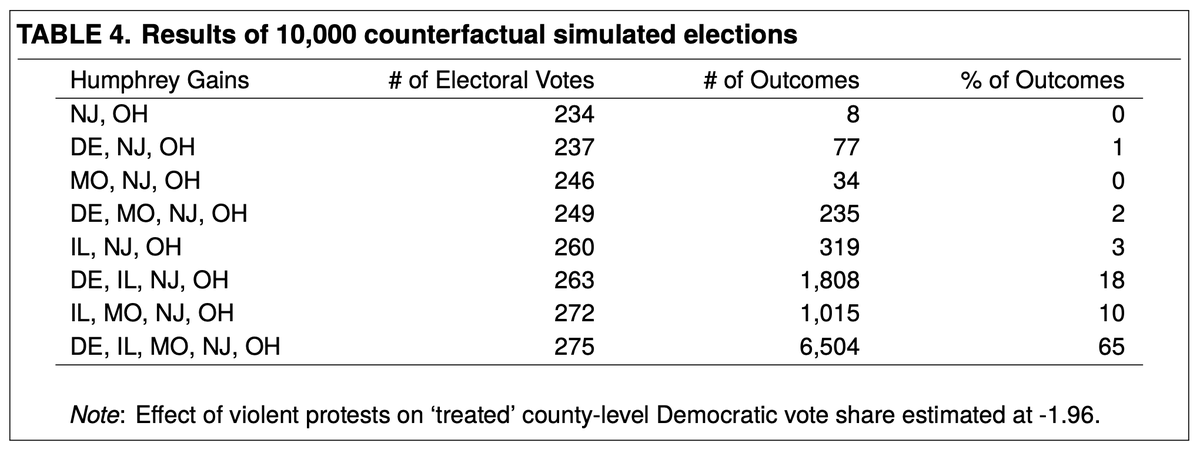
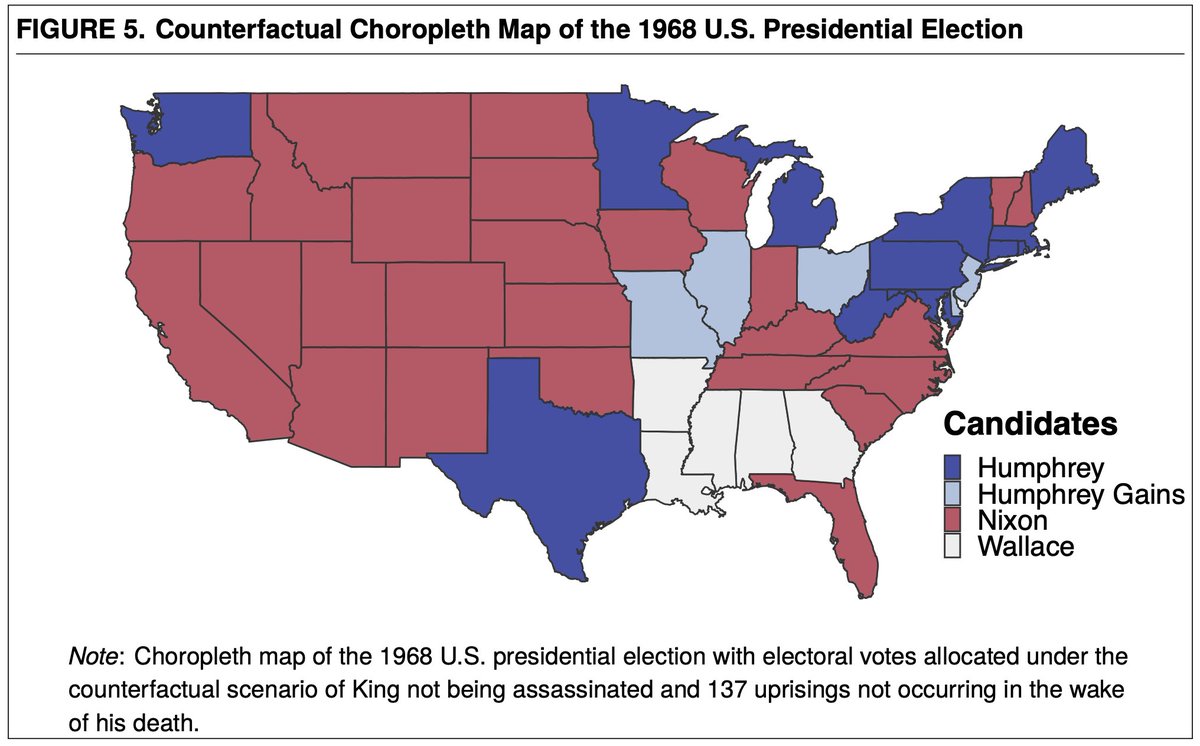
To estimate electoral effect of violent protest, I simulate a counterfactual election under the scenario that Dr King was not assassinated & 137 violent protests did not occur. Running 1968 election 10,000 times, Humphrey, lead author of Civil Rights Act, typically beats Nixon.
Nixon is often credited with winning in 1968 using a ”Southern Strategy.” In this counterfactual with no violent uprisings, however, Humphrey picks up Delaware, Illinois, Missouri, NJ & Ohio. In other words, Nixon won by appealing to white moderates in the Midwest & Mid-Atlantic.
In sum, using a wide range of statistical methods to try and compare “apples to apples,” I find proximity to nonviolent protest grew the coalition aligned with black interests and proximity to violent protest caused a meaningful number of whites to shift towards “law and order.”
Despite enormous barriers, black activists overcame structural biases, framed news, directed elite discourse, swayed public opinion & won at ballot box. An “eye for an eye” in response to violent repression may be moral & just but this research suggests it may not be strategic.

 Read on Twitter