
 Read on Twitter
In the last wk we have seen a staggering amt of new important CoV2 data
Update #7 w @EricMeyerowitz :
https://www.youtube.com/watch?v=x2Dufcjv4KQ&feature=youtu.be
01:05">https://www.youtube.com/watch... –ACTT-1
14:15 – Transmission
40:45 – Spectrum of clinical severity
1:04:21 – Immunity/vax
1:11:00 – Pandemic side effects
Key pts/slide deck https://abs.twimg.com/emoji/v2/... draggable="false" alt="👇" title="Down pointing backhand index" aria-label="Emoji: Down pointing backhand index"> https://www.youtube.com/watch...
Update #7 w @EricMeyerowitz :
https://www.youtube.com/watch?v=x2Dufcjv4KQ&feature=youtu.be
01:05">https://www.youtube.com/watch... –ACTT-1
14:15 – Transmission
40:45 – Spectrum of clinical severity
1:04:21 – Immunity/vax
1:11:00 – Pandemic side effects
Key pts/slide deck
We& #39;ll start with a detailed review of the Adaptive COVID-19 Treatment Trial - 1 (or ACTT-1) which was published on Friday May 22 in the NEJM
https://www.nejm.org/doi/full/10.1056/NEJMoa2007764">https://www.nejm.org/doi/full/...
 which was published on Friday May 22 in the NEJM https://www.nejm.org/doi/full/...")
https://www.nejm.org/doi/full/10.1056/NEJMoa2007764">https://www.nejm.org/doi/full/...
Here is a timeline of key events related to the trial

This is the ordinal scale that was used to define clinical status of each participant

The primary outcome was time to recovery defined as the first day where participant was in categories 1-3 on the ordinal scale. The original primary outcome is shown in blue

Change in primary outcome was made after it became recognized that some pts with severe COVID-19 have a protracted illness course. This is a summary of some of the early descriptive trials: little information was known about the illness course when the trial opened on Feb 21

These were the eligibility criteria

Important baseline characteristics shown here. Overall the groups were balanced. Slightly more remdesivir treated patients started in ordinal scale level 5 and slightly more placebo treated patients started in ordinal scale level 7

Here is a simplified version of Figure 1 showing trial enrollment and randomization scheme

This shows the Kaplan Meier curves for time to recovery. On the left you can see the overall curves and on the right the curves for those who started with baseline ordinal level of 5 where the recovery rate difference was most significant

This figure from the supplemental appendix shows the clinical improvement by day 15 on the ordinal scale stratified by baseline ordinal scale. Remdesivir was superior to placebo for this endpoint but the effect evaporates for higher baseline level

These are KM mortality curves. The 14-day mortality was 7.1% for RDV and 11.9% for placebo with hazard ratio for death of 0.7 with CI passing 1. On the rt, see the KM curve for baseline ordinal score of 5: mortality benefit in this subgroup with hazard ratio for mortality of 0.22

The mortality effect is clearly not seen in subgroups with baseline ordinal scale of 6 or 7

This is the important Table 2 summarizing key results. In red is the primary outcome and in blue is the key secondary outcome (that was the original primary outcome)
")
From the supplementary appendix, placebo arm had numerically more adverse events. LFT abnormalities more common in placebo treated group: perhaps due to more placebo patients starting in ordinal level 7 or not getting remdesivir and worse covid?

Summary of key findings from ACTT-1. This is a remarkable trial and a truly heroic effort

This next section is on transmission heterogeneity, an area with a lot of interesting research right now from many different angles.

Important report from IDM this week, these figures illustrating how distribution of # of secondary infections changes with overdispersion (i.e. variance >> mean). W more overdispersion, super spreading events have greater importance.
https://covid.idmod.org/data/Stochasticity_heterogeneity_transmission_dynamics_SARS-CoV-2.pdf">https://covid.idmod.org/data/Stoc...
. W more overdispersion, super spreading events have greater importance. https://covid.idmod.org/data/Stoc...")
https://covid.idmod.org/data/Stochasticity_heterogeneity_transmission_dynamics_SARS-CoV-2.pdf">https://covid.idmod.org/data/Stoc...
To start, this was a modeling pre-print in April that suggested substantial overdispersion for CoV2, with ~10% of cases leading to 80% of secondary transmissions.
https://doi.org/10.12688/wellcomeopenres.15842.1">https://doi.org/10.12688/...

https://doi.org/10.12688/wellcomeopenres.15842.1">https://doi.org/10.12688/...
It seems like every day we are seeing new cluster investigations suspicious for super-spreading events. Wedding, choir, church, call center. 3 of these were published in the last wk
https://doi.org/10.3201/eid2609.201469
https://doi.org/10.3201/e... href=" http://dx.doi.org/10.15585/mmwr.mm6920e2
https://dx.doi.org/10.15585/... href=" http://dx.doi.org/10.15585/mmwr.mm6919e6
https://dx.doi.org/10.15585/... href=" https://doi.org/10.3201/eid2608.201274">https://doi.org/10.3201/e...

https://doi.org/10.3201/eid2609.201469
Along these lines, this is an unbelievably detailed hospital outbreak investigation from South Africa, again pointing towards the importance of super spreading events. 39 patients and 80 staff members infected. 15 patients died
https://www.krisp.org.za/news.php?id=421 ">https://www.krisp.org.za/news.php...

https://www.krisp.org.za/news.php?id=421 ">https://www.krisp.org.za/news.php...
They built a detailed timeline of the patients and where they were located (colors on the figure). They highlighted that patients were moved from ward to ward frequently
https://www.krisp.org.za/news.php?id=421 ">https://www.krisp.org.za/news.php...
. They highlighted that patients were moved from ward to ward frequently https://www.krisp.org.za/news.php...")
https://www.krisp.org.za/news.php?id=421 ">https://www.krisp.org.za/news.php...
They used this timeline to show migrating chains of infection from one ward to the next, and also involvement of two outside facilities – a nursing home and a dialysis unit.
https://www.krisp.org.za/news.php?id=421 ">https://www.krisp.org.za/news.php...

https://www.krisp.org.za/news.php?id=421 ">https://www.krisp.org.za/news.php...
They hypothesized that CoV2 was introduced when a patient with respiratory complaints was put in a room across from the first hospitalized patient to be diagnosed. The detail in this report is incredible.
https://www.krisp.org.za/news.php?id=421 ">https://www.krisp.org.za/news.php...

https://www.krisp.org.za/news.php?id=421 ">https://www.krisp.org.za/news.php...
They then went through each ward, mapping out the transmission chains during that time period. You can see the highlighted beds where the people eventually diagnosed were. One across from the first patient, and 4 together in another room.
https://www.krisp.org.za/news.php?id=421 ">https://www.krisp.org.za/news.php...

https://www.krisp.org.za/news.php?id=421 ">https://www.krisp.org.za/news.php...
They repeated this analysis in the other wards. The authors postulate substantial indirect contact transmission bc of distance bw patients within the wards, but Im not sure it wasnt moreso a/symptomatic HCWs given high prevalence of HCW infection
https://www.krisp.org.za/news.php?id=421 ">https://www.krisp.org.za/news.php...

https://www.krisp.org.za/news.php?id=421 ">https://www.krisp.org.za/news.php...
Strong correlation bw HCW infection and working in wards with active transmission. Interestingly, no infections in COVID-specific units, suggesting PPE works!!

Phylogenetic analysis of 18 sequences from the outbreak finds >99.99% identical sequences, indicating closely related series of transmission chains.
https://www.krisp.org.za/news.php?id=421 ">https://www.krisp.org.za/news.php...

https://www.krisp.org.za/news.php?id=421 ">https://www.krisp.org.za/news.php...
Side bar: two nice studies in JAMA open this week with additional (indirect) evidence that PPE works
https://doi.org/10.1001/jamanetworkopen.2020.9673
https://doi.org/10.1001/j... href=" https://doi.org/10.1001/jamanetworkopen.2020.9666">https://doi.org/10.1001/j...
https://doi.org/10.1001/jamanetworkopen.2020.9673
 https://doi.org/10.1001/j..." title="Side bar: two nice studies in JAMA open this week with additional (indirect) evidence that PPE works https://doi.org/10.1001/j... href=" https://doi.org/10.1001/jamanetworkopen.2020.9666">https://doi.org/10.1001/j..." class="img-responsive" style="max-width:100%;"/>
Back to transmission heterogeneity. Nice new pre-print of all infection clusters in Hong Kong suggesting ~20% of infections caused ~80% of secondary infections. One “bar and band” cluster accounted for 30% of all locally acquired cases
https://doi.org/10.21203/rs.3.rs-29548/v1">https://doi.org/10.21203/...

https://doi.org/10.21203/rs.3.rs-29548/v1">https://doi.org/10.21203/...
And another new pre-print with a new method showing evidence for transmission heterogeneity – phylodynamic modeling in Israel.
https://doi.org/10.1101/2020.05.21.20104521">https://doi.org/10.1101/2...

https://doi.org/10.1101/2020.05.21.20104521">https://doi.org/10.1101/2...
Back to the IDM report. These are four major implications of an infectious disease displaying overdispersion.
https://covid.idmod.org/data/Stochasticity_heterogeneity_transmission_dynamics_SARS-CoV-2.pdf">https://covid.idmod.org/data/Stoc...

https://covid.idmod.org/data/Stochasticity_heterogeneity_transmission_dynamics_SARS-CoV-2.pdf">https://covid.idmod.org/data/Stoc...
They go on to describe the underlying mechanisms of super-spreading events, and the important impact of “cutting the tail” of high # secondary transmissions when infectious diseases displays overdispersion.

One important aspect is going to be understanding characteristics of clusters to minimize super spreading events. This group did a systematic review and is now maintaining a cluster database.
https://doi.org/10.12688/wellcomeopenres.15889.1">https://doi.org/10.12688/...

https://doi.org/10.12688/wellcomeopenres.15889.1">https://doi.org/10.12688/...
Moving on from transmission heterogeneity, here are some other transmission updates.

This report from the Korean CDC has important implications for clearing transmission-based precautions:
https://twitter.com/AaronRichterman/status/1262726787559292934?s=20">https://twitter.com/AaronRich...

https://twitter.com/AaronRichterman/status/1262726787559292934?s=20">https://twitter.com/AaronRich...
Another paper showing no culturable virus after day 8 after symptom onset, and this one raised the possibility of using cycle threshold as an estimate of infectiousness.
https://doi.org/10.1093/cid/ciaa638">https://doi.org/10.1093/c...

https://doi.org/10.1093/cid/ciaa638">https://doi.org/10.1093/c...
Summary slide of reasons not to use the PCR test after COVID19 diagnosis has been established

Key points for transmission 5/19-5/26

Let& #39;s shift gears to discuss theories for illness severity spectrum seen in COVID-19

There is marked heterogeneity in presentation: truly asymptomatic to mild viral illness to severe disease and critical illness
https://jamanetwork.com/journals/jama/fullarticle/2762130">https://jamanetwork.com/journals/...

https://jamanetwork.com/journals/jama/fullarticle/2762130">https://jamanetwork.com/journals/...
Multiple theories attempt to explain this spectrum. In general there are theories that focus on host factors, those that consider societal factors and those that consider viral factors.

These are the host and societal factors we will consider

We spent a lot of time in early updates looking at co-morbidities associated with severe disease. This recent study of large hospitalized UK cohort confirmed many of the findings from earlier studies
https://doi.org/10.1136/bmj.m1985">https://doi.org/10.1136/b...

https://doi.org/10.1136/bmj.m1985">https://doi.org/10.1136/b...
A large study out of NYC found similar findings. This is their competing risk model for mortality.
https://doi.org/10.1136/bmj.m1966">https://doi.org/10.1136/b...

https://doi.org/10.1136/bmj.m1966">https://doi.org/10.1136/b...
Racism, poverty & structural factors are associated with worse outcomes. These are some of the papers we& #39;ve reviewed in the past

Here is an updated risk factor table

Differential ACE2 expression may explain disease severity spectrum. A recent study showed age related ACE2 expression in the nasal epithelium (lt) and another showed estrogen treatment of cell lines led to https://abs.twimg.com/emoji/v2/... draggable="false" alt="👇" title="Down pointing backhand index" aria-label="Emoji: Down pointing backhand index"> ACE2 expression (rt)
https://jamanetwork.com/journals/jama/fullarticle/2766524
https://jamanetwork.com/journals/... href=" https://journals.physiology.org/doi/abs/10.1152/ajplung.00153.2020">https://journals.physiology.org/doi/abs/1...
https://jamanetwork.com/journals/jama/fullarticle/2766524
 ACE2 expression (rt) https://jamanetwork.com/journals/... href=" https://journals.physiology.org/doi/abs/10.1152/ajplung.00153.2020">https://journals.physiology.org/doi/abs/1..." title="Differential ACE2 expression may explain disease severity spectrum. A recent study showed age related ACE2 expression in the nasal epithelium (lt) and another showed estrogen treatment of cell lines led to https://abs.twimg.com/emoji/v2/... draggable="false" alt="👇" title="Down pointing backhand index" aria-label="Emoji: Down pointing backhand index"> ACE2 expression (rt) https://jamanetwork.com/journals/... href=" https://journals.physiology.org/doi/abs/10.1152/ajplung.00153.2020">https://journals.physiology.org/doi/abs/1..." class="img-responsive" style="max-width:100%;"/>
HLA types are impt for antigen presentation and key to adaptive immune response. This modeling study predicted how well different HLA types would present CoV2 epitopes. They predict HLA B4602 will do poorly and this allele was associated with severe SARS
https://jvi.asm.org/content/early/2020/04/16/JVI.00510-20">https://jvi.asm.org/content/e...

https://jvi.asm.org/content/early/2020/04/16/JVI.00510-20">https://jvi.asm.org/content/e...
This interesting study found blood group A overrepresented and blood group O underrepresented among hospitalized patients with COVID-19 compared to the general population
https://doi.org/10.1111/bjh.16797">https://doi.org/10.1111/b...

https://doi.org/10.1111/bjh.16797">https://doi.org/10.1111/b...
Baseline cross immunity possibly to the common human coronaviruses may explain differential severity. These are 2 important studies we& #39;ve discussed in past updates that show a certain percentage of healthy donors have reactive T cells to SARS-CoV-2 proteins

Viral factors may also affect disease severity

As virus replicates, it mutates. Mutations accumulate and regional differences can arise. Need to separate "founder effect" from selective advantage

This provocative preprint discusses increasing frequency of D614G viral lineage. They hypothesize why this might have a selective advantage, but critics say they have not taken into account founder effect
https://doi.org/10.1101/2020.04.29.069054">https://doi.org/10.1101/2...

https://doi.org/10.1101/2020.04.29.069054">https://doi.org/10.1101/2...
In this analysis, authors compare clinical markers in patients with 2 different clades in a cohort in Shanghai: they find no differences in disease severity between the groups
https://doi.org/10.1038/s41586-020-2355-0">https://doi.org/10.1038/s...

https://doi.org/10.1038/s41586-020-2355-0">https://doi.org/10.1038/s...
In a fascinating preprint, authors identify 3 key clades among their population and find overall clade 1 viruses have higher viral loads (lower ct) than clade 2. Clade 1 is more widespread and wonder whether maybe because higher vl = more transmissible https://doi.org/10.1101/2020.05.19.20107144">https://doi.org/10.1101/2...
Little is known about importance of inoculum and route in disease severity. In this preprint macaques inoculated by conjunctival route had less severe pulmonary disease than those by intratracheal route
https://doi.org/10.1101/2020.03.13.990036">https://doi.org/10.1101/2...

https://doi.org/10.1101/2020.03.13.990036">https://doi.org/10.1101/2...
Key points on theories for differential severity shown here

There have been 3 incredibly important immunity and vaccine papers published in the last week

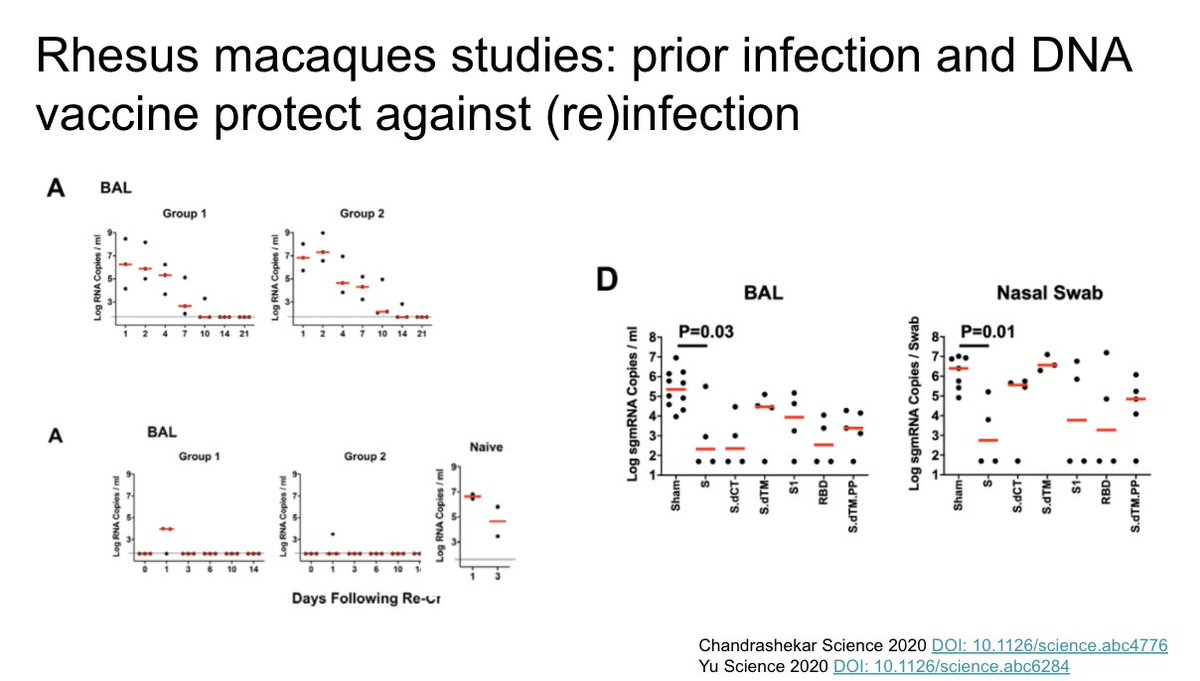
Studies published in Science in rhesus macaques show evidence of immunity to reinfection as well as protection after inoculation with DNA vaccine product
https://science.sciencemag.org/content/early/2020/05/19/science.abc4776
https://science.sciencemag.org/content/e... href=" https://science.sciencemag.org/content/early/2020/05/19/science.abc6284">https://science.sciencemag.org/content/e...
https://science.sciencemag.org/content/early/2020/05/19/science.abc4776
 https://science.sciencemag.org/content/e..." title="Studies published in Science in rhesus macaques show evidence of immunity to reinfection as well as protection after inoculation with DNA vaccine product https://science.sciencemag.org/content/e... href=" https://science.sciencemag.org/content/early/2020/05/19/science.abc6284">https://science.sciencemag.org/content/e..." class="img-responsive" style="max-width:100%;"/>
In an important paper in The Lancet, authors from China show the first published human data for a SARS-CoV-2 vaccine. This is an adenovirus vector vaccine. They measure strong adaptive immune responses, but less in those with baseline adeno antibodies.
https://doi.org/10.1016/S0140-6736(20)31208-3">https://doi.org/10.1016/S...

https://doi.org/10.1016/S0140-6736(20)31208-3">https://doi.org/10.1016/S...
Next up, side effects of the pandemic

In April, this group in Italy showed increases in out of hospital cardiac arrests, with less bystander CPR, and higher mortality in the field.
https://doi.org/10.1056/NEJMc2010418">https://doi.org/10.1056/N...

https://doi.org/10.1056/NEJMc2010418">https://doi.org/10.1056/N...
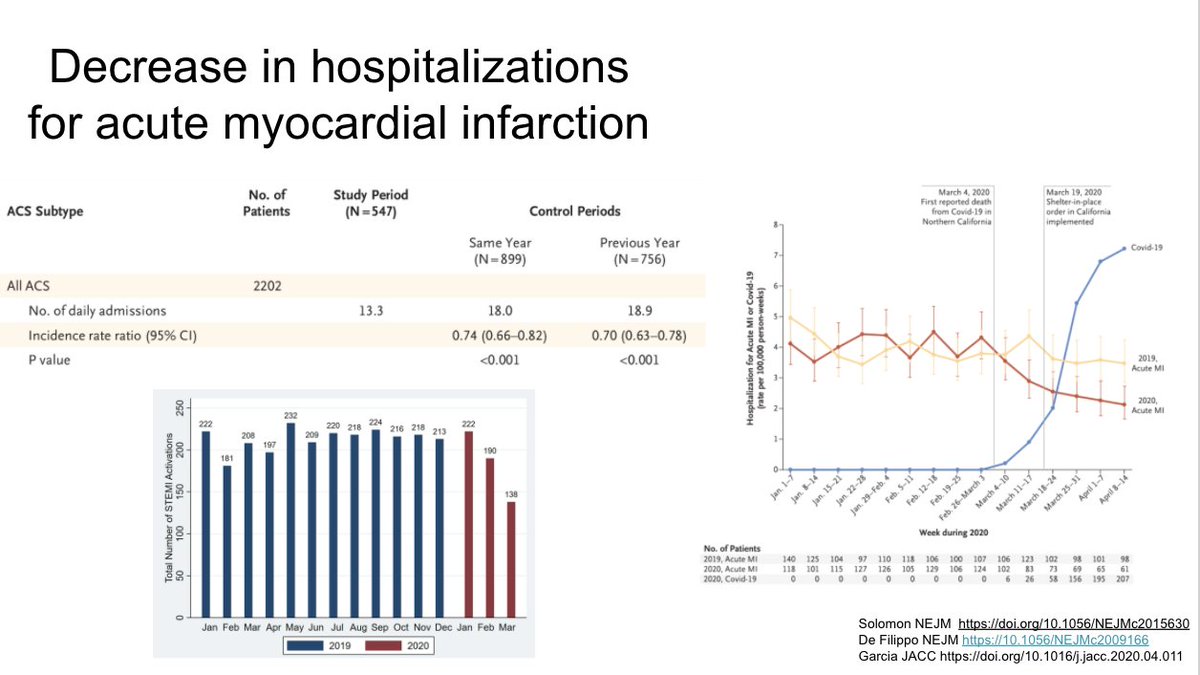
As one potential cause of this, these papers suggest reduced hospitalizations for STEMI and NSTEMI, probably because people are avoiding care.
https://doi.org/10.1056/NEJMc2015630
https://10.1056/NEJMc2009166
https://doi.org/10.1056/N... href=" https://doi.org/10.1016/j.jacc.2020.04.011">https://doi.org/10.1016/j...
https://doi.org/10.1056/NEJMc2015630
https://10.1056/NEJMc2009166
 https://doi.org/10.1016/j..." title="As one potential cause of this, these papers suggest reduced hospitalizations for STEMI and NSTEMI, probably because people are avoiding care. https://doi.org/10.1056/N... href=" https://doi.org/10.1016/j.jacc.2020.04.011">https://doi.org/10.1016/j..." class="img-responsive" style="max-width:100%;"/>
Interesting analysis using an imaging database to suggest stroke evaluations also decreasing during the pandemic
https://doi.org/10.1056/NEJMc2014816">https://doi.org/10.1056/N...

https://doi.org/10.1056/NEJMc2014816">https://doi.org/10.1056/N...
MMWR report finding decreases in childhood vaccination coverage. Most concerning is dip in measles, which (as we’ve seen) can cause outbreaks even with relatively small decreases in vaccine coverage
http://dx.doi.org/10.15585/mmwr.mm6920e1">https://dx.doi.org/10.15585/...
 can cause outbreaks even with relatively small decreases in vaccine coverage https://dx.doi.org/10.15585/...")
http://dx.doi.org/10.15585/mmwr.mm6920e1">https://dx.doi.org/10.15585/...
Unsurprisingly, routine cancer screening has declined as well.Because of the nature of these screenings impact should be small if we can catch up in the near to mid term
https://ehrn.org/wp-content/uploads/Preventive-Cancer-Screenings-during-COVID-19-Pandemic.pdf">https://ehrn.org/wp-conten...

https://ehrn.org/wp-content/uploads/Preventive-Cancer-Screenings-during-COVID-19-Pandemic.pdf">https://ehrn.org/wp-conten...
A population survey in Vermont found striking increases in food insecurity during the early pandemic. Consequences are likely to be large.
https://doi.org/10.1101/2020.05.09.20096412">https://doi.org/10.1101/2...

https://doi.org/10.1101/2020.05.09.20096412">https://doi.org/10.1101/2...
As one silver lining, this analysis suggests CO2 emissions have decreased to 2006 levels, interesting analysis by sector. They predict year-long decreases in emissions varying based on how much confinement is lifted.
https://doi.org/10.1038/s41558-020-0797-x">https://doi.org/10.1038/s...

https://doi.org/10.1038/s41558-020-0797-x">https://doi.org/10.1038/s...
Key points for side effects of the pandemic

Summary of 5/19 – 5/26

Yes thank you @EricMeyerowitz this is actually #6 not 7 https://abs.twimg.com/emoji/v2/... draggable="false" alt="😂" title="Face with tears of joy" aria-label="Emoji: Face with tears of joy">https://abs.twimg.com/emoji/v2/... draggable="false" alt="🙏" title="Folded hands" aria-label="Emoji: Folded hands">
Slide deck: https://docs.google.com/presentation/d/1u0hXmBaFwhE1E84cE9nUizLXOrNZJfZU54mdl7I93Ek/edit">https://docs.google.com/presentat...
Slide deck: https://docs.google.com/presentation/d/1u0hXmBaFwhE1E84cE9nUizLXOrNZJfZU54mdl7I93Ek/edit">https://docs.google.com/presentat...


