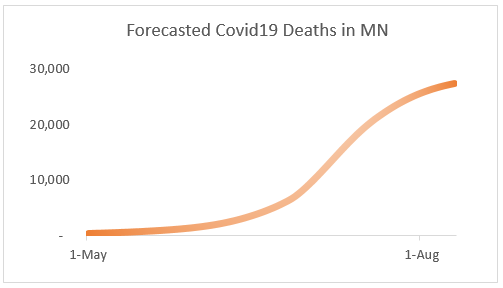
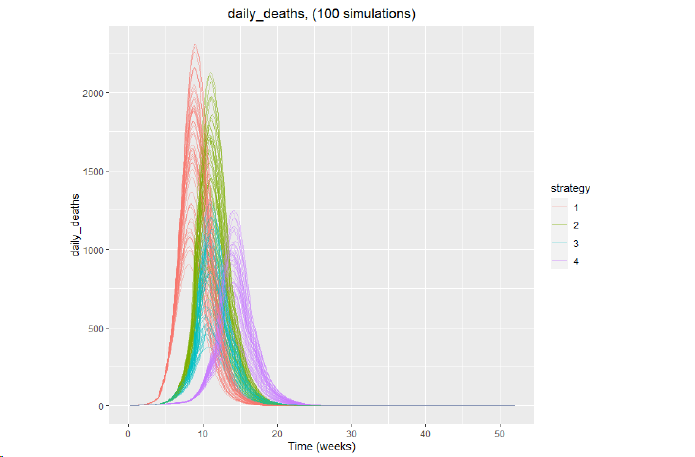
The Minnesota covid model #MNmodel forecasts 29,000 deaths.
What’s causing these high estimates?
Click HERE… for a DEEP DIVE THREAD that explains it.
What’s causing these high estimates?
Click HERE… for a DEEP DIVE THREAD that explains it.
1/ After reviewing code & underlying data for the #MNmodel v3, this thread offers salient points & explains what drives higher estimates.
It& #39;s a deep and detailed look into parts of the SEIR model. I’ll provide facts & evidence throughout. Long thread, so grab a cup of coffee…
It& #39;s a deep and detailed look into parts of the SEIR model. I’ll provide facts & evidence throughout. Long thread, so grab a cup of coffee…
2/ Points to keep in mind throughout:
> Data is scarce, and science is trying to keep up
> The modelers openly disclose that there are limitations; we cannot expect precision
> Given all the uncertainty, to be fair, there are valid arguments on many fronts
Now the details...
> Data is scarce, and science is trying to keep up
> The modelers openly disclose that there are limitations; we cannot expect precision
> Given all the uncertainty, to be fair, there are valid arguments on many fronts
Now the details...
3/ A. Contact matrix.
The #MNmodel uses mathematics to drive all infections. Essentially they take the whole MN population, break it up into 9 age groups, and apply a probability of each person in each age group contacting someone who is infected in every age group.
The #MNmodel uses mathematics to drive all infections. Essentially they take the whole MN population, break it up into 9 age groups, and apply a probability of each person in each age group contacting someone who is infected in every age group.
4/ It’s a population “mixing” algorithm.
So, how do they figure out who will be contacting who? They use a 2008 study from Europe that is mathematically adjusted to the future and to 144 other countries. https://journals.plos.org/ploscompbiol/article?id=10.1371/journal.pcbi.1005697">https://journals.plos.org/ploscompb...
So, how do they figure out who will be contacting who? They use a 2008 study from Europe that is mathematically adjusted to the future and to 144 other countries. https://journals.plos.org/ploscompbiol/article?id=10.1371/journal.pcbi.1005697">https://journals.plos.org/ploscompb...
5/ Anyone who has been to Europe knows they have a much more social culture. And, compared to 12 yrs ago, the technologies now (texting, snapchat, skype, zoom, etc) have significantly changed interaction patterns. Adjusting for these differences is tremendously difficult.
6/ B. Susceptibility.
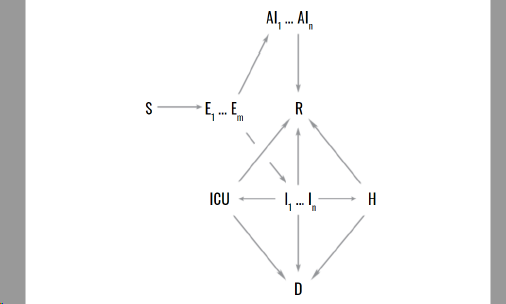
Beyond the contact matrix, the #MNmodel is fairly simplistic in its S to E to I structure. Through the contact matrix, it essentially moves everyone in MN from susceptible to exposed to either infected with symptoms or without symptoms.
Beyond the contact matrix, the #MNmodel is fairly simplistic in its S to E to I structure. Through the contact matrix, it essentially moves everyone in MN from susceptible to exposed to either infected with symptoms or without symptoms.
7/ It doesn’t take into account the possibility that some groups may be more vulnerable to infection. The #MNmodel treats a 14 year-old healthy teenager & a 90 year-old in a nursing home as equally susceptible to becoming infected.
8/ It also doesn’t factor in any possible seasonality. Slower transmission in warmer, humid climates has already been observed. The #MNmodel predicts a remarkably steep peak in the pandemic during the summer’s peak of heat and humidity.
https://www.cbsnews.com/news/transcript-scott-gottlieb-discusses-coronavirus-on-face-the-nation-may-24-2020/">https://www.cbsnews.com/news/tran...
https://www.cbsnews.com/news/transcript-scott-gottlieb-discusses-coronavirus-on-face-the-nation-may-24-2020/">https://www.cbsnews.com/news/tran...
9/ C. Infected.
Most of us have heard about this concept of “herd immunity.” Experts believe that between 60% and 70% of the population will need to be infected before the covid19 virus “runs out” of possible human targets. https://wccoradio.radio.com/articles/dr-michael-osterholm-details-where-minnesota-is-at-with-the">https://wccoradio.radio.com/articles/...
Most of us have heard about this concept of “herd immunity.” Experts believe that between 60% and 70% of the population will need to be infected before the covid19 virus “runs out” of possible human targets. https://wccoradio.radio.com/articles/dr-michael-osterholm-details-where-minnesota-is-at-with-the">https://wccoradio.radio.com/articles/...
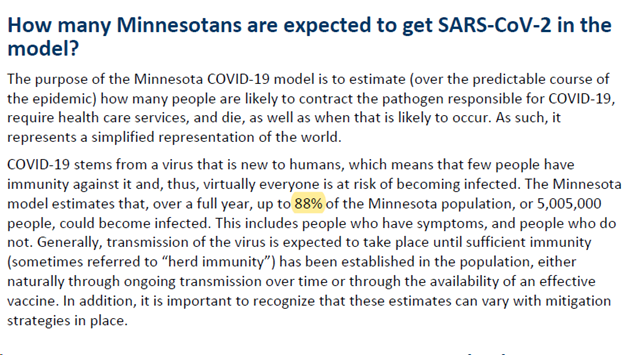
10/ The #MNmodel estimates that 88% of all Minnesotans will become infected if there’s no mitigation, and 79% with current mitigations. This results in more estimated total deaths.
11/ D. Asymptomatics.
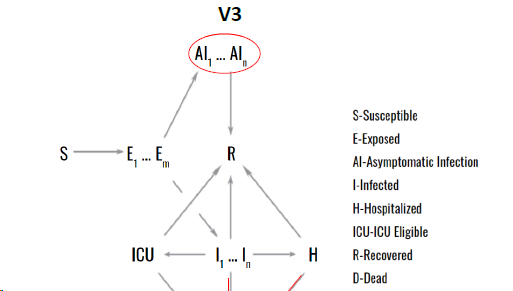
The #MNmodel improves its handling of asymptomatic cases in v3.
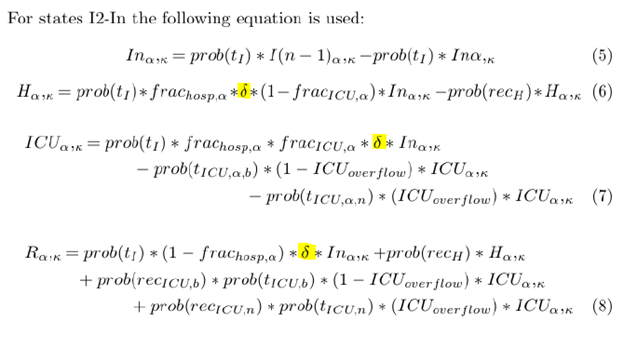
In v2, the model added this as an afterthought, and tacked on a “delta” parameter that cutout people who were asymptomatic from adding up in the hospital and death totals.
The #MNmodel improves its handling of asymptomatic cases in v3.
In v2, the model added this as an afterthought, and tacked on a “delta” parameter that cutout people who were asymptomatic from adding up in the hospital and death totals.
12/ In v2, the detection rate was set to 75% to exclude the asymptomatic cases.
In v3, due to emerging data, modelers smartly recognize that this is a large and important group and create a separate state for those who are asymptomatic. This is the “AI” state.
In v3, due to emerging data, modelers smartly recognize that this is a large and important group and create a separate state for those who are asymptomatic. This is the “AI” state.
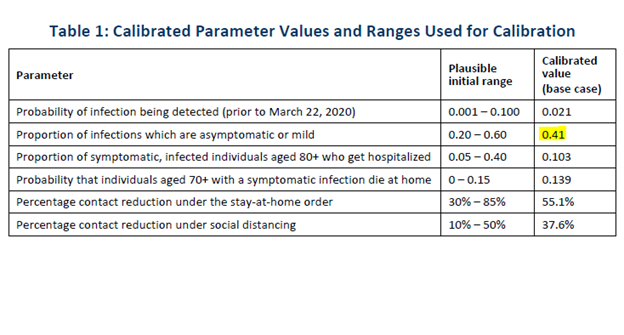
13/ In v3, they assume 59% of those infected are symptomatic. And 41% are asymptomatic or mildly symptomatic, and not detected. This is an improvement, but likely still too low.
14/ There is growing evidence that a high % of people who become infected are asymptomatic or mild and will not need healthcare nor be detected. This is likely the most critically underappreciated factor that will define the true fatality rate for covid19.
15/ Below are links to numerous reports to show this:
https://www.cnn.com/2020/04/01/europe/iceland-testing-coronavirus-intl/index.html
https://www.cnn.com/2020/04/0... href=" https://www.reuters.com/article/us-health-coronavirus-usa-military-sympt/coronavirus-clue-most-cases-aboard-us-aircraft-carrier-are-symptom-free-idUSKCN21Y2GB
https://www.reuters.com/article/u... href=" https://www.medrxiv.org/content/10.1101/2020.04.17.20053157v1
https://www.medrxiv.org/content/1... href=" https://www.governor.ny.gov/news/amid-ongoing-covid-19-pandemic-governor-cuomo-announces-results-completed-antibody-testing">https://www.governor.ny.gov/news/amid... https://www.boston.gov/news/results-released-antibody-and-covid-19-testing-boston-residents">https://www.boston.gov/news/resu...
https://www.cnn.com/2020/04/01/europe/iceland-testing-coronavirus-intl/index.html
16/ In addition, on 5/25/20 there were 21,315 reported cases. 12 days prior (to account for symptom & test lag), the #MNmodel estimates 285,000 Minnesotans were infected to date. That means 93% of infections had been asymptomatic or mild & undetected, much higher than 41%.
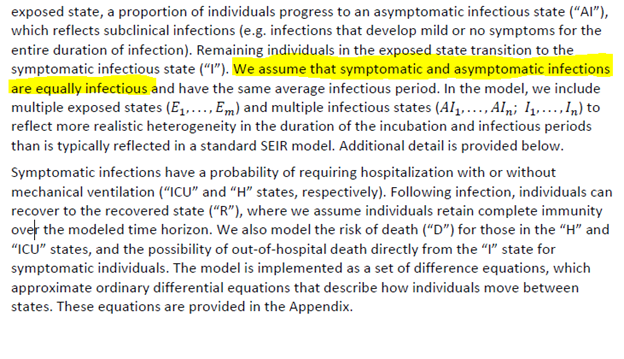
17/ The #MNmodel also treats asymptomatic and symptomatic people as equally infectious. It’s possible that in hindsight we will find asymptomatic infected people are less infectious. This is believed to be true with other viruses, like influenza. https://www.ncbi.nlm.nih.gov/pmc/articles/PMC2646474/">https://www.ncbi.nlm.nih.gov/pmc/artic...
18/ E. Hospitalization.
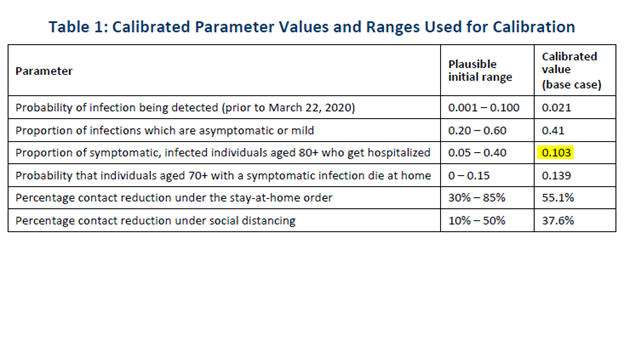
The #MNmodel uses an estimate for the 80+ age group (see below) in combination with a CDC study ( https://www.cdc.gov/mmwr/volumes/69/wr/mm6912e2.htm)">https://www.cdc.gov/mmwr/volu... to set the hospitalization risk for each of the 9 age groups.
The #MNmodel uses an estimate for the 80+ age group (see below) in combination with a CDC study ( https://www.cdc.gov/mmwr/volumes/69/wr/mm6912e2.htm)">https://www.cdc.gov/mmwr/volu... to set the hospitalization risk for each of the 9 age groups.
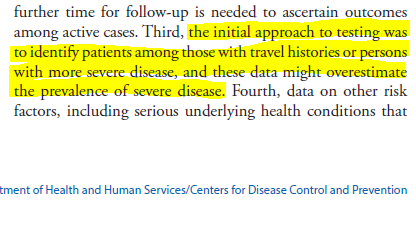
19/ The CDC study, however, analyzes lab-confirmed cases from people in Feb & Mar who largely went to hospitals with significant concerns. Thus, the CDC study sample is likely more severe than the general symptomatic population. See CDC excerpt below.
20/ In a more severe sample, risk differences across age groups are often less. For example, a 20yo and a 70yo with late stage cancer have more similar risks and face similar prognoses. Age is less of a factor, and the risk spread across age groups is narrower.
21/ Thus, risks for all ages under 80 in the #MNmodel may be effectively “pulled up” closer to the 80+ group.
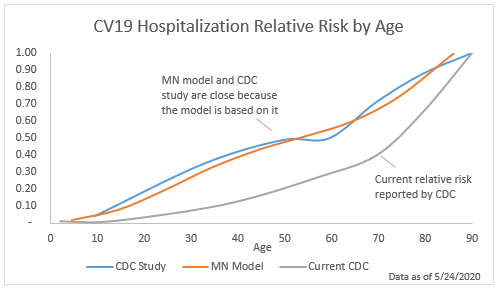
When comparing the #MNmodel relative risk curve and the curve from the CDC on 5/24/20 ( #hospitalizations">https://www.cdc.gov/coronavirus/2019-ncov/covid-data/covidview/index.html #hospitalizations),">https://www.cdc.gov/coronavir... the #MNmodel is visibly higher. See below.
When comparing the #MNmodel relative risk curve and the curve from the CDC on 5/24/20 ( #hospitalizations">https://www.cdc.gov/coronavirus/2019-ncov/covid-data/covidview/index.html #hospitalizations),">https://www.cdc.gov/coronavir... the #MNmodel is visibly higher. See below.
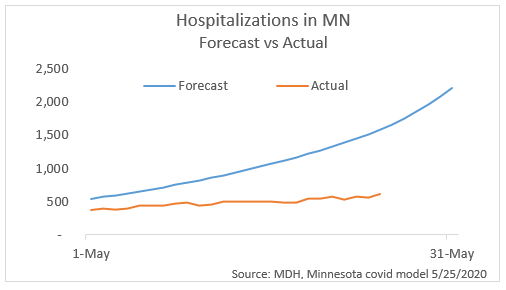
22/ This would result in higher hospitalization estimates. And, as shown below, the #MNmodel is already far off its forecast. The model estimates that every hospital bed in the entire state will be filled with patients at the peak in July.

 Read on Twitter