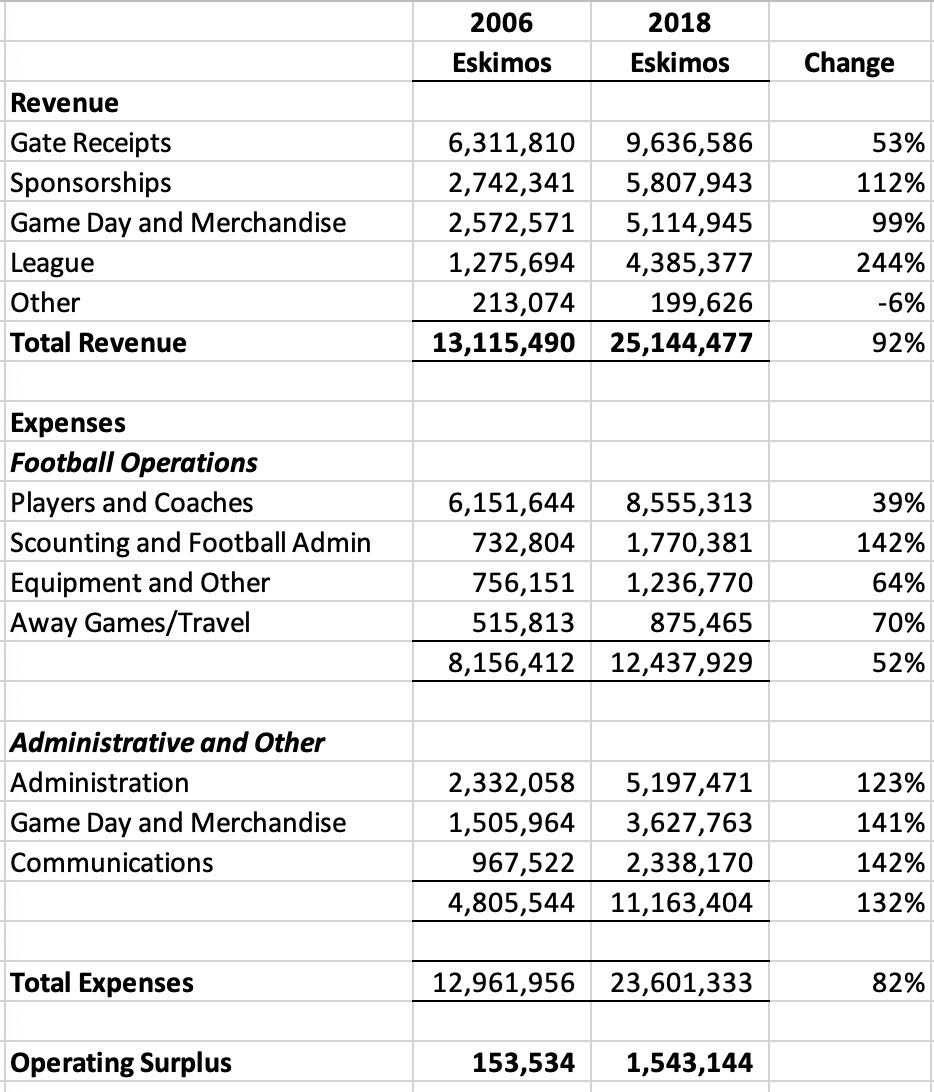
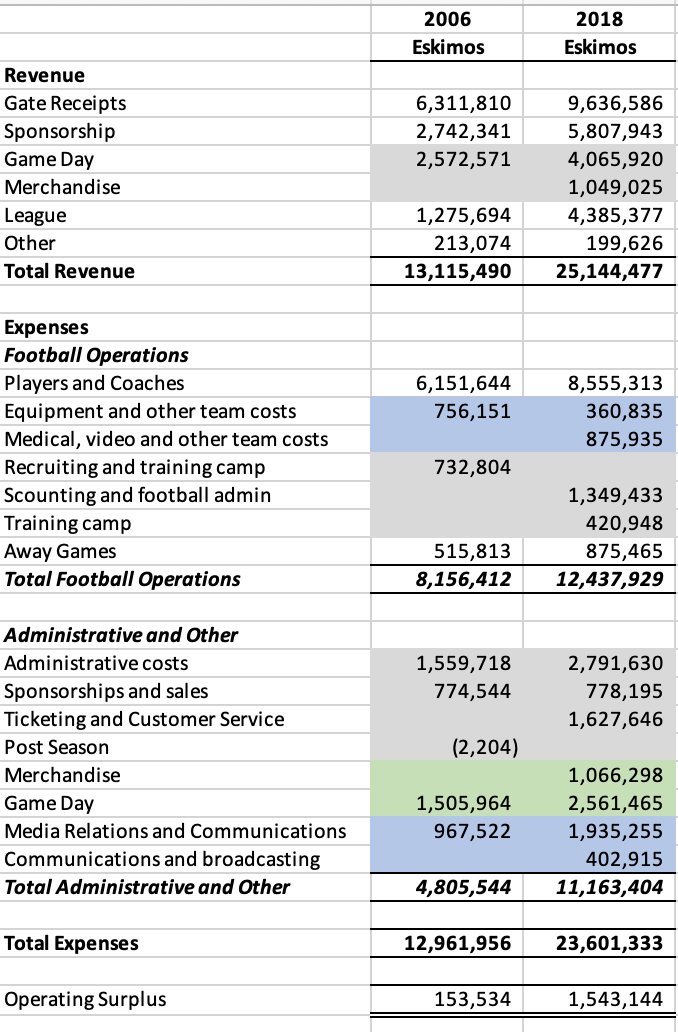
Returning to my analysis of the available #CFL team financials from last week, I think a comparative to prior years would also be helpful. So luckily I had an old copy of the Eskimos 2006 financials, and here they are compared to their 2018 financials....
The most striking thing is obviously, over 12 years the revenues and expenses have effectively doubled... which is especially notable when we know the inflation in Canada has only been 20% over the period...
Obviously the most focused on part is often player salaries. The SMS system wasn& #39;t introduced until 2007, but it was $4.05M so we could reasonably assume they would have spent around that much (plus an constant allocation of non-SMS transactions). The cap in 2018 was 5.2M.
So we know over this period, player salaries only really increased about 30%... which while above the 20% inflation, is dwarfed by the incredible 106% that other club expenditures have increased in that time
This is getting into why I contend that the CFL is actually suffering from some very significant administrative bloat. The Eskimos in 2006 were the flagship franchise of the league. One would wonder exactly what has changed that requires they spend more than double.
And as we remember from last week, their current expenditures are actually lower than the other "community owned" clubs in the league. Which high profile, these are really fairly simple businesses with the brunt of their administration focused on a handful of dates per year
The flip side is of course that revenues are also up massively in this time, to the tune of 92%. So maybe they& #39;re spending money to make money? But once you take out the league revenues which is kinda free money, the increase is ~75% driven largely by sponsorship and concessions
An impressive increase, yes, but lagging far behind the corresponding increase in expenses, which ideally would not be the case. So again, the question is why?

 Read on Twitter


