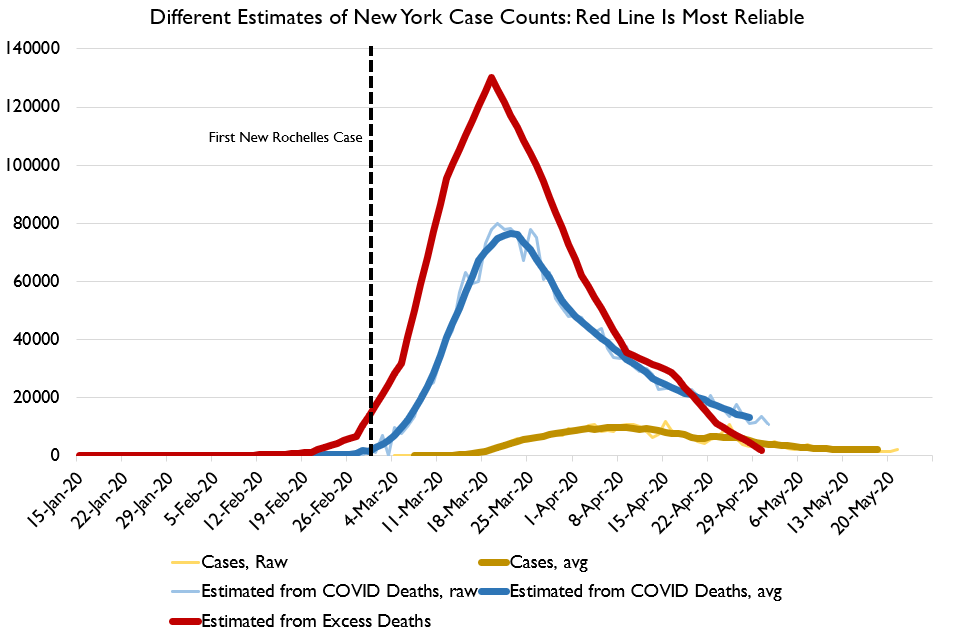
One thing I don& #39;t think enough people understand is that by the time the public was aware of the COVID epidemic on any real scale, ***it had already peaked***. Here& #39;s NY, for example, with epidemic size shown three ways. Most reliable estimates put peak infections at Mar 13-18!
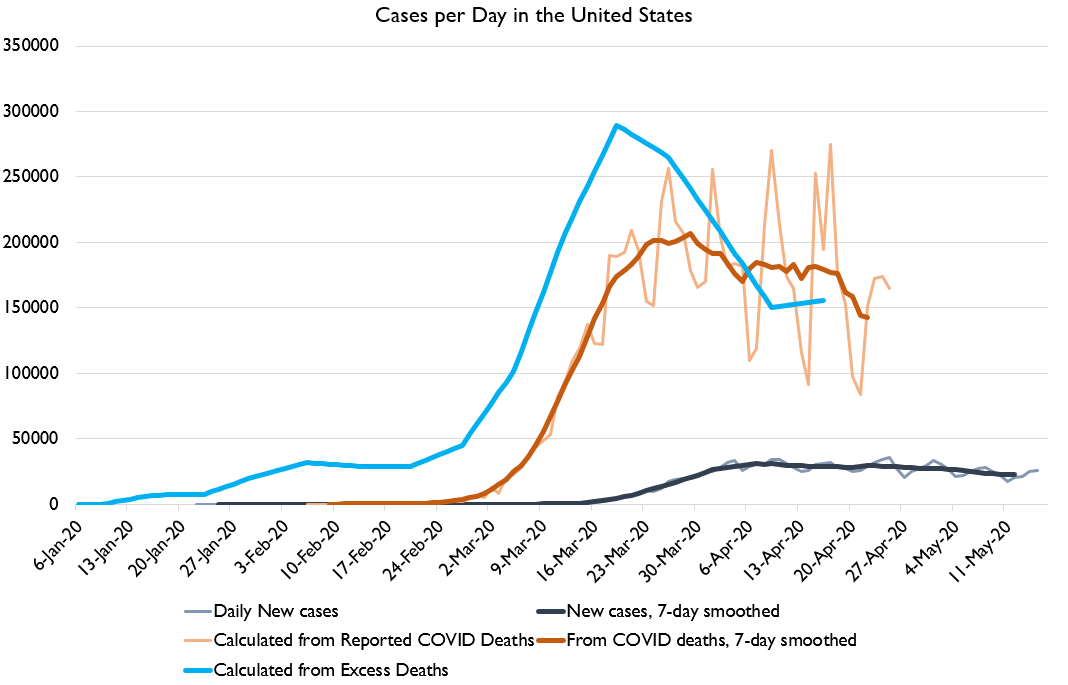
People have this delusion that US cases were exploding in April, but it& #39;s just not true. Using any plausible lag on any of the extant metrics of death with any assumed IFR, and you arrive at the conclusion that peak infections came in March, maybe EARLY March.
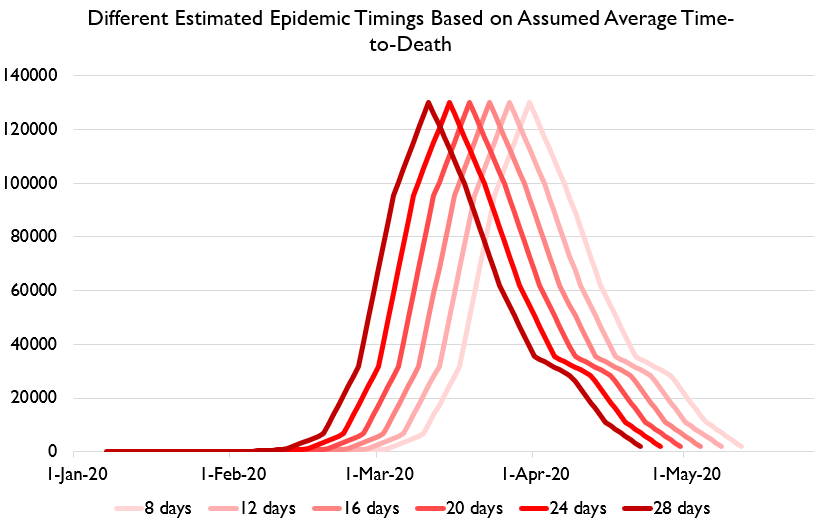
I think the excess deaths are the most reliable metric. Here& #39;s different implied infection curves based on different assumed time-to-death. Even if you assume average time-to-death of just 8 days, peak infection was March 31 in NY.
There are a bunch of simplifying assumptions here, of course. Reality is definitely noisier than this. But the point is that raw daily new infections were declining in March.
Common critique of one of my simplifying assumptions, but it& #39;s baseless. Because deaths vs. time is right-skewed (i.e. virtually no deaths <5 days after infection, but many >35!), adjusting for full distribution would push more infections EARLIER. https://twitter.com/tedfrank/status/1264750908421869570">https://twitter.com/tedfrank/...
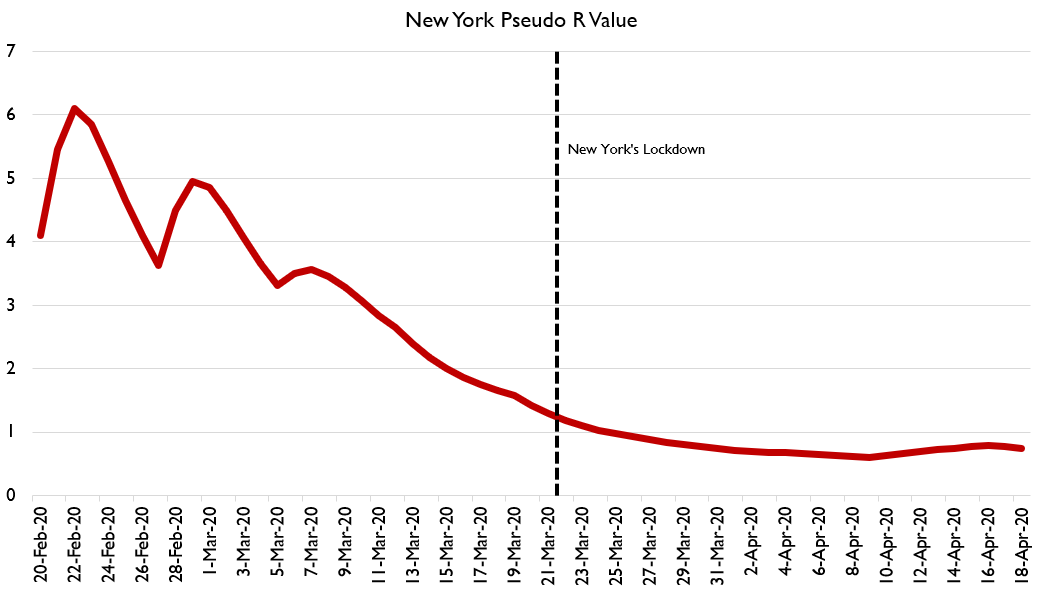
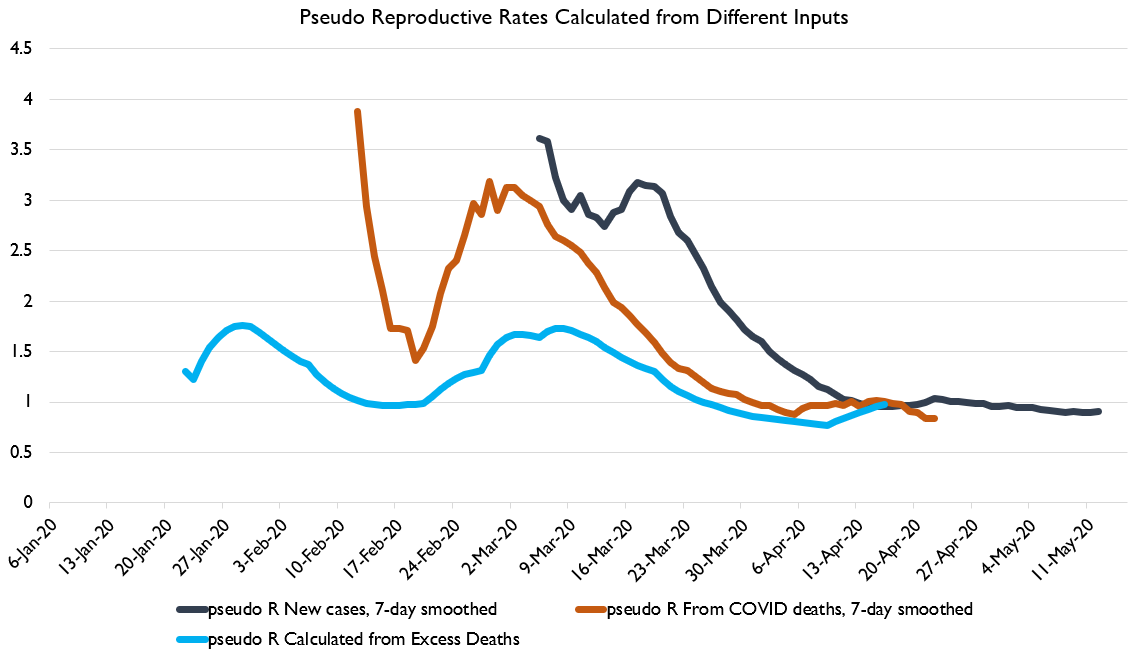
Anyways, here& #39;s an extremely crude pass at getting the effective R in New York. High early values are tricky because they would be pushed upwards by imported cases. But the point is, R pretty consistently between late Feb and early April!
Here& #39;s zoomed in a bit and with NY& #39;s lockdown marked. Really don& #39;t see where you& #39;d get the idea that the lockdown had a big effect.
By the way:
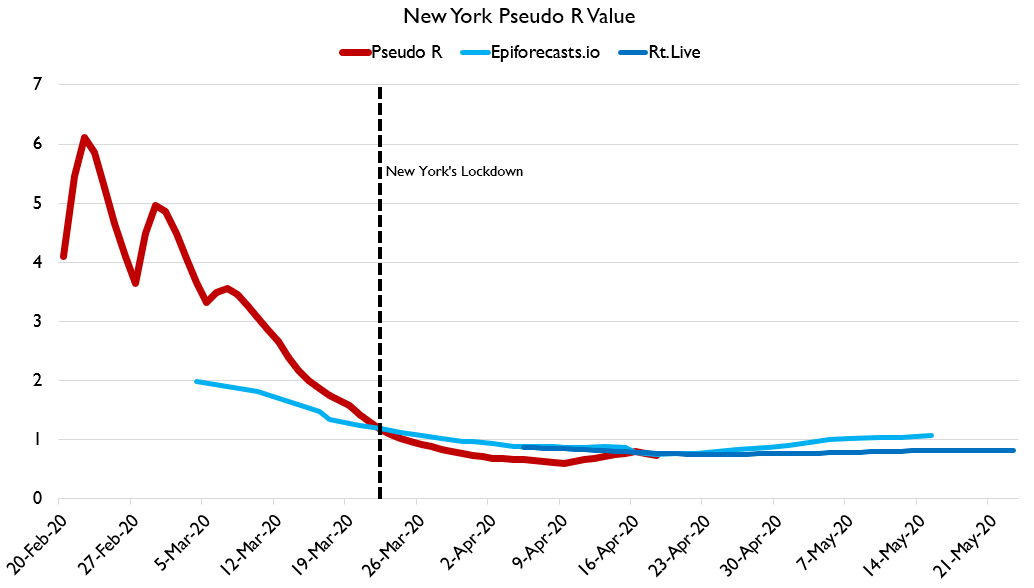
If you instead of using my death model use formal epidemiological coding of cases by inferred date of onset, you can be less crude. And here& #39;s my figure compared to two sources that do just that: both show peak R much earlier!
If you instead of using my death model use formal epidemiological coding of cases by inferred date of onset, you can be less crude. And here& #39;s my figure compared to two sources that do just that: both show peak R much earlier!
Unfortunately, those models don& #39;t comare paired with re-estimated "true infection totals." That& #39;s why I prefer my approach.
But the point is that COVID-19 was hitting America hard weeks before the data was showing it.
But the point is that COVID-19 was hitting America hard weeks before the data was showing it.
Nor is this just an NY thing! You can see that NATIONALLY true cases and true R peaked considerably before official cases or R crudely calculated from those cases!
Now, look. It& #39;s reasonable to say, "Lockdowns did not alter the trajectory of R right away, but they will keep R suppressed for longer." That might still be true!
Or you could say, "Maybe shelter orders didn& #39;t work, but it& #39;s still true that physical distancing was important!"
Or you could say, "Maybe shelter orders didn& #39;t work, but it& #39;s still true that physical distancing was important!"
That argument could still be true, since distancing began WAY before lockdowns did! I& #39;ve made that argument extensively and repeatedly, in fact!
But at this point, there simply is not an argument to be made that the primary policy tool governments used, lockdowns of various shapes and sizes, were important drivers of reduced infections. They may have nibbled around the edges a bit, but not much else.
Some folks asking why the very early declines: those are noisily estimated, and my estimate is a LOT higher than the formal epidemiological estimates. I suspect this is because I am not accounting for imports. Global travel slowdowns may have reduced imports in that window.

 Read on Twitter