Data thread thru 5/23
Sunday and the rollercoaster is about to go up
Data is from:
https://worldometers.info/coronavirus/country/us/
and">https://worldometers.info/coronavir...
https://github.com/CSSEGISandData/COVID-19/tree/master/csse_covid_19_data/csse_covid_19_time_series
Want">https://github.com/CSSEGISan... more Visuals?:
http://91-divoc.com/pages/covid-visualization/?fbclid=IwAR23aKz7_SXvzWR4YQPVTpqBujEZFqzPAMe01Ny1eaONJmZq6iRuHLy_fAU
Want">https://91-divoc.com/pages/cov... more info: https://twitter.com/AmericanNumbers/status/1256073790292885506">https://twitter.com/AmericanN...
How is everyone this fine day?
https://twitter.com/scottpasmoretv/status/1264394565861232640">https://twitter.com/scottpasm...
https://twitter.com/scottpasmoretv/status/1264394565861232640">https://twitter.com/scottpasm...
Public Service messages first:
Given the data? This is IMPORTANT
Please #WearMasks
You can make very good masks using these tips.
How to make different masks (tutorials):
https://knowm.org/a-current-list-of-diy-masks-for-the-covid-19-pandemic/
Here& #39;s">https://knowm.org/a-current... a longer video:
https://youtube.com/watch?v=2J3Fq4o-U4I&feature=youtu.be
Why">https://youtube.com/watch... should you wear masks:
I also put together a longer how to guide as to how to re-open
And we are re-opening without a lot of these
(feel free to make suggestions):
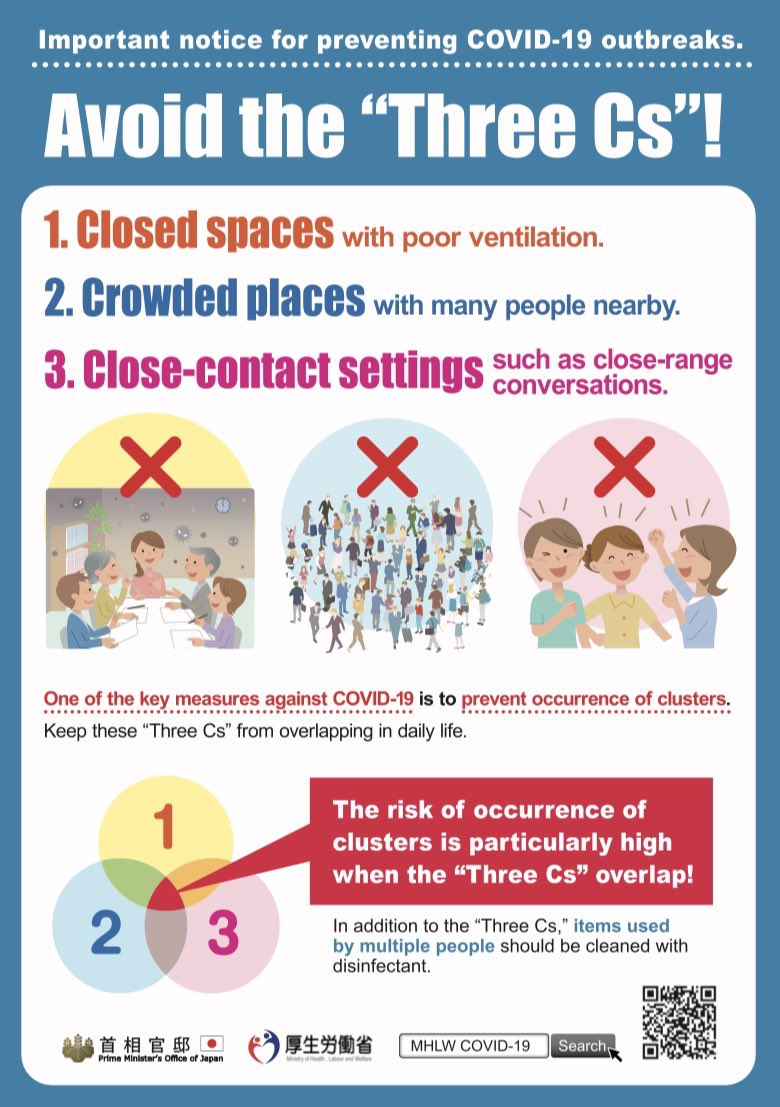
Now with a fancy and good japanese guideline.
Avoid the 3 Cs where possible.
https://twitter.com/AmericanNumbers/status/1254545616232943616">https://twitter.com/AmericanN...
And we are re-opening without a lot of these
(feel free to make suggestions):
Now with a fancy and good japanese guideline.
Avoid the 3 Cs where possible.
https://twitter.com/AmericanNumbers/status/1254545616232943616">https://twitter.com/AmericanN...
Note on Sports:
The Leagues know what they are doing and operating during a pandemic? Super precedented and understood for sports leagues.
Don& #39;t confuse sports with broader society.
https://www.axios.com/coronavirus-spanish-flu-baseball-1918-f498f2d4-7726-4a02-a5f5-59c63d982764.html
This">https://www.axios.com/coronavir... was always where I was coming from:
https://twitter.com/AmericanNumbers/status/1245890715592339457">https://twitter.com/AmericanN...
Let& #39;s do accreditation of the model we will refer to:
https://covid19-projections.com"> https://covid19-projections.com
by
@youyanggu
Why?
He tracks it against the actuals and it does the best.
For my DFS/Fantasy follows?
He& #39;s the covid @The_Oddsmaker https://twitter.com/youyanggu/status/1262149966249652224">https://twitter.com/youyanggu...
https://covid19-projections.com"> https://covid19-projections.com
by
@youyanggu
Why?
He tracks it against the actuals and it does the best.
For my DFS/Fantasy follows?
He& #39;s the covid @The_Oddsmaker https://twitter.com/youyanggu/status/1262149966249652224">https://twitter.com/youyanggu...
Where are we?
The Nadir. The low point.
Why?
R& #39;s been steadily climbing. And restrictions have eased.
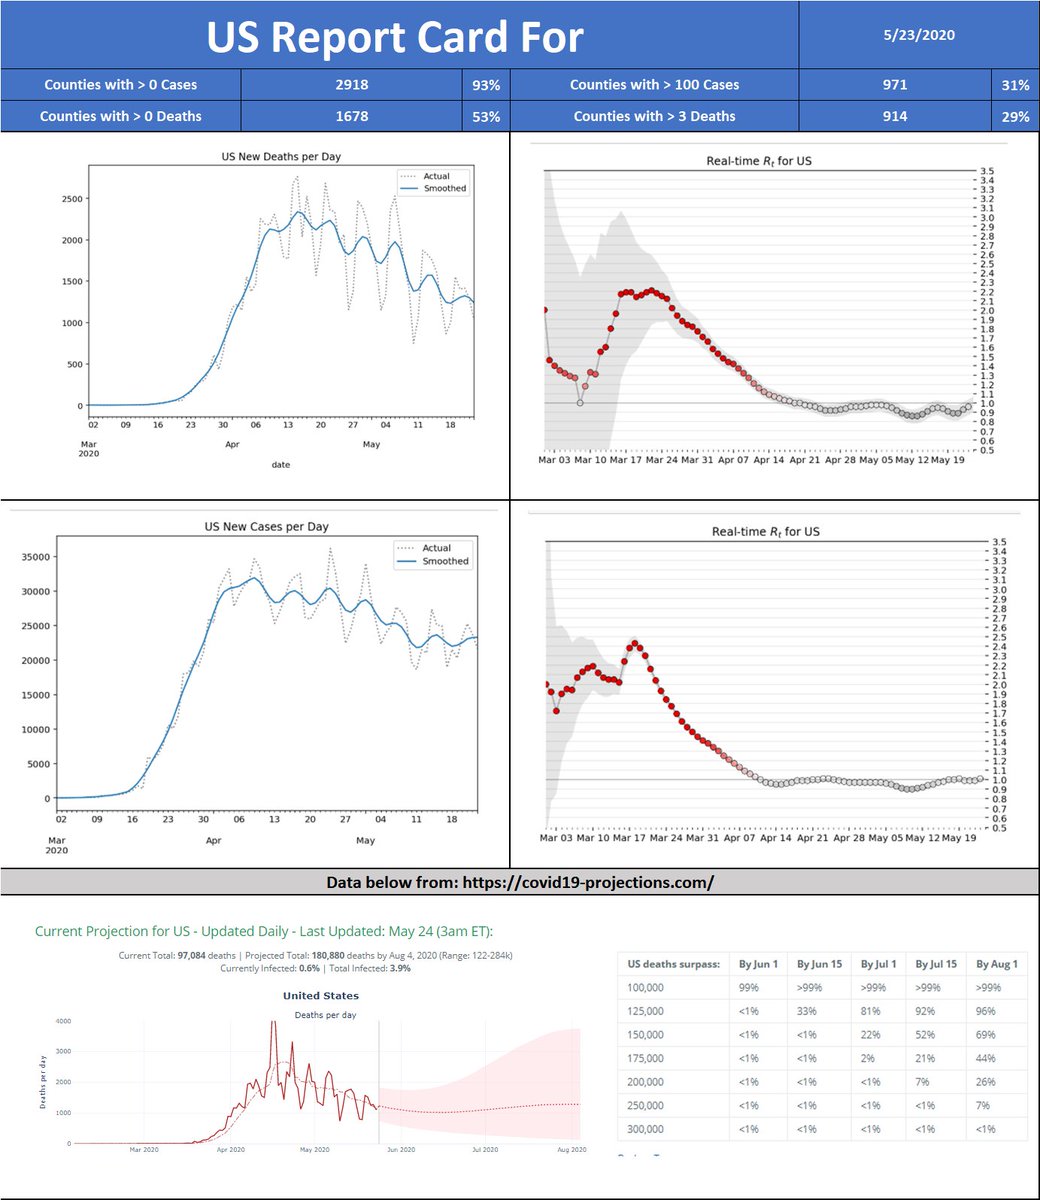
We are R=1 pretty much across the board in all the models.
See below and see https://covid19-projections.com"> https://covid19-projections.com
Yes this week was low but it& #39;s not dropping more at the moment.
"But it has dropped so far!" you say
The R=1 which is basically static and if you look at the news and the actions of our countrymen/women?
It& #39;s going up.
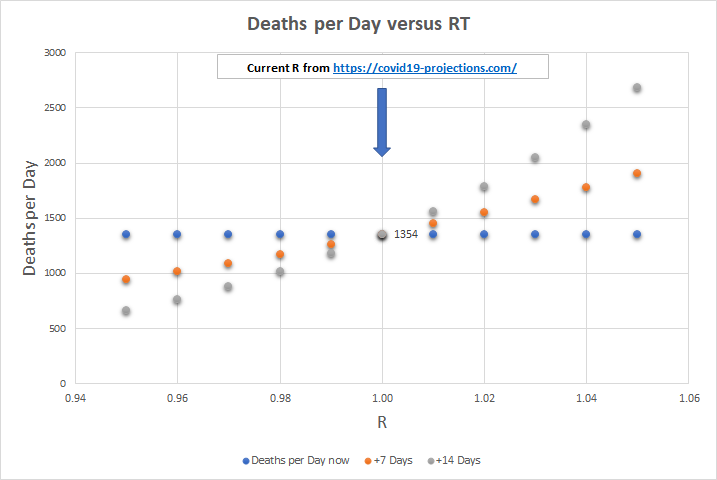
Projecting out? we& #39;ll be at 1354 average deaths if the #s hold (and the evidence is that they will or will get worse)
The R=1 which is basically static and if you look at the news and the actions of our countrymen/women?
It& #39;s going up.
Projecting out? we& #39;ll be at 1354 average deaths if the #s hold (and the evidence is that they will or will get worse)
How is the full US looking?
Small changes are big deal.
It would have been better to see a more significant drop before we reopened and started creating target rich environments for the Covid-19.
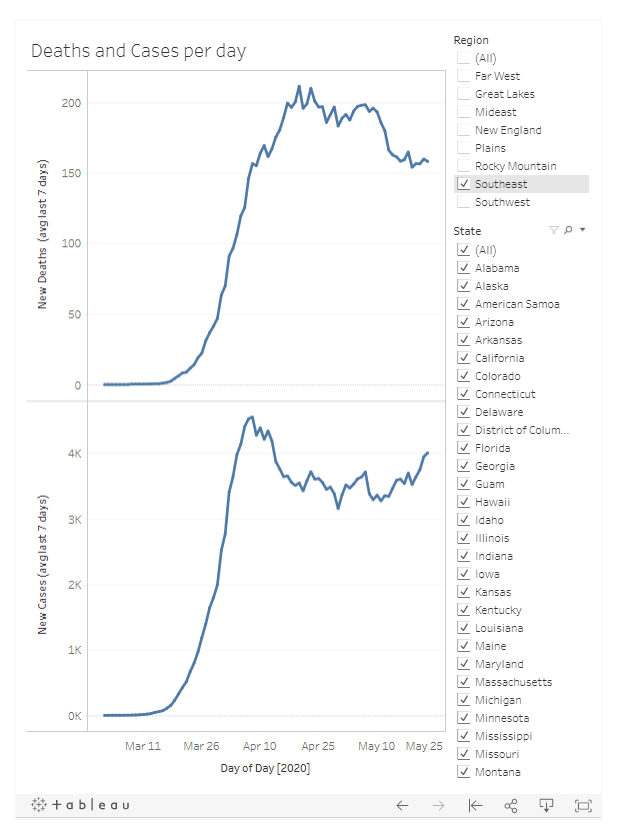
Rolling average deaths and Cases.
https://public.tableau.com/profile/arturo.galletti#!/vizhome/USStatedeathscases/NewperdayUS?publish=yes">https://public.tableau.com/profile/a...
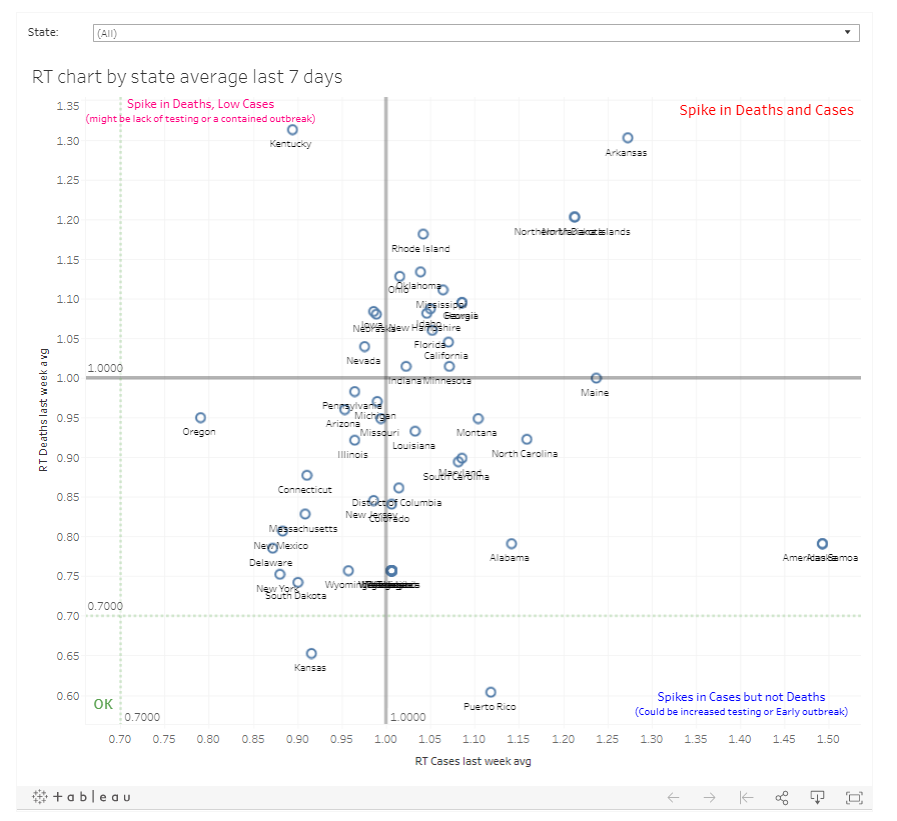
𝑅𝑡 by state from Cases and Deaths.
https://public.tableau.com/profile/arturo.galletti#!/vizhome/RTcompbystate/RTChartbyStateLast7avg?publish=yes
Average">https://public.tableau.com/profile/a... RTs of the last 7 days.
On the problem region:
Arkansas
Ky
ND
RI
Ok
Oh
Miss
GA/HI
Idaho
NH
Iowa
Neb
Fl
Cal
NV
RT high for Deaths/cases is at 16 (slight down)
High RT By Deaths, Low by Cases is to 4 (up)
Where is the core of the Outbreak?
Deaths state/county over time
https://public.tableau.com/profile/arturo.galletti#!/vizhome/Deathsbydateandcounty/DeathsByDayByCounty?publish=yes
It& #39;s">https://public.tableau.com/profile/a... still NY and NYC but Chicago/LA and NJ/PA are catching up.
I& #39;d expect a definitive shift soon.
Deaths state/county over time
https://public.tableau.com/profile/arturo.galletti#!/vizhome/Deathsbydateandcounty/DeathsByDayByCounty?publish=yes
It& #39;s">https://public.tableau.com/profile/a... still NY and NYC but Chicago/LA and NJ/PA are catching up.
I& #39;d expect a definitive shift soon.
New Outbreaks:
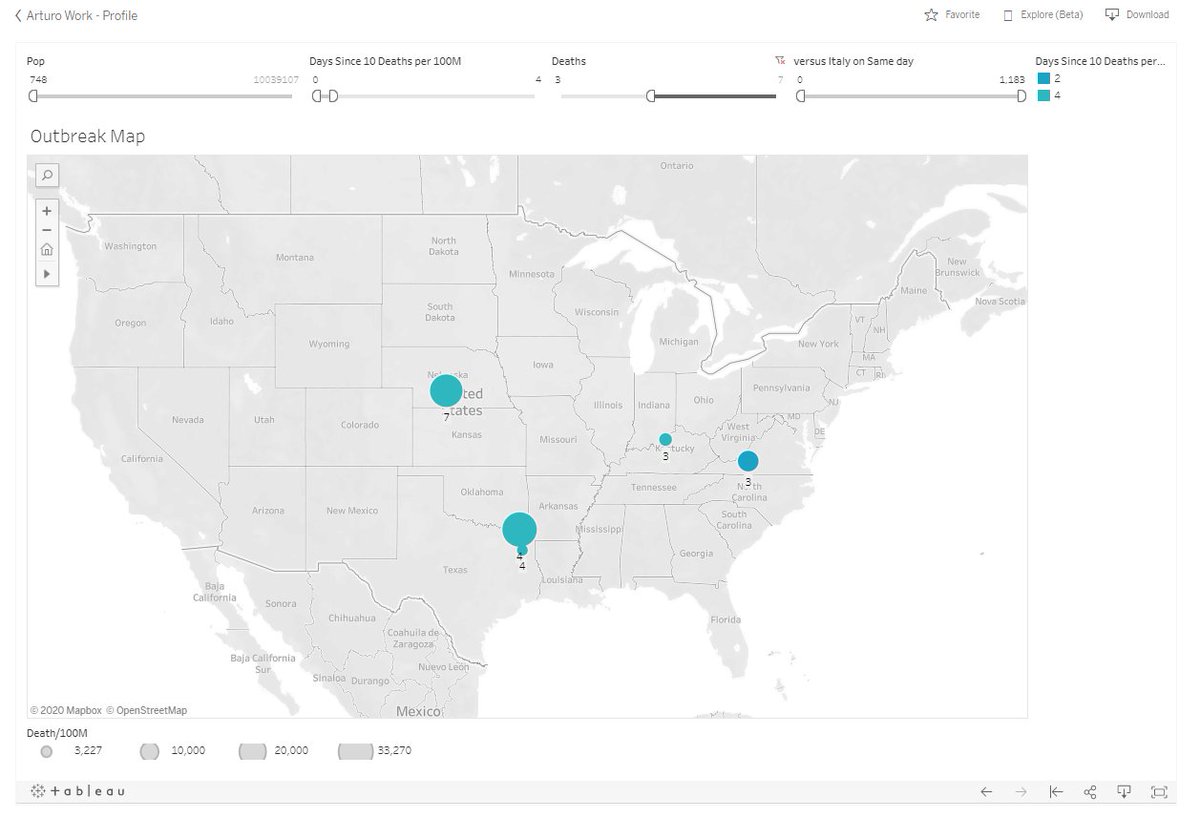
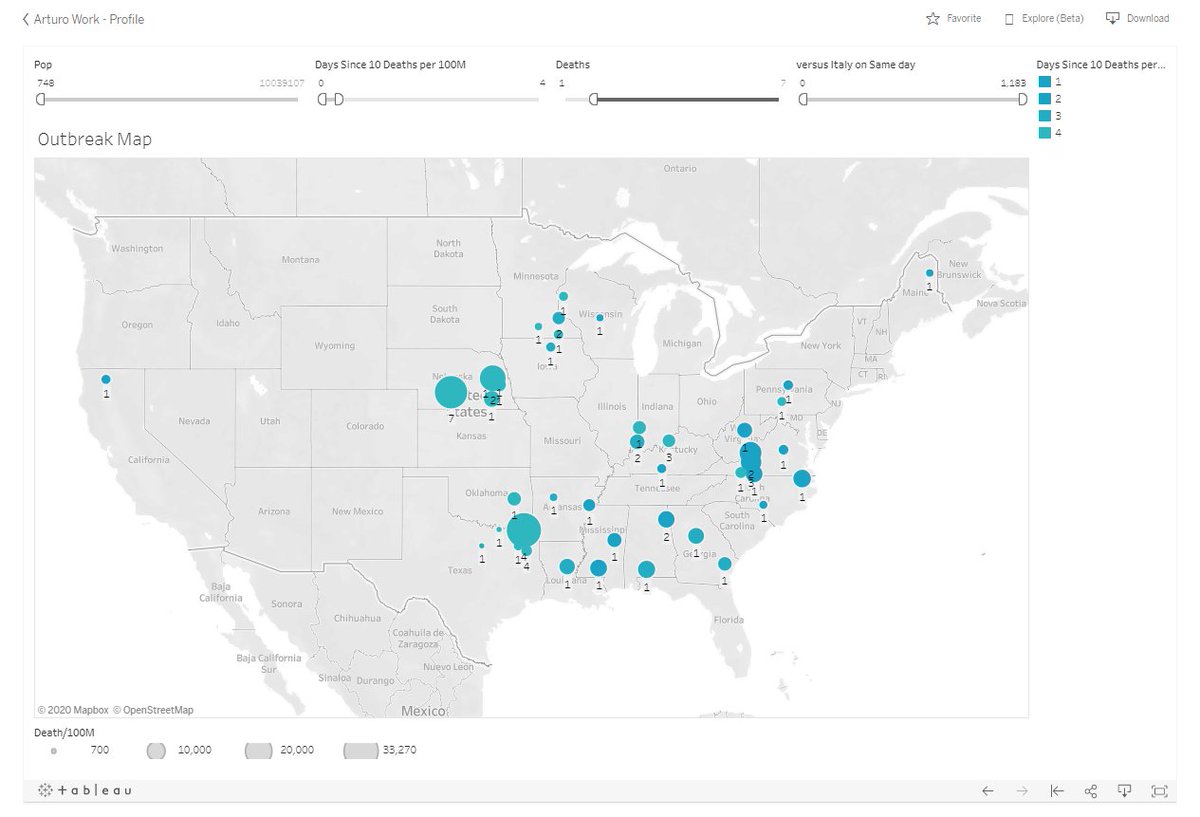
Color Coded Outbreaks Map : https://public.tableau.com/profile/arturo.galletti#!/vizhome/Covid19byCounty/OutbreakMap_1?publish=yes
Graph1">https://public.tableau.com/profile/a... is:
>3 deaths,<4 days
Lexington Neb.(7)
Red River Tx.(4)
Longview Tx.(4)
Oldham (Lousville) Ky (4)
Roanoke VA (3)
Some large new outbreaks last 4
smaller outbreaks in graph 2
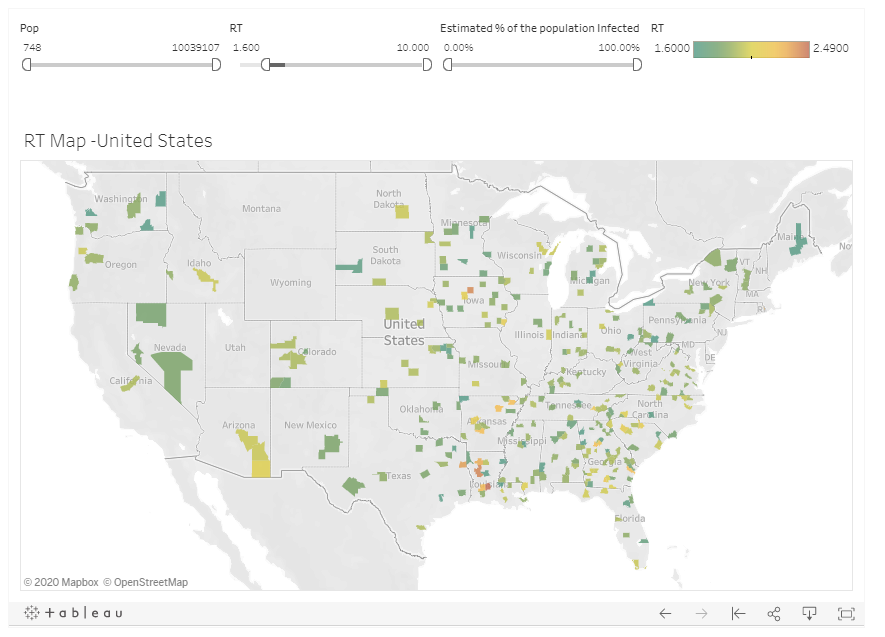
Wave 2 candidates:
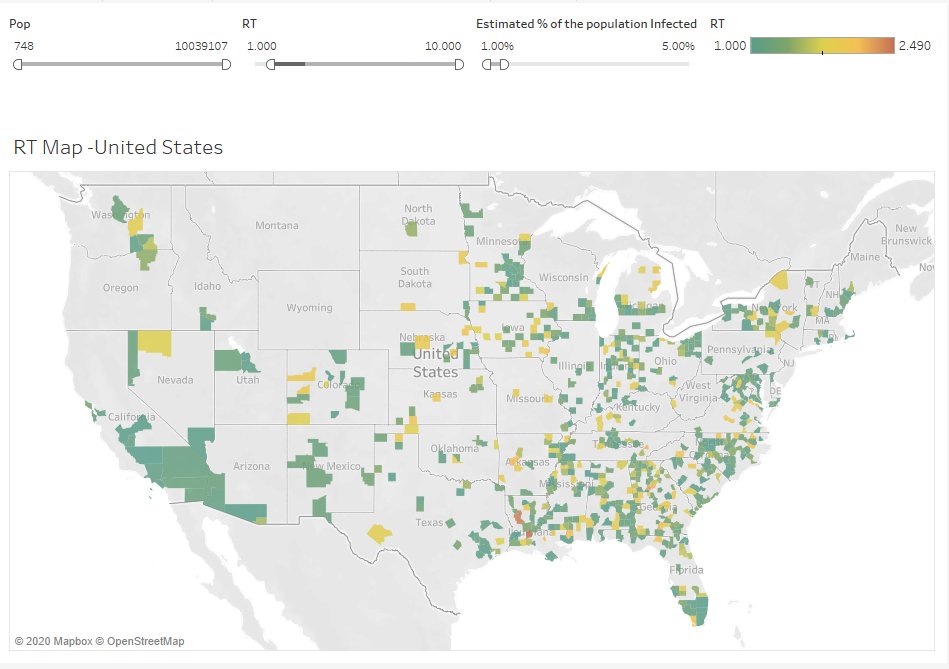
𝑅𝑡 approx by case by county (last 7 day avg.)
Map 1 is high 𝑅𝑡 counties (i.e. ripe for wave 2)
Map 2 is very high
Too busy for my taste.
There seems to be something similar to the NY spread happening around Lousiana/Al/GA now.
https://public.tableau.com/profile/arturo.galletti#!/vizhome/Covid19byCounty/RTMaps?publish=yes">https://public.tableau.com/profile/a...
Find Your County:
Tableau by county:
https://public.tableau.com/profile/arturo.galletti#!/vizhome/Covid19byCounty/Covid19byCounty?publish=yes
Sortable">https://public.tableau.com/profile/a... County tables with County details added:
https://public.tableau.com/profile/arturo.galletti#!/vizhome/Covid19byCounty/SortableCounties?publish=yes
County">https://public.tableau.com/profile/a... Tableaus Outbreaks Map Code :
https://public.tableau.com/profile/arturo.galletti#!/vizhome/Covid19byCounty/OutbreakMapCode_1?publish=yes
Seeing">https://public.tableau.com/profile/a... multiple Louisiana parishes & 2 Atlanta counties on this list is not good.
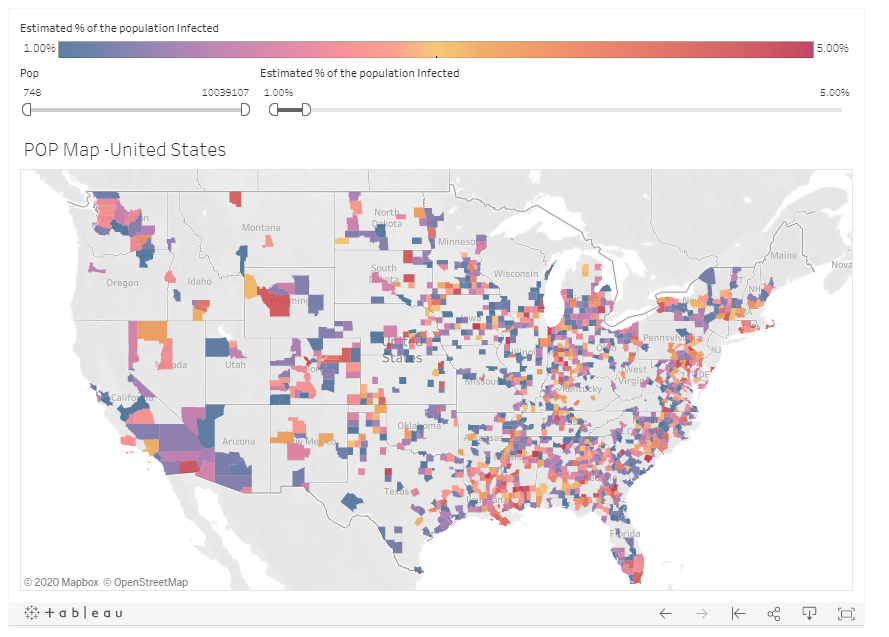
County Tableau showing estimated population exposure is also updated.
https://public.tableau.com/profile/arturo.galletti#!/vizhome/Covid19byCounty/PopulationExposure?publish=yes
Multipliers">https://public.tableau.com/profile/a... stable at 8x at the moment.
Let& #39;s look at >=1% <=5% and add in a map showing R>=1 for a view of "live" Counties.
SEC country, Southern Cal, Upstate NY, around DC, Midwest
Interactive Testing data.
Here& #39;s the testing data for every state and over time.
Last 7 days avg.
https://public.tableau.com/profile/arturo.galletti#!/vizhome/Testing_15893409734590/Dashboard2?publish=yes
US">https://public.tableau.com/profile/a... and Arkansas
Tests still rising but it seems like the fall in positives is slowing.
Arkansas seems to be indicative of the Southern states
Deaths
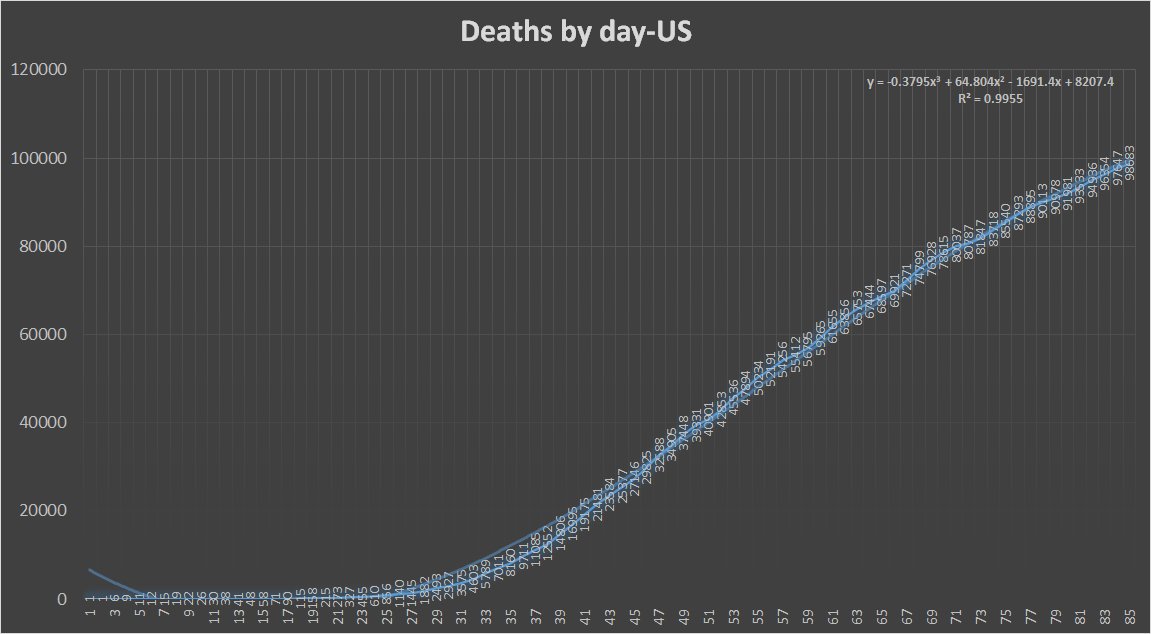
1036 for Saturday (50th so far)
This week was lower than last week (i& #39;d expect next week to be at best even though. Hope I& #39;m wrong)
99K thru today (as mentioned? 100K by tomorrow at some point)
1.2% growth
1036 for Saturday (50th so far)
This week was lower than last week (i& #39;d expect next week to be at best even though. Hope I& #39;m wrong)
99K thru today (as mentioned? 100K by tomorrow at some point)
1.2% growth
Death estimates from:
https://covid19-projections.com"> https://covid19-projections.com
are 181K by Aug. 4 (down 8k)
Total infected by then at 24.2M (up 3.2M 7.3%)
Wave 1 Peak 1st week of April
You& #39;ll note that wave 2 might be hitting peak around mid July.
175k deaths by aug 1 is 44%
200k is 26%
https://covid19-projections.com"> https://covid19-projections.com
are 181K by Aug. 4 (down 8k)
Total infected by then at 24.2M (up 3.2M 7.3%)
Wave 1 Peak 1st week of April
You& #39;ll note that wave 2 might be hitting peak around mid July.
175k deaths by aug 1 is 44%
200k is 26%
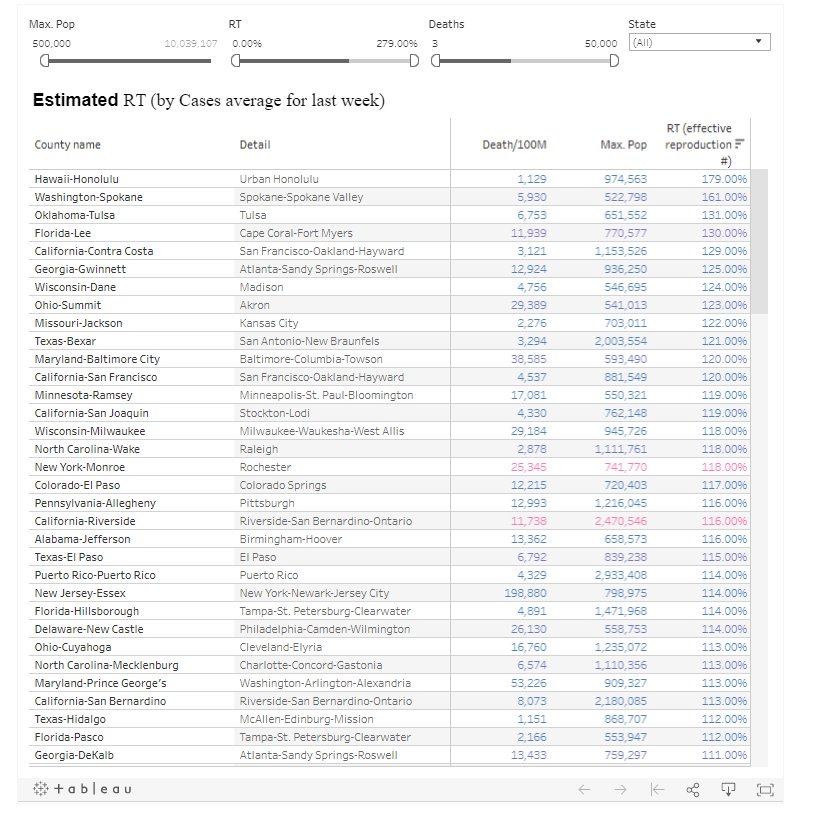
Outbreak timeline versus Rt (avg for last 7 days)
>500K
In a Chart:
https://public.tableau.com/profile/arturo.galletti#!/vizhome/Covid19byCounty/RTTimeline?publish=yes
The">https://public.tableau.com/profile/a... sorted Counties:
https://public.tableau.com/profile/arturo.galletti#!/vizhome/Covid19byCounty/RTbyCountyTable?publish=yes
Top">https://public.tableau.com/profile/a... 10 are:
Honolulu
Spokane
Tulsa
SF/Oak
Atlanta
Madison
Akron
KC
San Antonio

 Read on Twitter
